0863
MoDGAN: Unsupervised rigid motion detection and correction with generative adversarial networks1Department of Electrical and Electronic, Yonsei university, Seoul, Korea, Republic of
Synopsis
Rigid motion artifacts, which are caused by subject’s motion during MRI acquisition, are a significant problem of image degradation. In this study, we propose a GAN-based method for unsupervised rigid motion detection and correction. The proposed method detects the motion-corrupted phase encoding lines using an anomaly score for motion detection. To reduce motion artifacts, we replace them with corresponding lines that generator yielded. We show that proposed method achieves high accuracy in detecting motion-corrupted line without any hardware or modification in sequence. Furthermore, the results of motion correction also showed noticeable performance.
INTRODUCTION
Rigid motion artifacts are a significant problem, which are caused by incorrect k-space allocation because of subject’s motion during MR scan.1,2 There have been efforts to address this problem such as utilizing navigator echo3 or tracking devices in MR hardware4,5. However, these methods require additional device or sequence modification.In case of motion correction, deep learning-based methods have shown outstanding performance for reducing motion artifact recently.6,7 Since there is a burden to obtain pairs of motion-free and motion-corrupted dataset, motion simulated data is utilized as an alternative. However, it is difficult to completely imitate realistic in-vivo motions in practice.
In this work, we propose a new motion detection and correction framework using unsupervised deep learning method. A main idea of proposed method is calculating an anomaly score for each k-space line to detect lines that motion induced. Additionally, to reduce motion artifacts we replaced detected lines with corresponding k-space lines of generator’s output.
METHODS
The proposed method consists of three steps as shown in Fig.1.[Image-latent Z -Image(IZI) mapping]
For the unsupervised method, IZI-mapping8 was utilized, which is widely used in anomaly detection.9 There are two training stage for IZI-mapping. And we used only motion-free data for both training stage (Fig.2-a). A generator was trained to yield images representing motion-free anatomy in the GAN training stage. Using a trained generator, an encoder was trained for inverse mapping in Encoder training stage. As a result (Fig.2-b), a motion-free input is mapped to latent space by the encoder and subsequently generator maps latent space to output image that resembles to input as follows: $$x\rightarrow z=E(x)\rightarrow \hat{x}=G(E(x))$$
[Motion detection]
Among various type of motion, a sudden motion such as swallowing causes a few successive k-space line to be inconsistency. We tried to detect these incorrect k-space lines by scoring the error in each phase-encoding (PE) lines. The anomaly score at n-th PE line is calculated as follows:
$$k_{h}=H\cdot F_{2D}(x)$$
$$\hat{k}_{h}=H\cdot F_{2D}(G(E(x)))$$
$$Anomaly\ score(n)=\frac{1}{N}\sum_i^N\mid k_{h}(n,i)-\hat{k}_{h}(n,i)\ \mid \times 1000$$
where $$$G(E(x))$$$ is the reconstructed image from input $$$x$$$; $$$F_{2D}$$$ and $$$H$$$ denote 2D Fourier transform and high-pass filter, respectively; $$$k_{h}(n,i)$$$ and $$$\hat{k}_{h}(n,i)$$$ denote a complex value at n-th PE step and i-th frequency-encoding(FE) step in high pass filtered k-space; N is total FE steps; Anomaly score represents an average of errors between input and reconstructed output at each PE line. Therefore, there are higher errors at corrupted PE lines compared to normal lines.
After obtaining the anomaly score for each PE line with input x and G(E(x)), the motion detection is performed by considering the PE line which has an upper score than a threshold as a motion corrupted line. The threshold was determined to 46, which showed the highest f-score (Table 1).
[Motion correction]
The proposed method for motion correction is replacing the detected PE lines with corresponding lines that generator reconstructed.
$$k_{c}(n)=\begin{cases}\hat{k}_{h}(n), & Anomaly\ score(n)\geq threshold\\k_{h}(n), & otherwise\end{cases}$$
$$x_{c}=F_{2D}^{-1}(k_{c})$$
Where $$$k_{c}(n),\hat{k}_{h}(n)$$$ and $$$k_{c}(n)$$$ denote complex values at n-th PE line in k-space of input x, reconstructed and motion corrected data; $$$x_{c}$$$ denotes motion corrected output; $$$F_{2D}^{-1}$$$ denotes 2D inverse Fourier transform.
[Data acquisition]
2D Spin-Echo data were acquired from 26 healthy in-vivo for training and 5 motion in-vivo for evaluation with following scan parameters:
3T MRI, TR/TE=1500/20ms, matrix size=192×192, resolution=1×1×3mm3, 25slices, 16coils.
[Evaluation]
The evaluation was performed using motion-simulated and in-vivo data. A motion-simulation is performed using View2Dmotion, a motion-simulation package.10 To acquire paired in-vivo motion data, subjects were instructed to be scanned without movement for the first scan and with movement for the second scan when instructor command to move.
For evaluation of detection, we used location of several lines, which are intentionally corrupted by simulation, as a label. And time points, subjects were informed to move, were used as a label for in-vivo data.
For evaluation of correction, we applied Simultaneous Auto-calibrating and K-space Estimation (SAKE)11 as a comparative method to reconstruct corrupted lines. The SSIM, PSNR values of SAKE and MoDGAN were compared.
RESULTS
Fig.3 shows detection results for various input case (motion-free, motion-simulated, and in-vivo motion). While anomaly was not detected for motion-free input, several k-space lines were detected as an anomaly for motion-corrupted input (red dots). Except few cases (yellow dots), most of detection results were corresponded to the ground truth (orange region). A quantitative evaluation for detection also showed reliable results as summarized in Table 1.As shown in Fig.4, the proposed method showed higher SSIM and PSNR values than SAKE method. When visually observed, motion artifacts were effectively reduced in both method (yellow arrow). However, some artifacts remained in SAKE (red arrow).
Discussion and Conclusion
We proposed a GAN-based motion detection and correction method using unsupervised learning that does not require a paired dataset. We also proposed a new perspective in introducing the anomaly score for motion detection. Moreover, it has a great advantage in that it performs motion detection and correction tasks in a single model.Since the model has never seen motion-corrupted data for unsupervised learning, there was a limitation to generate clear image when input of model is motion-corrupted data. Nevertheless, the proposed method showed stable results for detection. In addition, motion artifact was reduced effectively compared to comparative method.
Acknowledgements
No acknowledgement found.References
1. Heiland S. From A as in aliasing to Z as in zipper: artifacts in MRI. Clinical neuroradiology 2008;18(1):25-36.
2. Zaitsev M, Maclaren J, Herbst M. Motion artifacts in MRI: A complex problem with many partial solutions. Journal of Magnetic Resonance Imaging 2015;42(4):887-901.
3. Bosak E, Harvey PR. Navigator motion correction of diffusion weighted 3D SSFP imaging. Magnetic Resonance Materials in Physics, Biology and Medicine 2001;12(2):167-176.
4. Ooi MB, Krueger S, Thomas WJ, Swaminathan SV, Brown TR. Prospective real‐time correction for arbitrary head motion using active markers. Magnetic Resonance in Medicine: An Official Journal of the International Society for Magnetic Resonance in Medicine 2009;62(4):943-954.
5. Sengupta S, Tadanki S, Gore JC, Welch EB. Prospective real‐time head motion correction using inductively coupled wireless NMR probes. Magnetic resonance in medicine 2014;72(4):971-985.
6. Pawar K, Chen Z, Shah NJ, Egan GF. MoCoNet: motion correction in 3D MPRAGE images using a convolutional neural network approach. arXiv preprint arXiv:180710831 2018.
7. Duffy BA, Zhang W, Tang H, Zhao L, Law M, Toga AW, Kim H. Retrospective correction of motion artifact affected structural MRI images using deep learning of simulated motion. 2018.
8. Schlegl T, Seeböck P, Waldstein SM, Langs G, Schmidt-Erfurth U. f-AnoGAN: Fast unsupervised anomaly detection with generative adversarial networks. Medical image analysis 2019;54:30-44.
9. Schlegl T, Seeböck P, Waldstein SM, Schmidt-Erfurth U, Langs G. Unsupervised anomaly detection with generative adversarial networks to guide marker discovery. 2017. Springer. p 146-157.
10. Lee S, Jung S, Jung K-J, Kim D-H. Deep Learning in MR Motion Correction: a Brief Review and a New Motion Simulation Tool (view2Dmotion). Investigative Magnetic Resonance Imaging 2020;24(4):196-206.
11. Shin PJ, Larson PE, Ohliger MA, Elad M, Pauly JM, Vigneron DB, Lustig M. Calibrationless parallel imaging reconstruction based on structured low‐rank matrix completion. Magnetic resonance in medicine 2014;72(4):959-970.
Figures
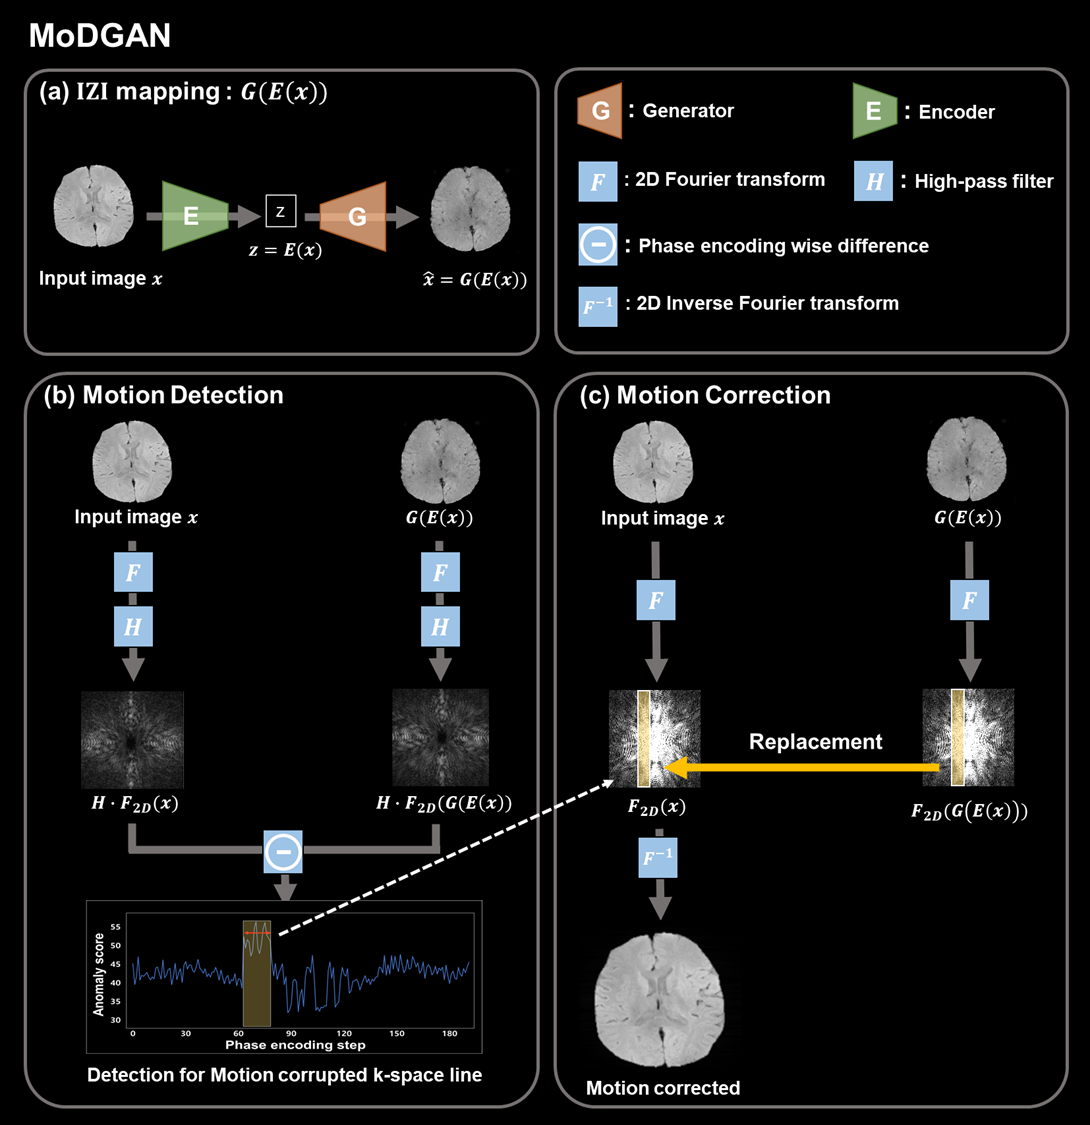
Figure 1. Proposed motion detection and correction process
The process of MoDGAN consists of three steps: (a) Image-latent Z-Image mapping, (b) Motion detection through anomaly scoring, (c) Motion correction by replacing detected motion corrupted lines.
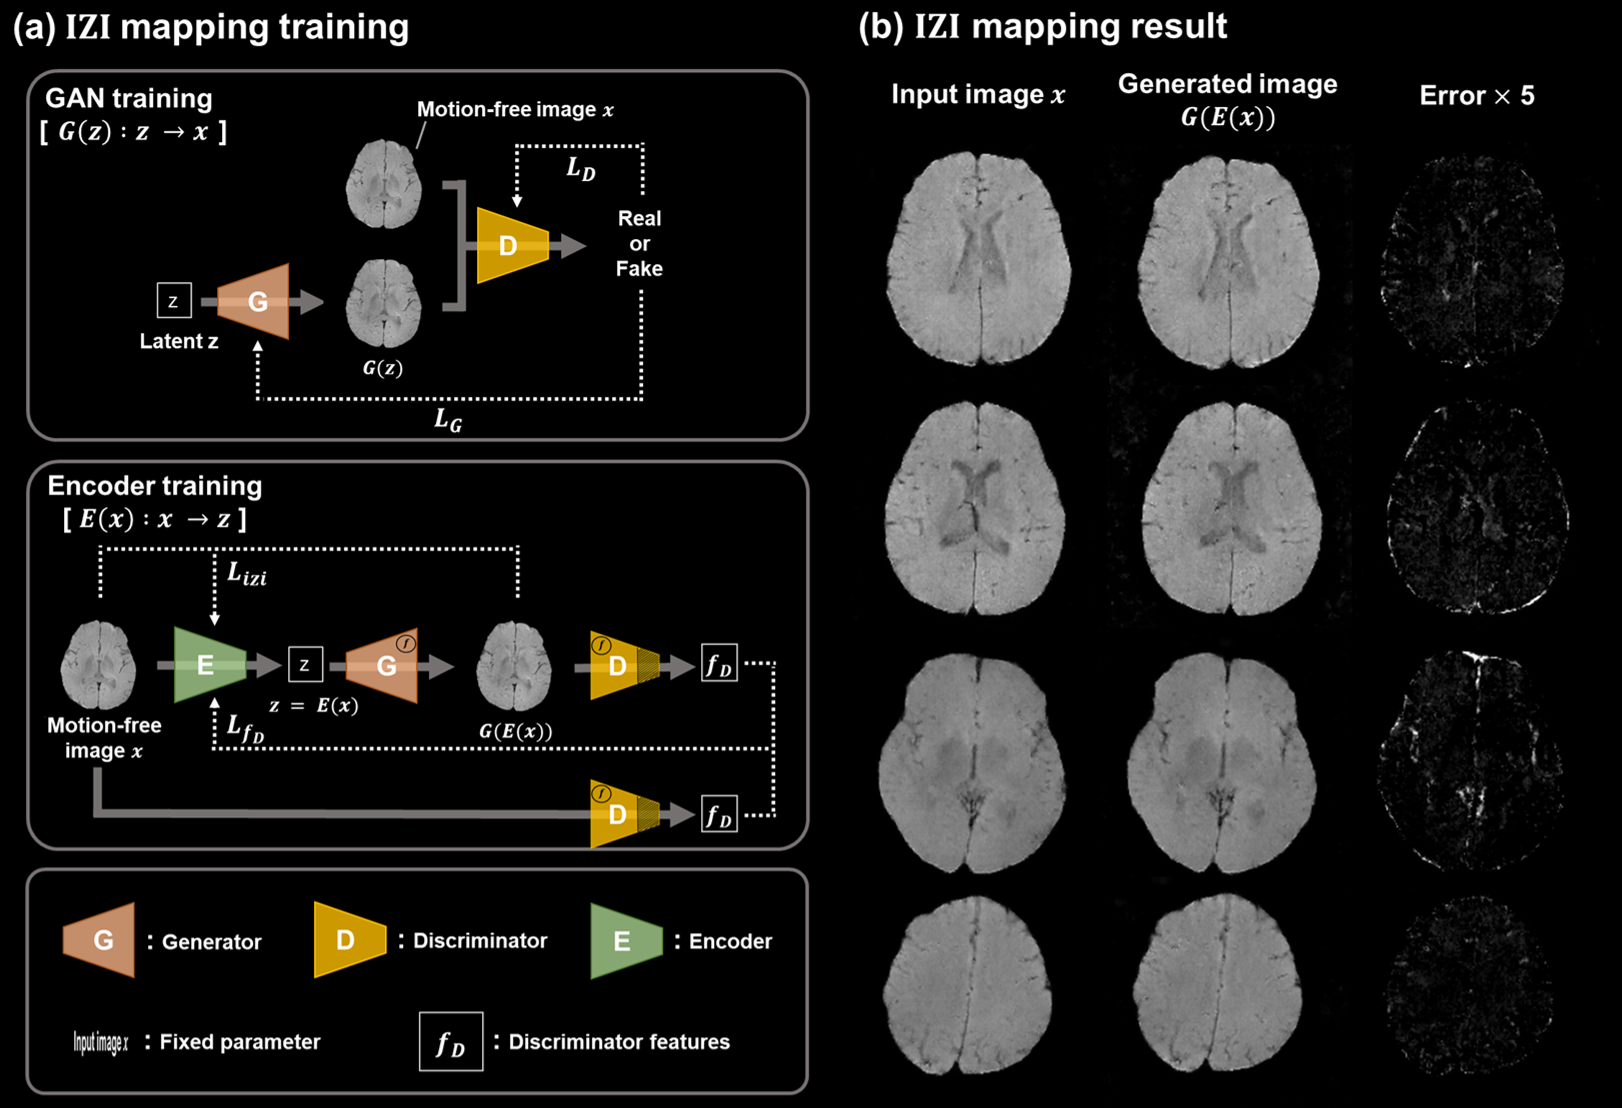
Figure 2. Image- latent Z- Image (IZI) mapping
(a)Training process of IZI-mapping. We trained a generative adversarial networks in first stage. In the second stage, the encoder is trained using the trained generator from previous stage. (b) IZI-mapping result of motion-free input with error map between input and mapping result .

Table 1. Quantitative evaluation of motion detection
Accuracy, Sensitivity, Precision, F-score were used for quantitative metrics. These metrics were calculated for (a) motion-simulated data and (b) in-vivo motion data under various threshold values.
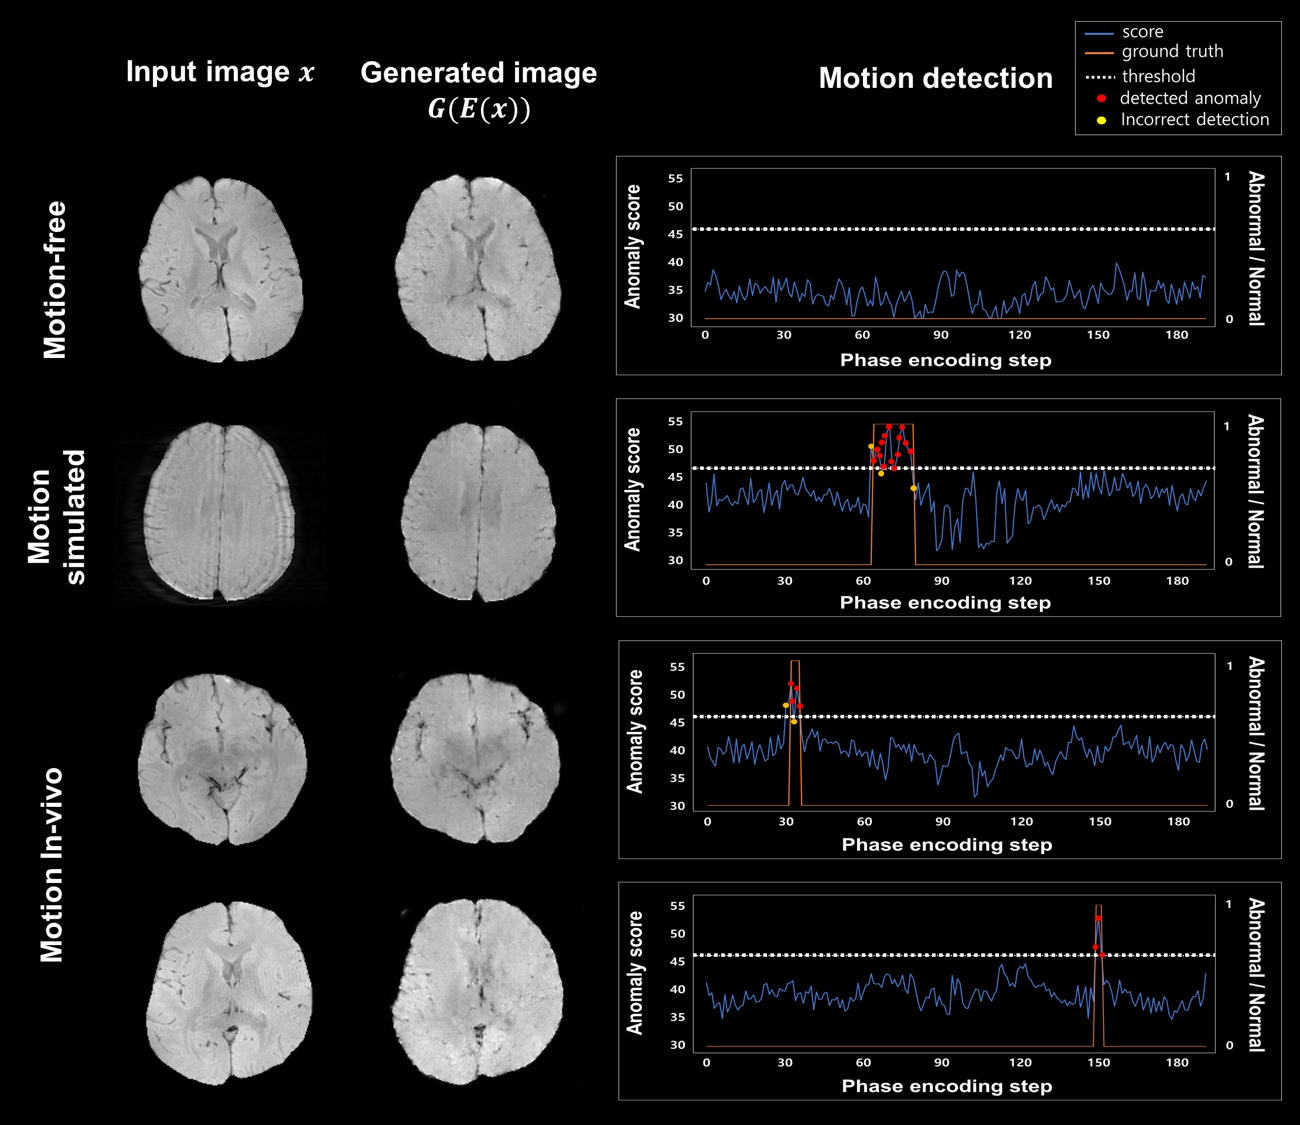
Figure 3. Evaluation of motion detection on motion-free, motion-simulated, motion in-vivo data.
First column: various case of evaluation input. Second column: corresponding outputs which were reconstructed through IZI-mapping. Third column: result of motion detection using anomaly score.
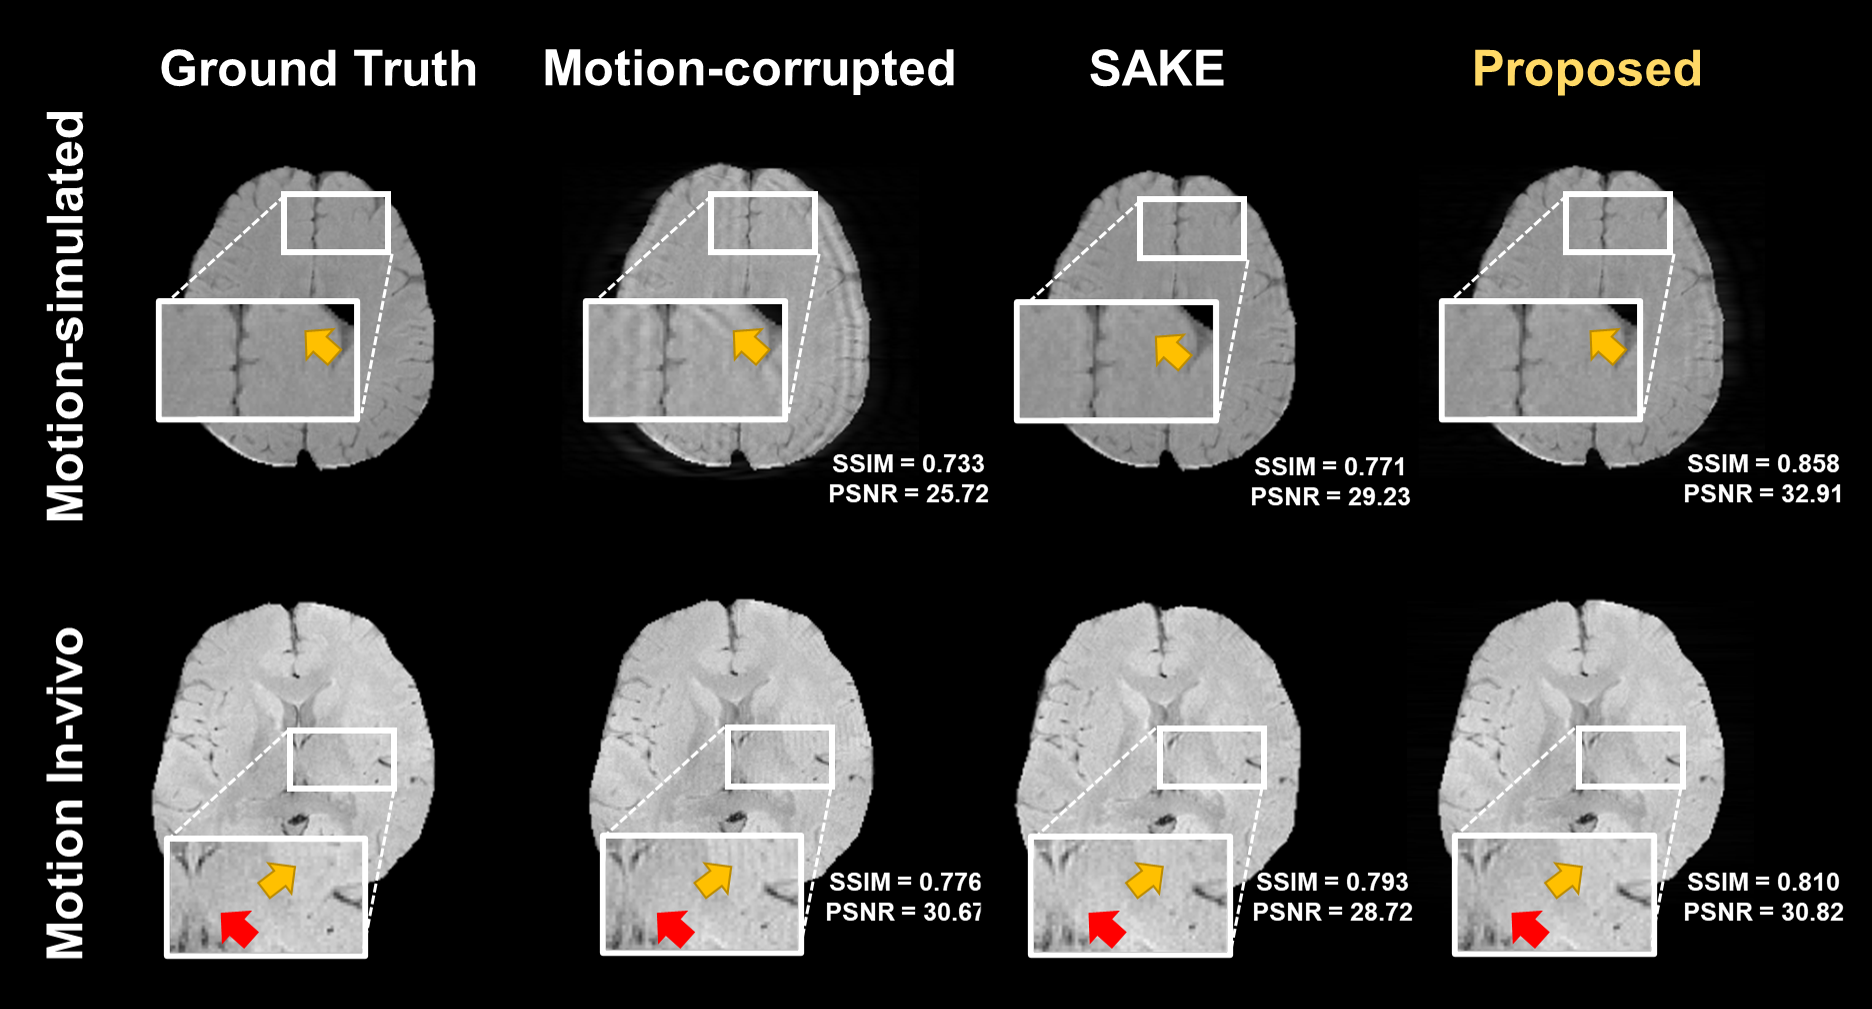
Figure 4. The results of motion correction and quantitative evaluation. Ground truth images and motion corrupted inputs are shown in first and second column. Results of motion correction through the two kinds of motion correction method (SAKE and MoDGAN) are shown in third and fourth column. Quantitative metrics (SSIM and PSNR) between ground truth and results of each method are summarized in corner of each result.