0854
Explaining variation in DTI parameters with meningioma microscopy: A comparison between a neural network and an image-feature-based approach1Medical Radiation Physics, Lund University, Lund, Sweden, 2Department of Applied Mathematics, Faculty of Information Technology, Czech Technical University, Prague, Czech Republic, 3Division of Oncology and Pathology, Department of Clinical Sciences, Lund University, Skåne University Hospital, Lund, Sweden, 4Russell H. Morgan Department of Radiology and Radiological Science, Johns Hopkins University School of Medicine, Baltimore, MD, United States, 5F.M. Kirby Research Center for Functional Brain Imaging, Kennedy Krieger Institute, Baltimore, MD, United States, 6Diagnostic Radiology, Clinical Sciences Lund, Lund University, Lund, Sweden
Synopsis
Diffusion MRI reflects tissue microstructure and mean diffusivity (MD) and fractional anisotropy (FA) are often readily interpreted in terms of cellularity and cell anisotropy, respectively. Here, we investigated to which degree histological features accounts for their variations in fixed sections of meningioma tumors. Histological slices were quantified in terms of cellularity and cell anisotropy, or by a neural network. Results show that in some cases the majority of the variation can be attributed to cellularity whereas in others none. Similarly, in some samples only a minority of the variability is attributable to the variability in FA explained by neural network.
Introduction
Mean diffusivity (MD) and fractional anisotropy (FA) from diffusion tensor imaging (DTI) reflect microstructural features. In particular, MD correlates negatively with cellularity1,2 and FA positively with cell anisotropy3,4. However, it is not clear to which degree this interpretation holds. In particular, the association between MD and cellularity5,6 as well as between FA and cell anisotropy7 has been challenged. In this work, we investigated to which degree these microstructure features could explain variability in MD and in-plane fractional anisotropy (FAIP) and compare that to what can be explained by a model based on neural networks and thus, in principle, explained by histology.Methods
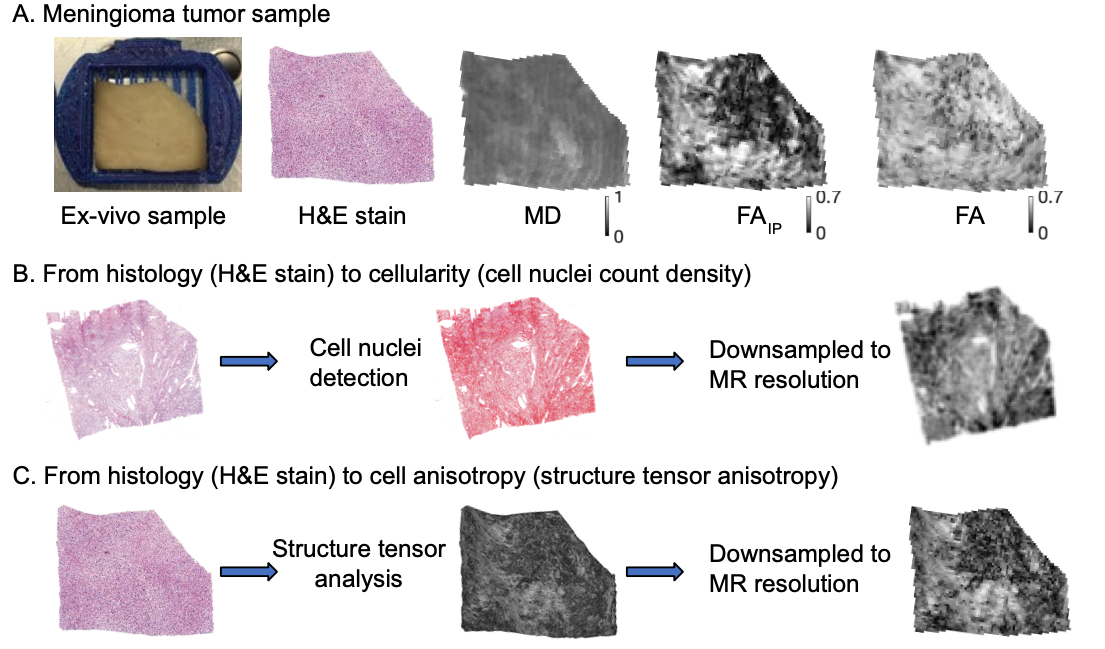
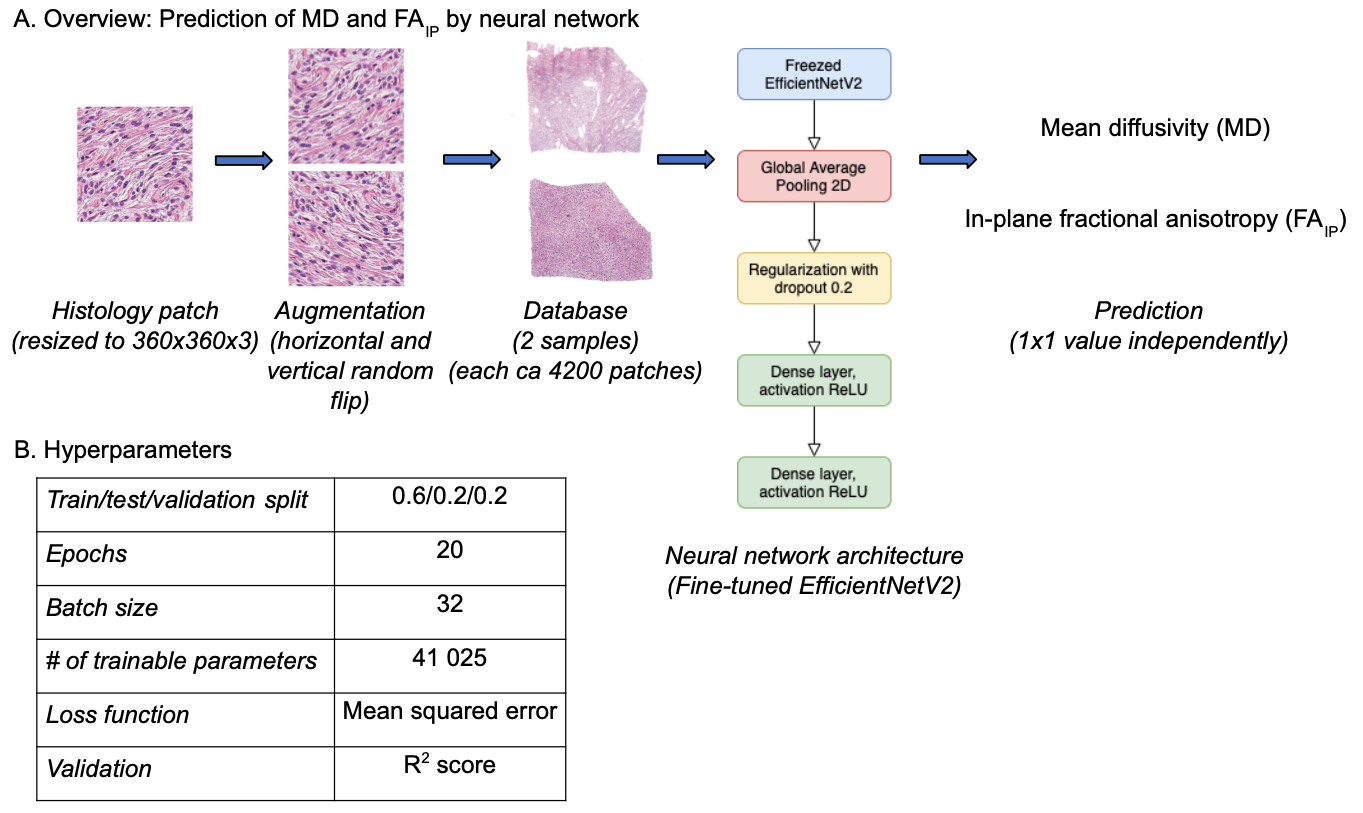
Two tumors were obtained after neurosurgical excision. The tissue was sliced into blocks of approximately 35x20x2 mm3 to fit a 3D printed mold and scanned at a Bruker 9.4T BioSpec Avance III scanner. Diffusion tensor imaging (DTI)8 was performed with TR=2.5s, TE=30ms, resolution=200×200×200μm3, and with b-values of 100, 1000 and 3000s/mm2, applied in 6 directions. DTI analysis was performed with linear least squares fitting, as implemented in the multidimensional dMRI toolbox9. Specimens were then sliced into 4–5 µm thick slices, stained with Hematoxylin & Eosin (H&E) and scanned with a light microscope at resolution 0.5×0.5 μm2. MR and histology images were coregistered by a non-linear landmark-based approach and MR maps smoothed using a Gaussian kernel with a width of 40 μm to reduce the impact of coregistration errors. Cell nuclei count and cell shape anisotropy were obtained from microscopy images using QuPath software10 and structure tensor analysis, respectively5,7.Using cellularity and cell anisotropy we predicted MD5 and FAIP7. We also predicted both features using a neural network trained to predict values in a single dMRI using a spatially corresponding 360x360 pixels patch of the histology images. After experimentation, we settled on using EfficientNetV2 network pretrained on the Imagenet dataset11 and fine-tuned for the patch-to-value regression task. The training was performed separately on each sample and individually for MD and FAIP. We used horizontal and vertical image flipping for data augmentation and a train-validation-test split of 60/20/20.
The results were evaluated using coefficient of determination (R2) on the test set and compared that to R2 obtained by cellularity and cell anisotropy prediction with a train-test split of 80/20. By comparing R2 we arrived at the minimal variation fraction that is unaccounted for by these micro-features but, in principle, explicable by histological images because it was predicted by a neural network model.
Results
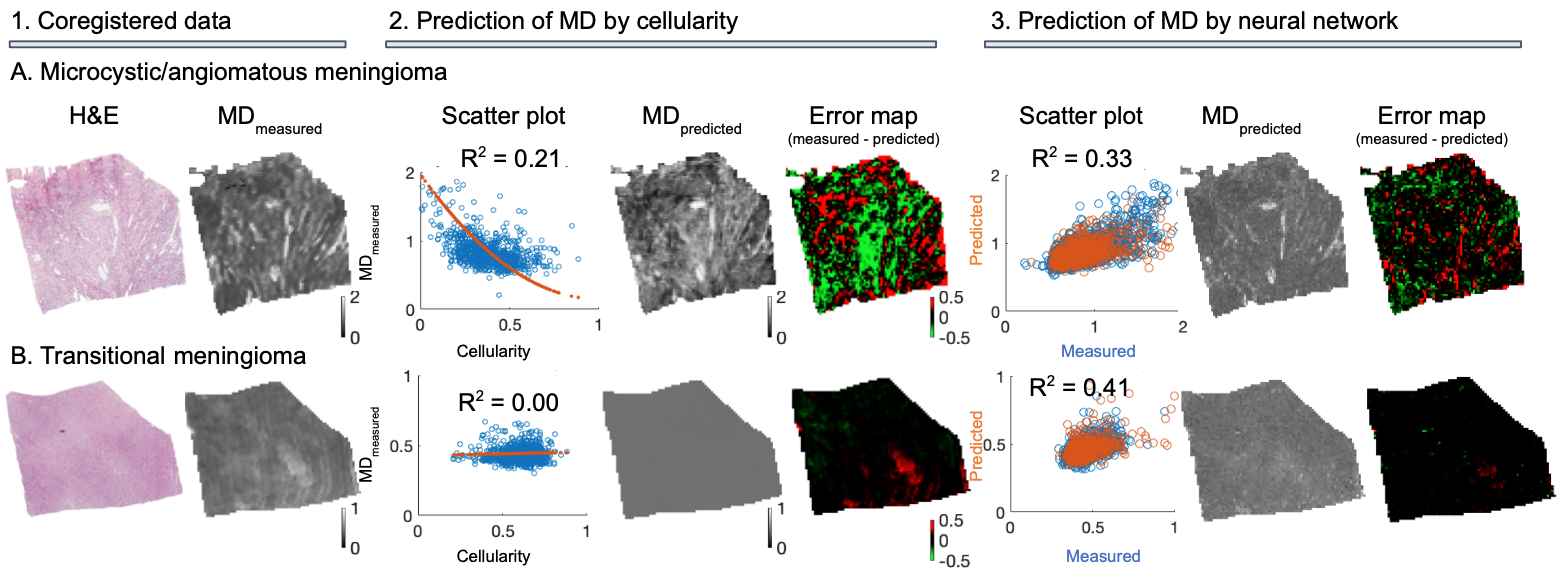
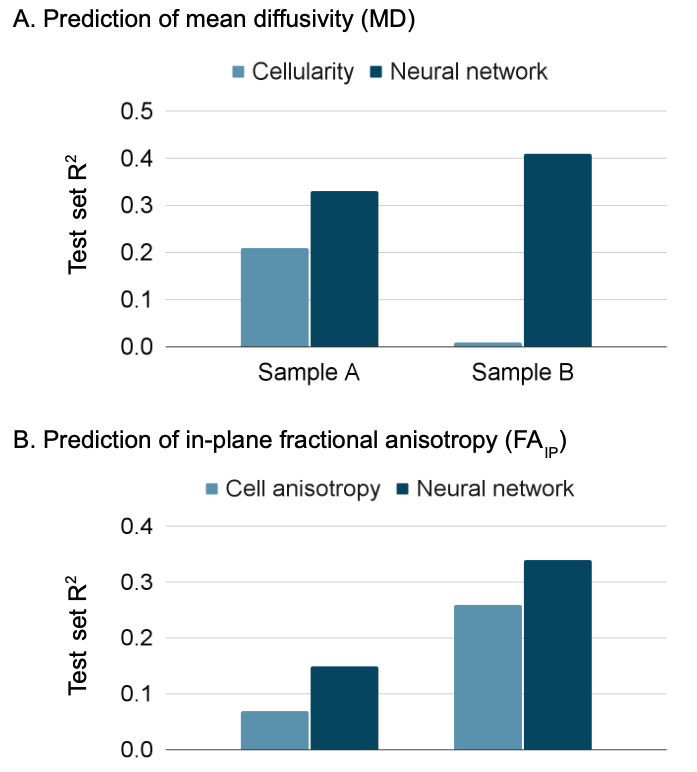
Figure 1 shows an overview of the imaging contrast and illustrates how cellularity and cell anisotropy were calculated5,7. Figure 2 illustrates the overall neural network setup.Figure 3 shows histology (H&E stained) and measured MD (part 1) of two samples - a microcystic/angiomatous (part A) and transitional meningioma (part B). We predicted MD from cellularity and found R2 = 0.21 on the test set (part 2) and by EfficientNetV2 neural network and found R2 = 0.33 also in the test set. Visually, we observed that the systematic bias (green area) disappeared when MD was predicted by the neural network. In the second sample, we found R2 = 0.00 on the prediction by cellularity but the neural network gave R2 = 0.41. Visually, the predicted MD map shows marked improvements where the systematic bias (red area) disappeared.
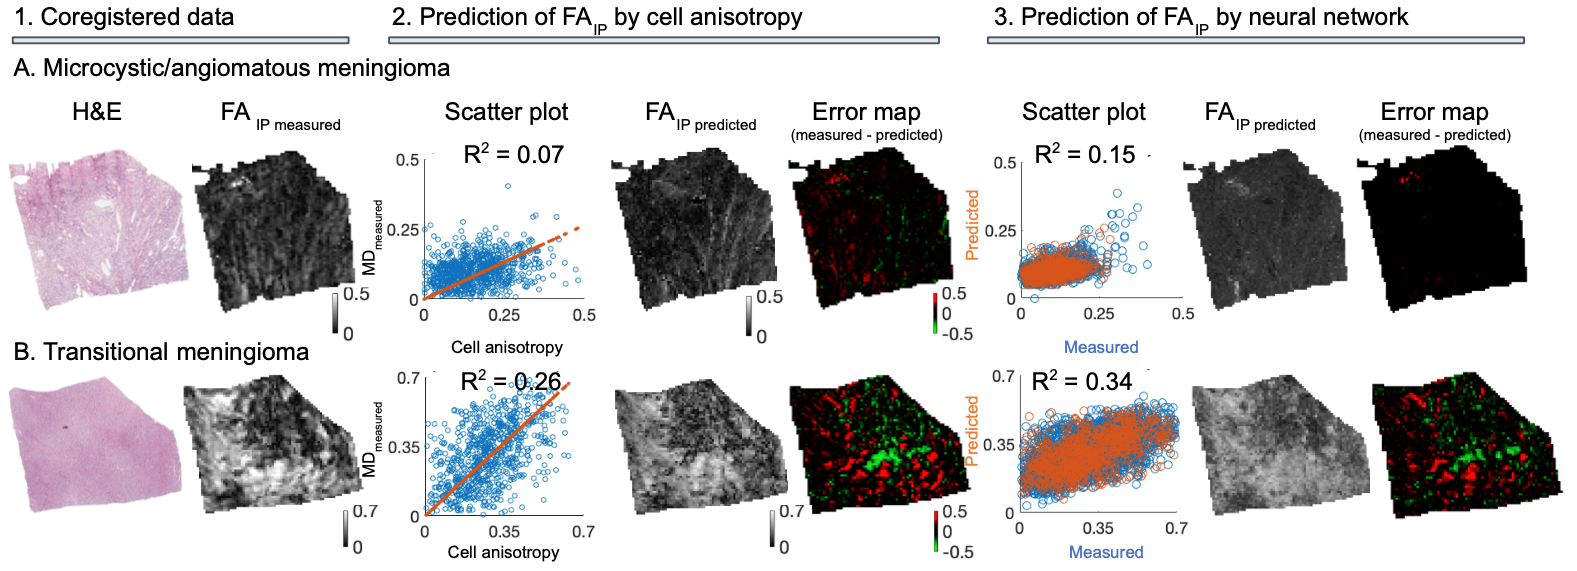
Figure 4 shows the same samples but with respect to FAIP prediction. In sample A, the prediction of FAIP by cell anisotropy yielded R2 = 0.07 and the neural network R2 = 0.15. In sample B, cell anisotropy yielded R2 = 0.26 and neural network R2 = 0.34. The R2 values are summarized in Figure 5.
Discussion
We compared MD and FAIP predicted from histology using either neural networks or image features with values measured using microimaging. The image features were those normally associated with these parameters: cellularity and cell anisotropy, respectively.In one sample the cellularity accounted for 64 % (R2 ratio of 0.21/0.33) of the variability explained by the neural network whereas it was 0 % in the second sample (0.0/0.41). For FAIP, the corresponding numbers were 47 % (0.07/0.15) and 76 % (0.26/0.34). The results indicate that cellularity and cell anisotropy alone are insufficient to explain the observed variability in MD and FA. Furthermore, features not present on histological images, such as exchange between the cells and extracellular space, may also contribute12. Similar results have been obtained in other tumors. For example, Egnell et al. found that stromal collagen content is positively associated with MD13.
We have found several limitations. First, MD and FAIP prediction errors may depend on inaccuracy MRI-to-histology coregistration. These, however, are accounted for by comparing variability to that reached by the neural network. Second, the current analysis was limited to just two samples. We will further corroborate this work with analysis on more samples.
Conclusion
Interpretability of MD and FA in terms of a single microstructure feature is not straightforward because in one meningioma sample the cellularity accounts for the majority (64 %) of explained variability of MD, whereas in the other one for 0 %. Similarly, cell anisotropy in one sample accounted for 47 % and in the other one for 76 % of the explained variability of FAIP.Acknowledgements
Michael Gottschalk, René In 'T Zandt and Lund University Bioimaging Center (LBIC), Lund University are gratefully acknowledged for providing experimental resources.References
1. Chen L, Liu M, Bao J, Xia Y, Zhang J, Zhang L, Huang X, Wang J. The correlation between apparent diffusion coefficient and tumor cellularity in patients: a meta-analysis. PloS one. 2013 Nov 11;8(11):e79008.
2. LaViolette PS, Mickevicius NJ, Cochran EJ, Rand SD, Connelly J, Bovi JA, Malkin MG, Mueller WM, Schmainda KM. Precise ex vivo histological validation of heightened cellularity and diffusion-restricted necrosis in regions of dark apparent diffusion coefficient in 7 cases of high-grade glioma. Neuro-oncology. 2014 Dec 1;16(12):1599-606.
3. Szczepankiewicz F, Lasič S, van Westen D, Sundgren PC, Englund E, Westin CF, Ståhlberg F, Lätt J, Topgaard D, Nilsson M. Quantification of microscopic diffusion anisotropy disentangles effects of orientation dispersion from microstructure: applications in healthy volunteers and in brain tumors. Neuroimage. 2015 Jan 1;104:241-52.
4. Szczepankiewicz F, van Westen D, Englund E, Westin CF, Ståhlberg F, Lätt J, Sundgren PC, Nilsson M. The link between diffusion MRI and tumor heterogeneity: Mapping cell eccentricity and density by diffusional variance decomposition (DIVIDE). Neuroimage. 2016 Nov 15;142:522-32.
5. Brabec J, Szczepankiewicz F, Šrámek J, Englund E, Bengzon J, Knutsson L, Westin C-F, Sundgren P-C, Nilsson M. Beyond cellularity: Which microstructural features determine the mesoscopic mean diffusivity in meningiomas. Proc Intl Soc Mag Reson Med 2021; p. 4037.
6. Yoshikawa MI, Ohsumi S, Sugata S, Kataoka M, Takashima S, Mochizuki T, Ikura H, Imai Y. Relation between cancer cellularity and apparent diffusion coefficient values using diffusion-weighted magnetic resonance imaging in breast cancer. Radiation medicine. 2008 May;26(4):222-6.
7. Brabec, J, Szczepankiewicz F, Englund E, Bengzon J, Knutsson L, Westin C-F, Sundgren P-C, Nilsson M. Imaging meningioma tumor microstructure – a comparison between quantitative histology and high-resolution diffusion tensor imaging. Proc Intl Soc Mag Reson Med 2020; p. 4453.
8. Basser PJ, Mattiello J, LeBihan D. MR diffusion tensor spectroscopy and imaging. Biophysical journal. 1994 Jan 1;66(1):259-67.
9. Nilsson M, Szczepankiewicz F, Lampinen B, Ahlgren A, de Almeida Martins JP, Lasic S, Westin CF, Topgaard D. An open-source framework for analysis of multidimensional diffusion MRI data implemented in MATLAB. InProc Intl Soc Mag Reson Med 2018 Jun (Vol. 26, p. 5355).
10. Bankhead P, Loughrey MB, Fernández JA, Dombrowski Y, McArt DG, Dunne PD, McQuaid S, Gray RT, Murray LJ, Coleman HG, James JA. QuPath: Open source software for digital pathology image analysis. Scientific reports. 2017 Dec 4;7(1):1-7.
11. Tan M, Le QV. Efficientnetv2: Smaller models and faster training. arXiv preprint arXiv:2104.00298. 2021 Apr 1.
12. Nilsson M, Lätt J, van Westen D, Brockstedt S, Lasič S, Ståhlberg F, Topgaard D. Noninvasive mapping of water diffusional exchange in the human brain using filter‐exchange imaging. Magnetic resonance in medicine. 2013 Jun;69(6):1572-80.
13. Egnell L, Vidić I, Jerome NP, Bofin AM, Bathen TF, Goa PE. Stromal Collagen Content in Breast Tumors Correlates With In Vivo Diffusion‐Weighted Imaging: A Comparison of Multi b‐Value DWI With Histologic Specimen From Benign and Malignant Breast Lesions. Journal of Magnetic Resonance Imaging. 2020 Jun;51(6):1868-78.
Figures