0847
Evaluation of Neural Network Reconstruction of Undersampled Data using a Human Observer Model of Signal Detection1Mathematics Department, Manhattan College, Riverdale, NY, United States, 2Roy J. Carver Department of Biomedical Engineering, University of Iowa, Iowa City, IA, United States
Synopsis
We evaluated images from undersampled data using a U-Net with common metrics (SSIM and NRMSE) and with a model for human observer detection, the sparse difference-of-Gaussians (S-DOG). We also studied how the results vary when changing the loss function and training set size. We saw that the S-DOG model would choose an undersampling of 2X while SSIM and NRMSE would choose 3X. In previous work, human observers also chose a 2X acceleration. The S-DOG model led to the same conclusion as the human observers. This result was consistent with changes in training set size and loss function.
Purpose
Determining the acceptable rate of undersampling depends on the task for which the images will be used. Artifacts from neural networks are difficult to characterize and this makes it particularly applicable to use a task-based1 approach to image quality for neural network reconstructions. Evaluations of reconstructions generally use measures of distance from a fully sampled image e.g. normalized root mean squared error (NRMSE) or structural similarity (SSIM)2. In this work, we evaluate undersampled reconstructions with a U-Net convolutional neural network with a SSIM loss and MSE loss using the detection of a small signal as the performance metric. We compared the choice of undersampling that would best balance image quality and acquisition speed resulting from NRMSE and SSIM metrics with the choice that would arise from detecting a small signal in the reconstructed images by model of human observer performance, the S-DOG3,4.Methods
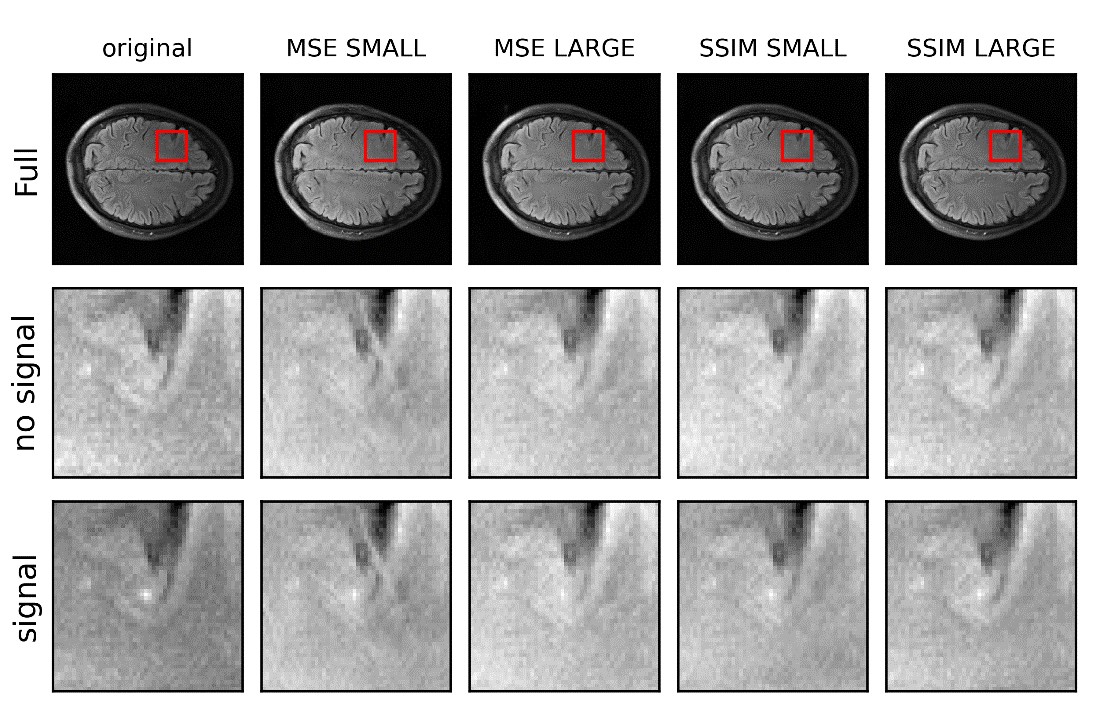
The k-space data used in this study came from fully sampled fluid-attenuated inversion recovery (FLAIR) acquisitions from the fastMRI open source dataset5. The fully sampled 320 x 320 background images were generated in the BART6 environment from the multi-coil data by R=1 SENSE combination with coil maps estimated via the sum of squares approach using the central 16 k-space lines. In order to generate the fully sampled images with the signal, the multi-coil k-space data of the signal (a small disk with radius = 0.25 pixels blurred by a Gaussian kernel, σ=1 pixel) was added to the background k-space data before reconstruction. The undersampling for the different accelerations were done from the single coil image. We kept 16 k-space lines around the zero frequency (5% of the data) and everywhere else collected every k line with k = 2,3,4 and 5. A U-Net5 with 64 channels in the first layer, and a 0.1 dropout was used but with a ReLU and sigmoid activation functions at the end.For the SSIM loss function we used 1 minus SSIM. We ran 5-fold cross validation studies each trained with 500 or 4000 background images to evaluate the neural network reconstructions based on SSIM and NRMSE. The standard deviation for these metrics was computed from the five folds. We also repeated this study with a MSE loss function.
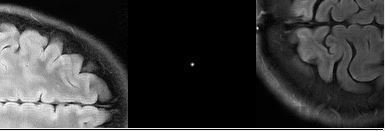
For the observer studies, we used data that was not included in either the small (500) or large (4000) training set. The two-alternative forced choice (2-AFC) studies (Figure 1) force the observer to choose in which of two images the signal is located. Each human observer did 200 such trials for each condition. All the observer studies were done using a Barco MDRC 2321 monitor in a dark room.
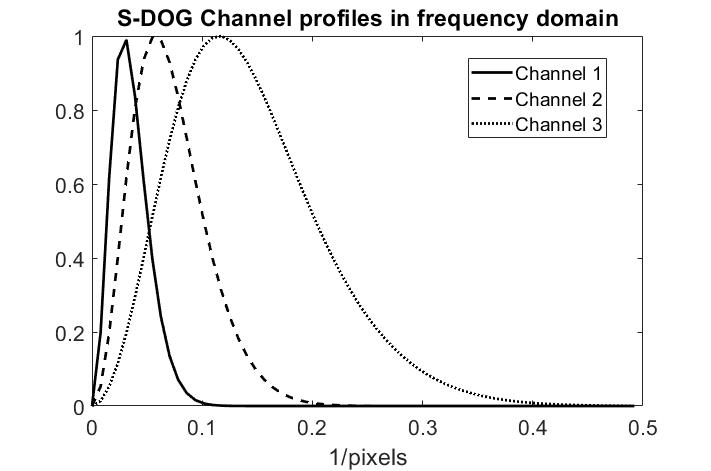
In previous work7 using the SSIM loss function and the small training set, we found that the human observer 2-AFC performance led to choosing an acceleration of 2X to avoid a large drop in performance while NRMSE and SSIM would choose 3X. Here we use a model observer which reduces the number of observer trials needed to reach a similar conclusion. The sparse difference-of-Gaussians (S-DOG) model uses channels in the frequency domain (Figure 2) which are inspired by channels in the human visual system3.
Results & Discussion
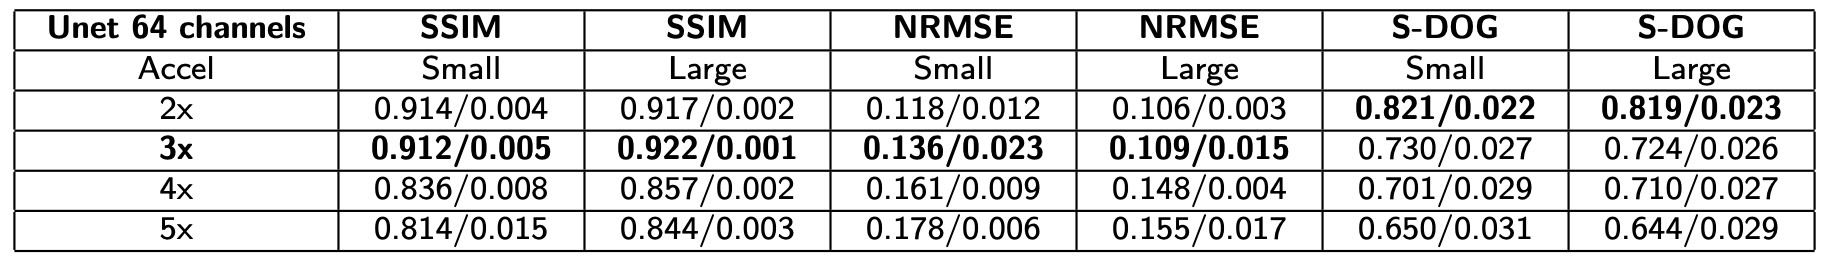
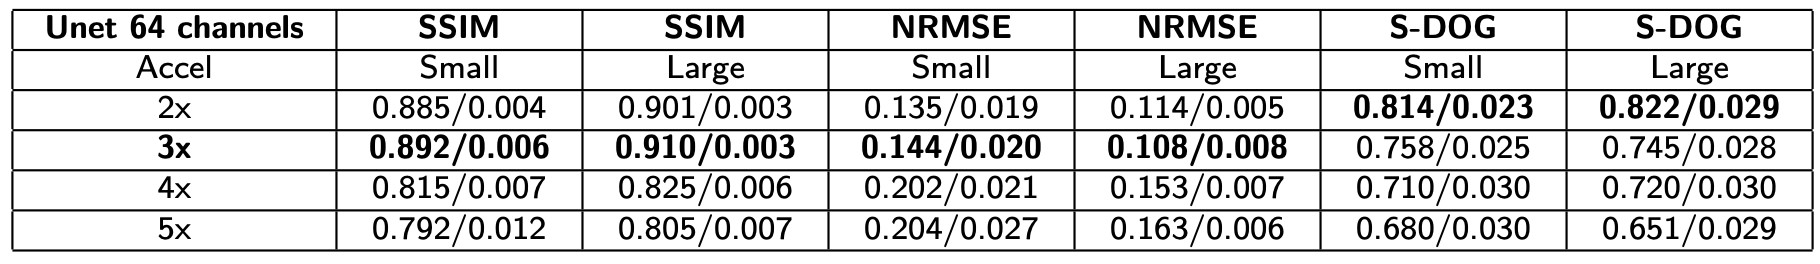
Figure 3 and Figure 4 shows that the standard metrics (SSIM and NRMSE) are consistent in the choice of undersampling of 3X across training set size and loss function (SSIM and MSE). As expected these metrics slightly improved with training set size. Subjectively (Figure 5) and through the model observer results, the detection of signals did not seem to change much with training set and loss function.In this work, the S-DOG percent correct had the first big drop between 2X and 3X undersampling just as the human observers7. This result is encouraging in pursuing the S-DOG as a potential model for predicting human performance in terms of the decision that would be made for how much to undersample.
In this study, four observers carried out 200 2-AFC trials for the 3x acceleration for each of the 4 combinations of SSIM and MSE Loss and the small and large training set. The average human percent correct remained fairly constant for all conditions (0.79,0.80,0.83,0.79) with the slightly higher value for the small data set with the MSE loss. A limitation of the S-DOG is that it is linear. If humans are doing non-linear processing in the detection task, it would not be able to model it. This may be one of the reasons why the S-DOG did not match the human results quantitatively since the performance of the S-DOG without internal noise (it’s highest performance) was below the average human performance. Exploration of other model observers8 is part of our future work.
Conclusion
For the U-Net that we studied, the S-DOG model observer would choose the same undersampling as the human observers. We also found that increasing the training set size or varying the loss function between MSE and SSIM did not affect the choice of undersampling when using the SSIM and NRMSE metrics which would choose a higher undersampling than the human observers or the S-DOG model.Acknowledgements
We acknowledge support from NIH R15-EB029172, the Manhattan College Faculty Development Grant and the Kakos Center for Scientific Computing. The authors also thank Dr. Krishna S. Nayak, and Dr. Craig K. Abbey for their helpful insights.References
1. HH Barrett and KJ Myers 2004 Foundations of Image Science (Hoboken, NJ: Wiley)
2. Z Wang, AC Bovik, HR Sheikh, et al, "Image quality assessment: from error visibility to structural similarity", IEEE TMI, 13: 600-612 (2004)
3. CK Abbey, HH Barrett, "Human-and model-observer performance in ramp-spectrum noise: effects of regularization and object variability", JOSA A, 18: 1237-1242 (1994)
4. AG O’Neill, EL Valdez, SG Lingala, AR Pineda, “Modeling human observer detection in undersampled magnetic resonance imaging (MRI)”, Proc. of SPIE Medical Imaging 2021, 115990. 115990H.
5. J Zbontar, F Knoll, A Sriram, et al, "fastMRI: An Open Dataset and Benchmarks for Accelerated MRI", arXiv: 1811.08839v1 (2018)
6. M Uecker, F Ong, JI Tamir, et al, "Berkeley Advanced Reconstruction Toolbox", Proc. Intl. Soc. Mag. Reson. Med, 23, 2486 (2015)
7. JD Herman, RE Roca, AG O’Neill, SJ Lingala, AR Pineda, “Task-Based Assessment for Neural Networks: Evaluating Undersampled MRI Reconstructions based on Signal Detection”, ISMRM 2021 Abstract 2404.
8. AR Pineda, H Miedema, SG Lingala, KS Nayak, “Optimizing constrained reconstruction in magnetic resonance imaging for signal detection", Physics in Medicine and Biology, 66 (14), 2021, 145014.
Figures