0840
MRSI-detected pattern in glioblastoma patients one month after concomitant chemoradiotherapy1Centro de Investigación Biomédica en Red, Barcelona, Spain, 2Universitat Autònoma de Barcelona, Barcelona, Spain, 3Institut d'Investigació Biomèdica de Bellvitge (Idibell), Hospital Universitari de Bellvitge, Barcelona, Spain, 4IDEAI-UPC research center, UPC BarcelonaTech, Barcelona, Spain
Synopsis
A blind source separation method (cNMF) was used to extract characteristic metabolic patterns from PRESS MRSI 3T acquired from areas of contrast enhancement in a retrospective set of 31 glioblastoma patients, one month after the end of concomitant chemoradiotherapy with temozolomide. The aim was to evaluate whether these patterns were predictive of true progression or pseudoprogression. They were used as input for supervised classifiers, achieving a maximum of 81% balanced accuracy. A moderate association between extracted patterns and outcome was detected by Cramer’s V. Spatial source distribution with nosologic maps points to MRSI-detected metabolic heterogeneity as cause for classifiers’ performance.
INTRODUCTION
The standard treatment for Glioblastoma (GB) patients includes surgical removal of the tumour followed by concomitant treatment with chemoradiotherapy with temozolomide (TMZ)1. The first treatment response evaluation is performed one month after the end of the concomitant treatment (P1M). Patient follow-up is challenging because an abnormal contrast-enhancing region (CER) at this time point can be due to real tumor growth (true progression, TP) or to pseudoprogression (PP), a phenotype caused by treatment-associated changes. Progression status can only be confidently determined in the next exploration, usually taking place about two months after P1M (P3M). Therefore, the purpose of this study was to evaluate whether the MRS metabolic patterns of the CER regions at the P1M exam are predictive of the progression status as determined by the next follow-up (P3M).METHODS
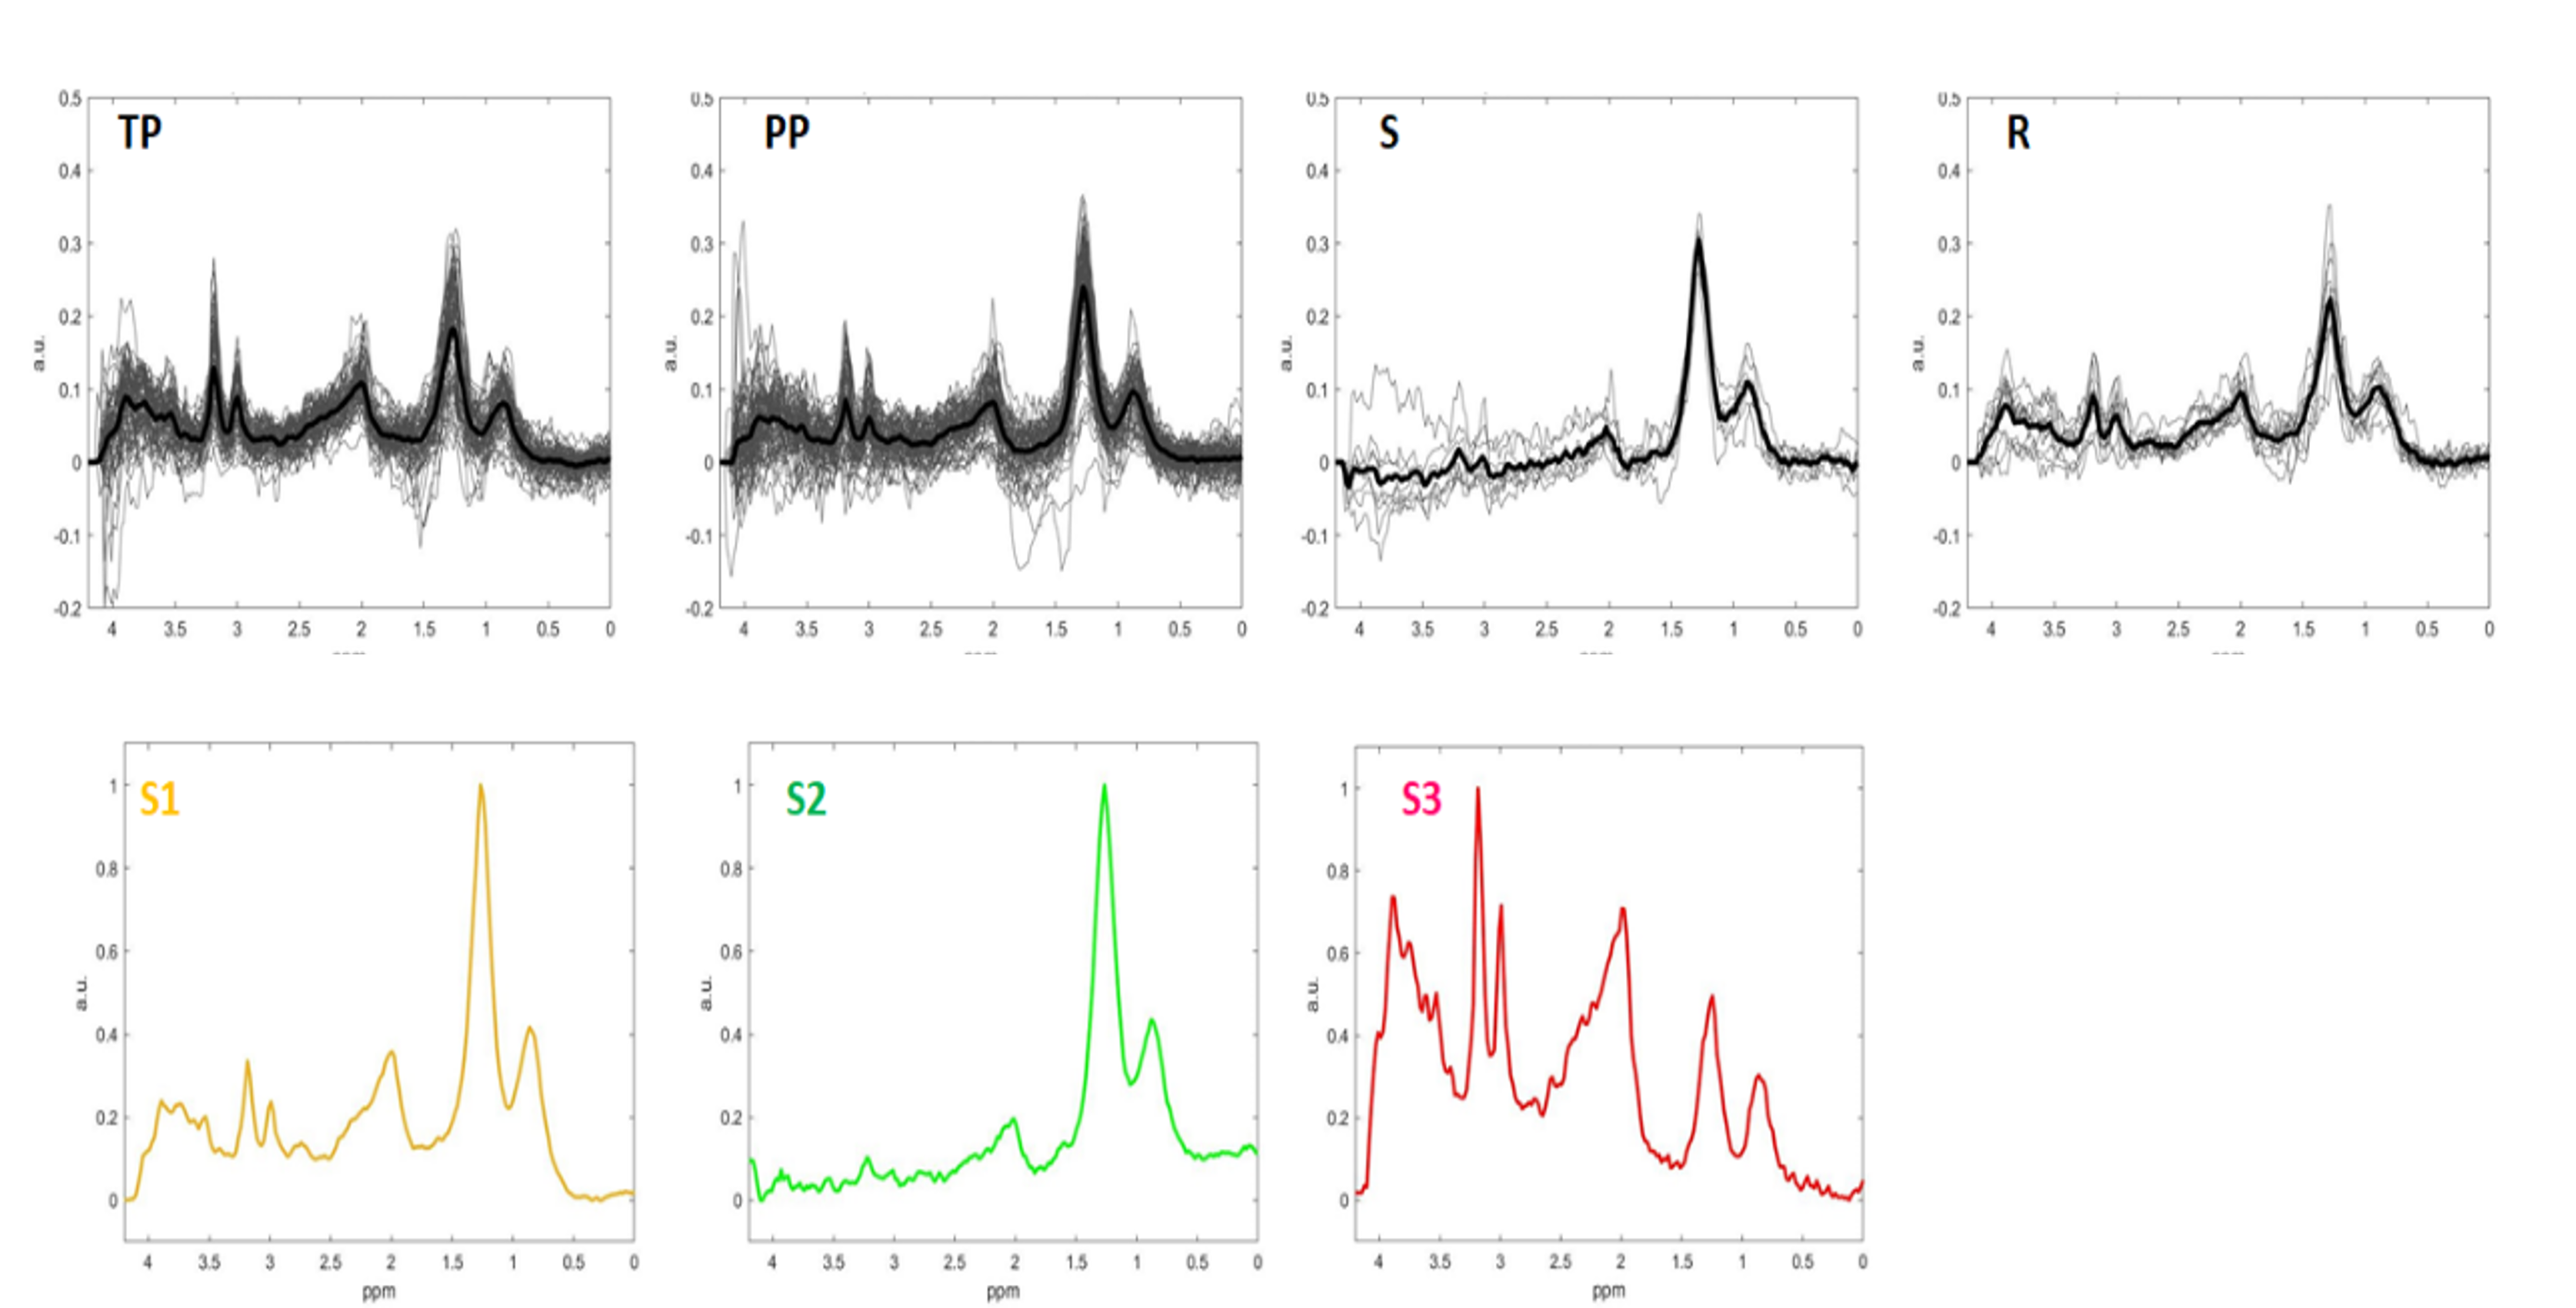
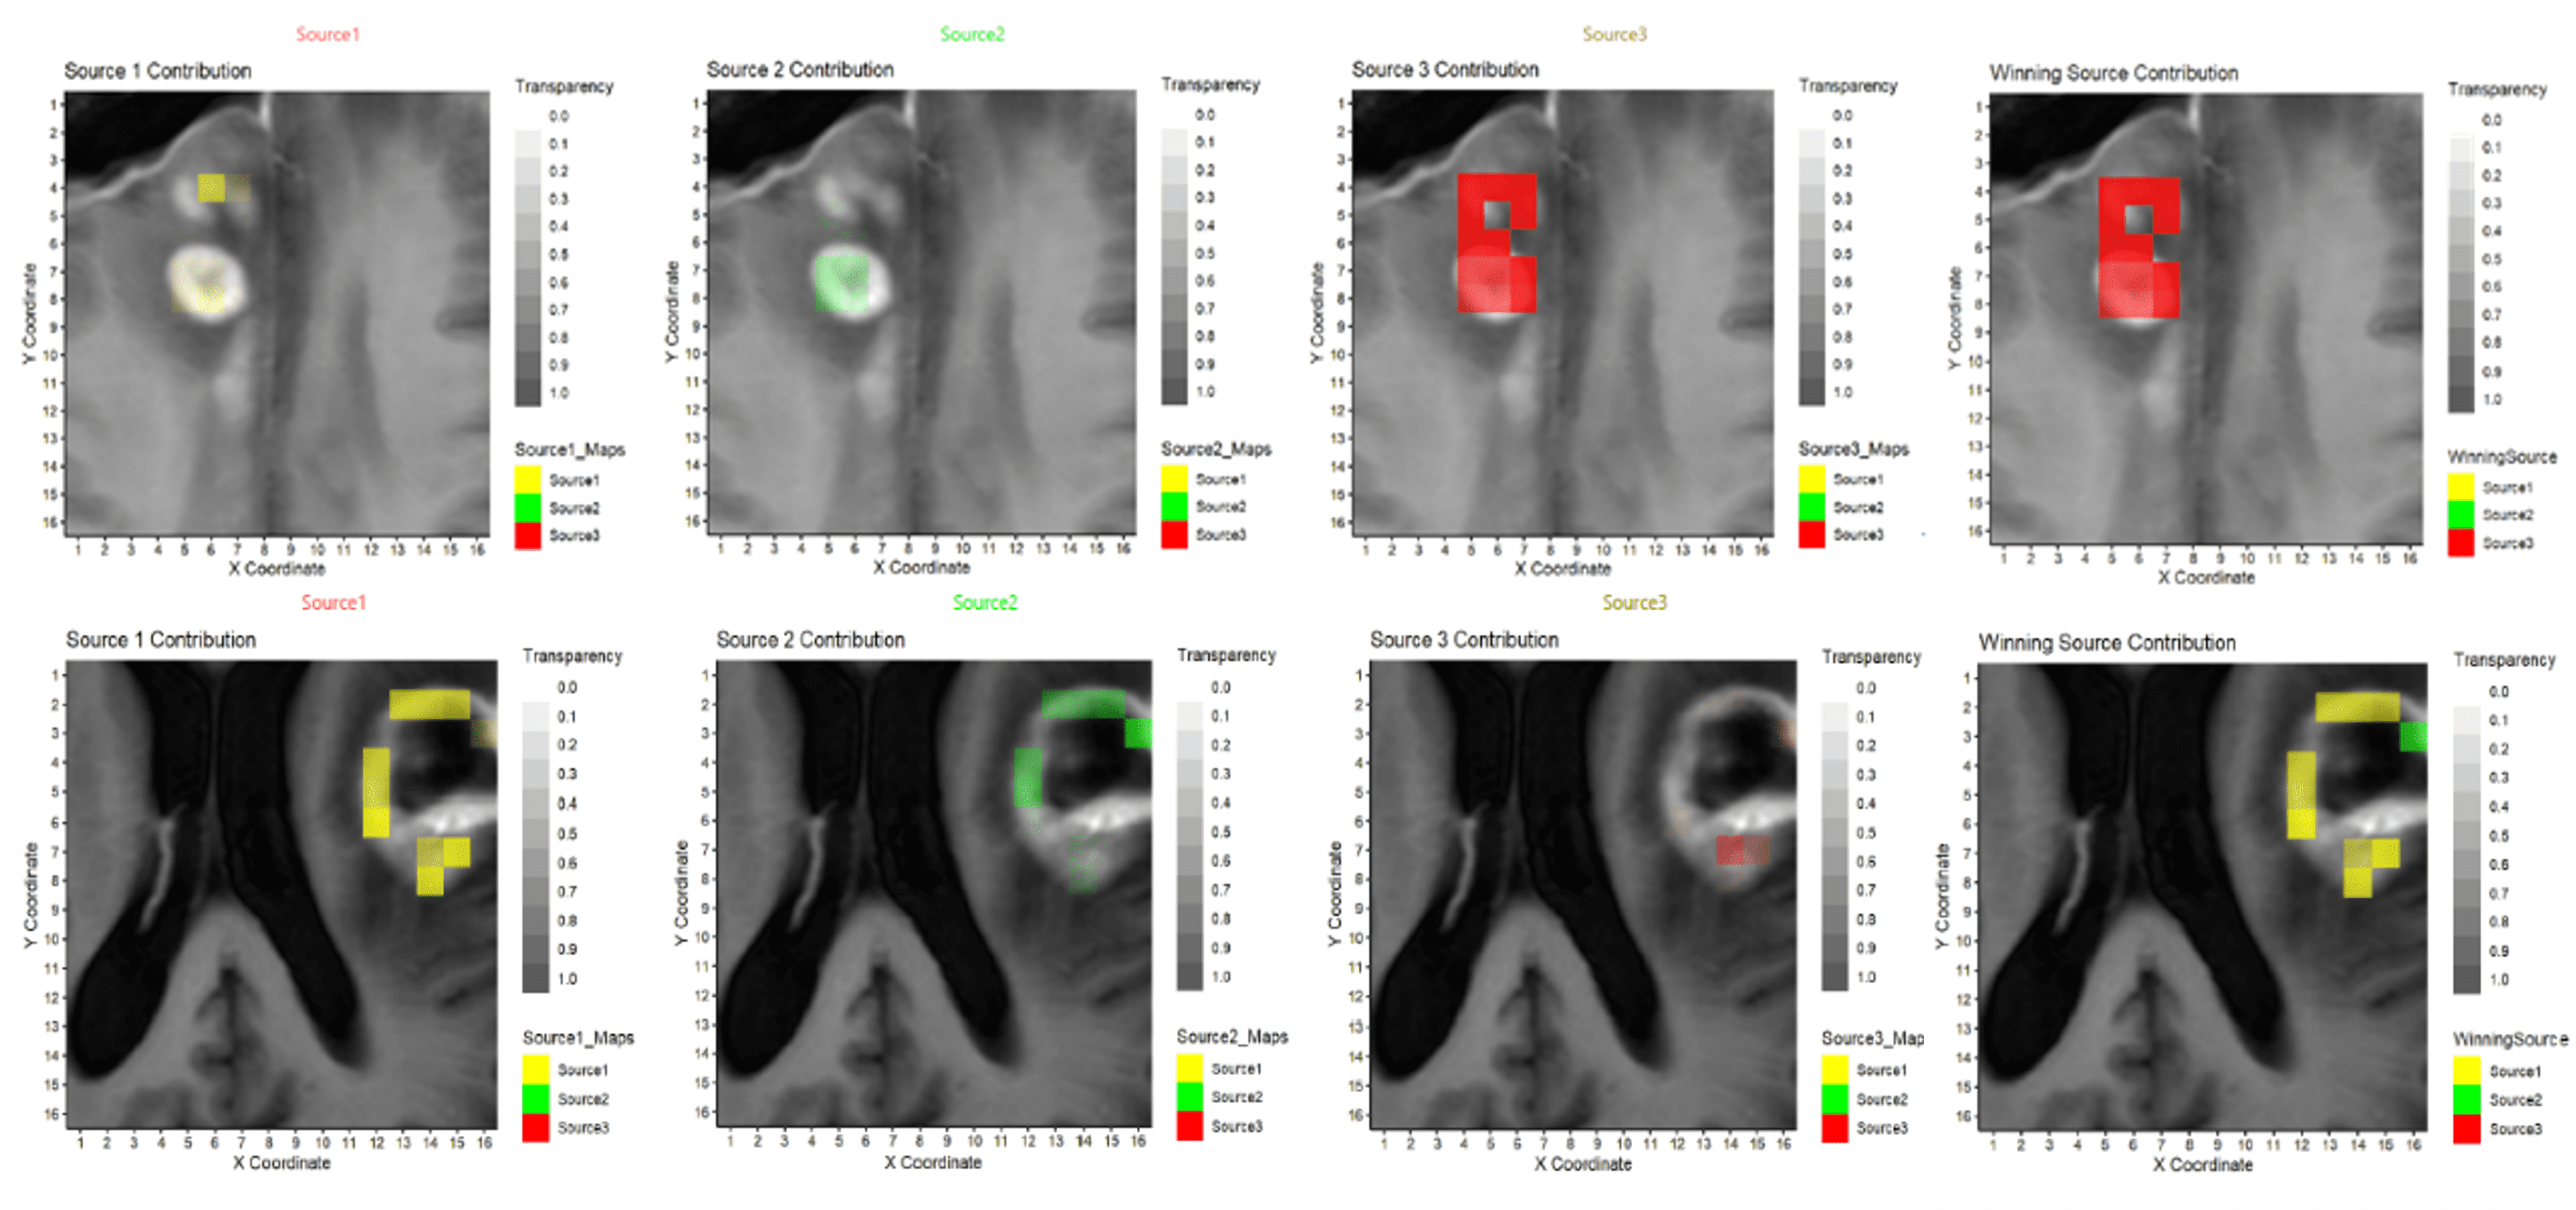
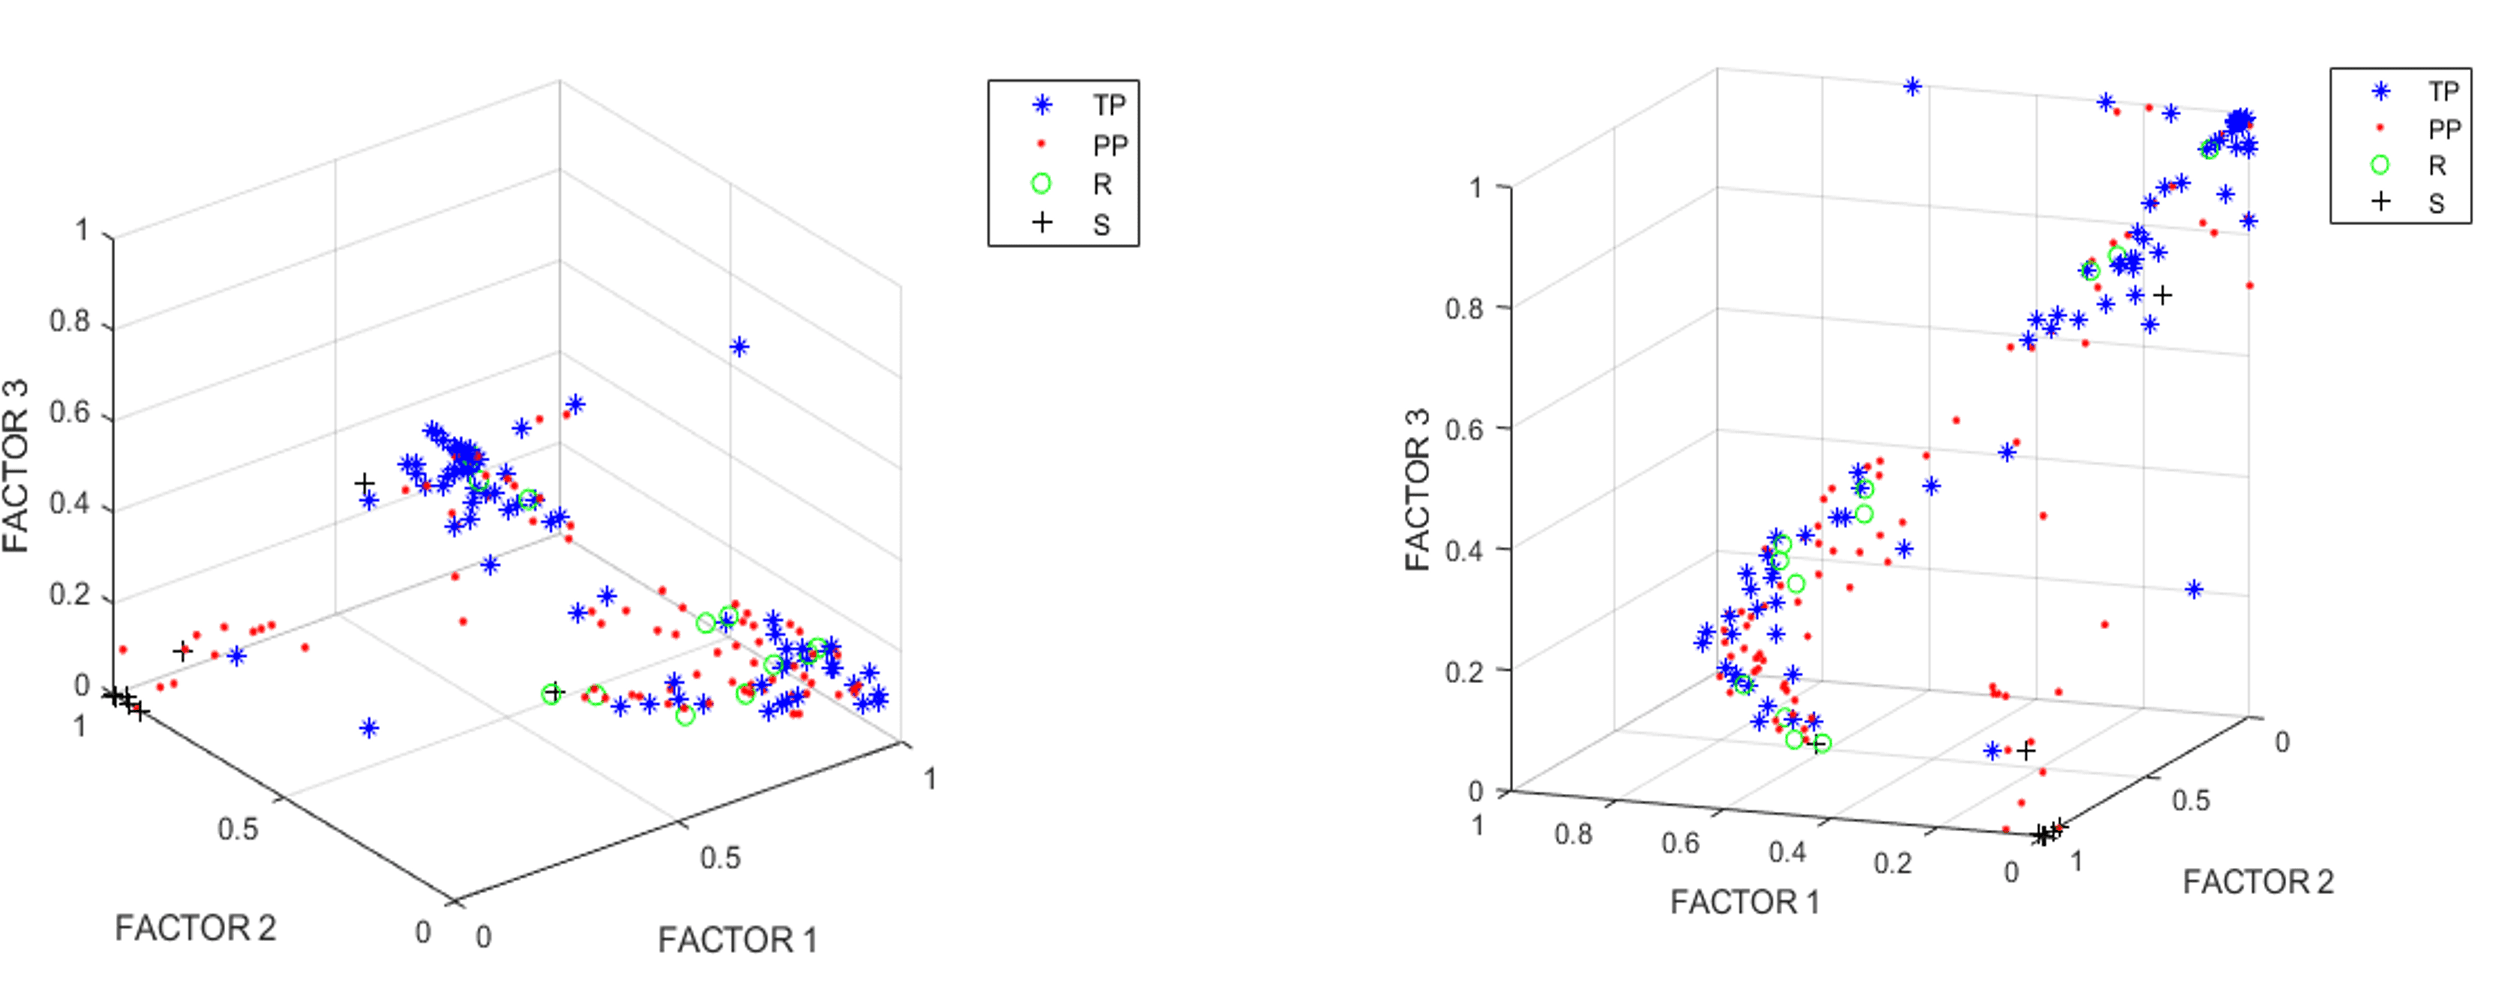
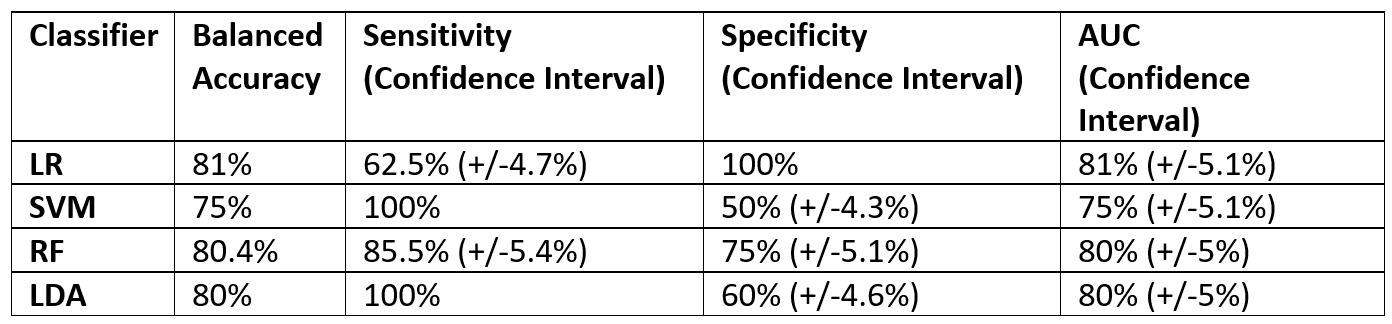
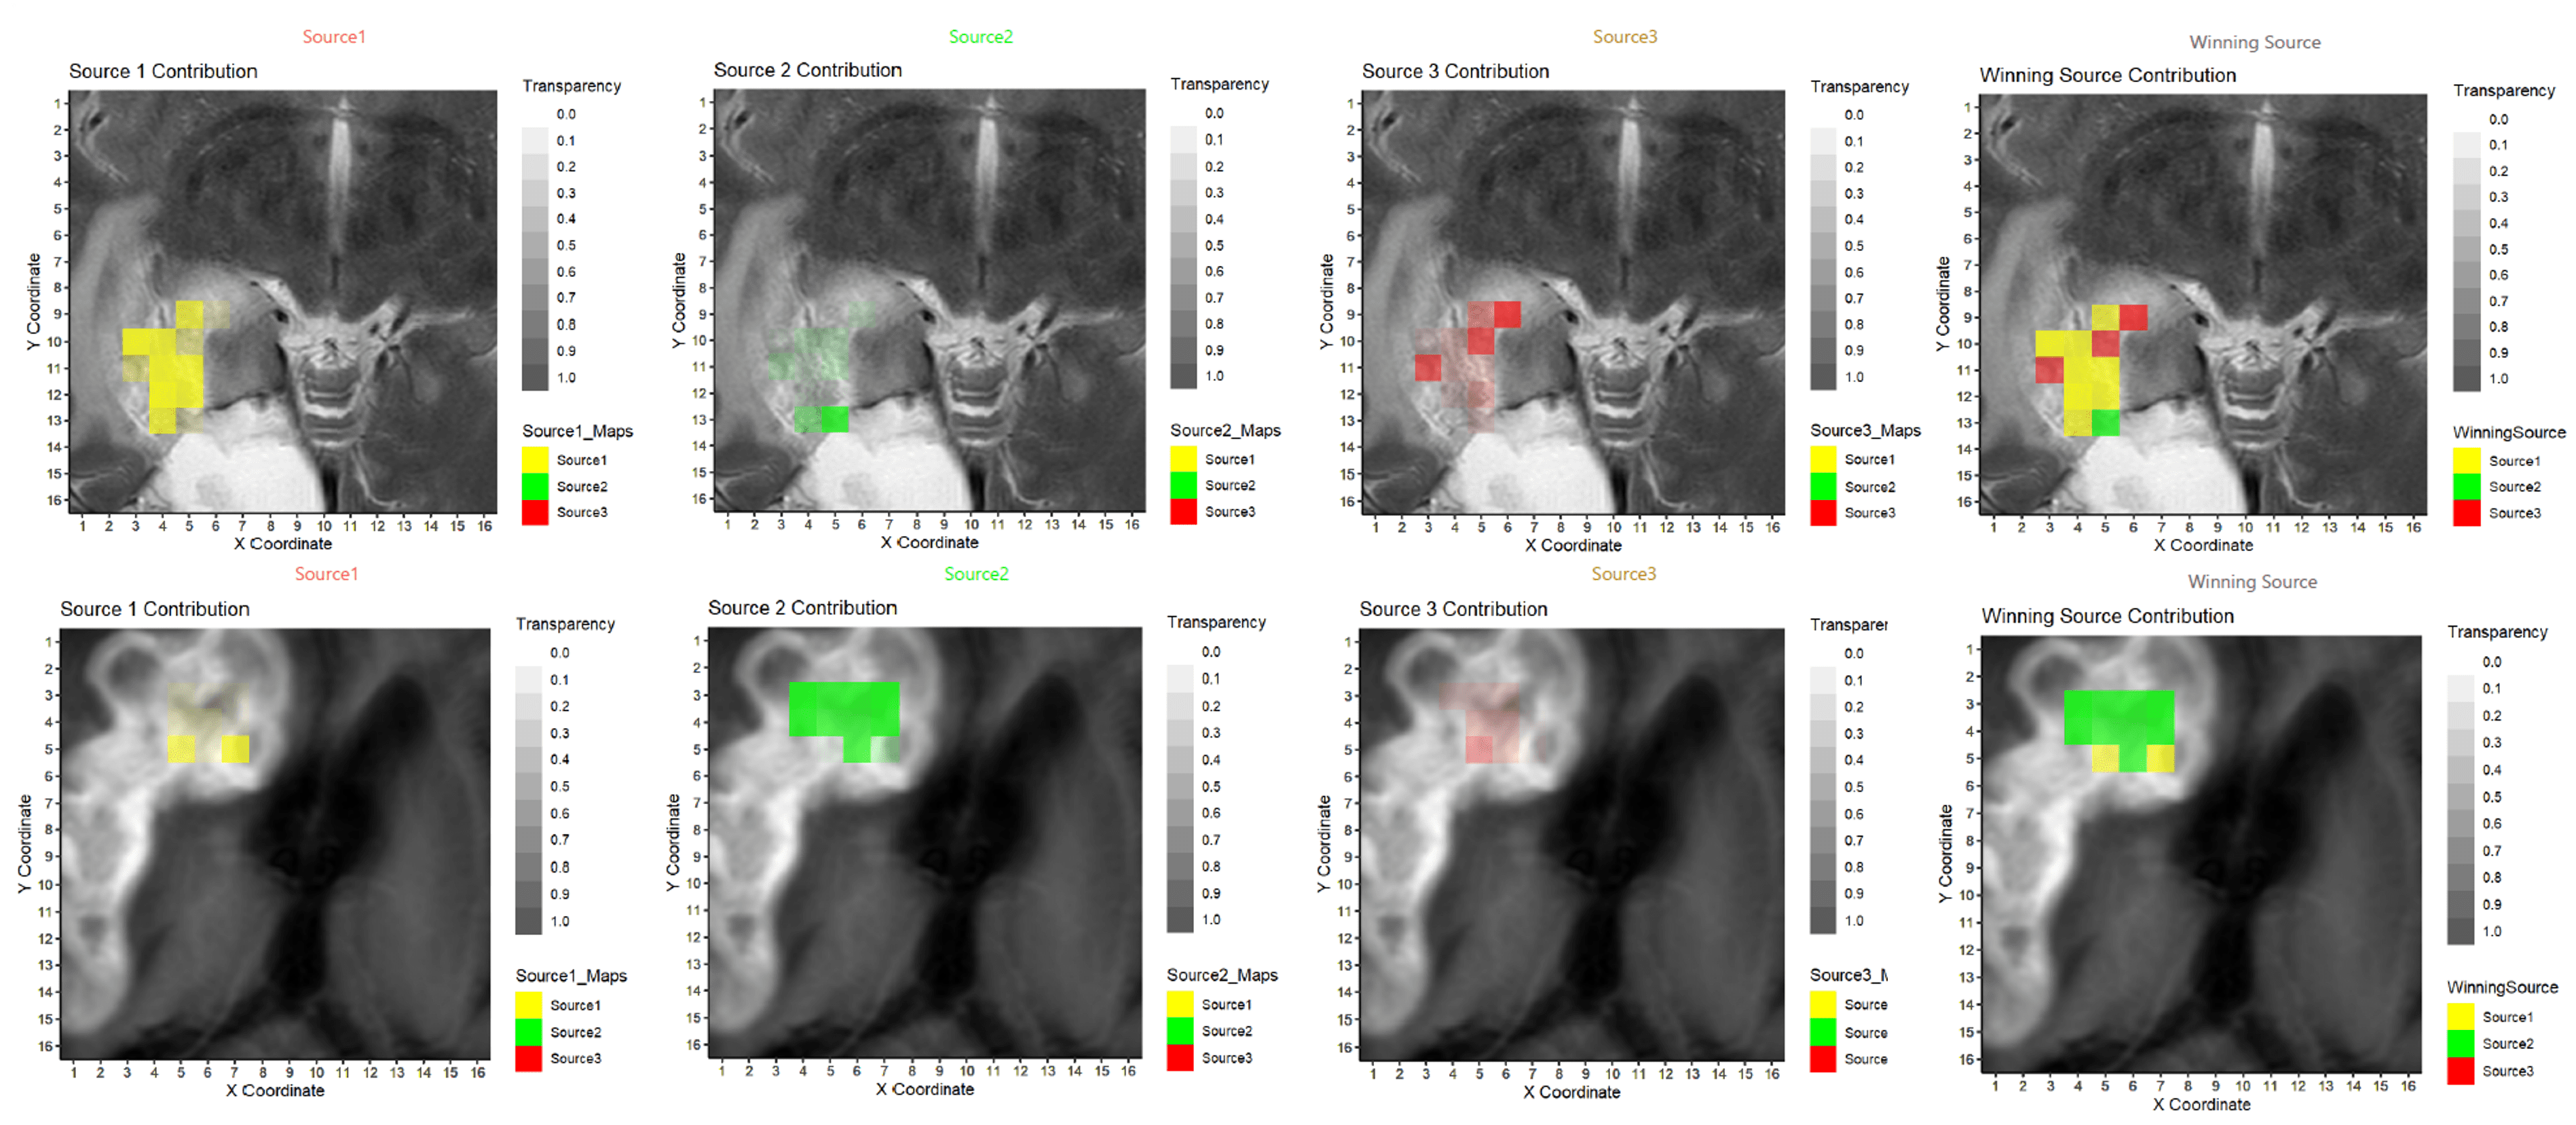
We retrospectively analysed 53 consecutive patients explored at one public hospital July 2016-January 2019. MRSI data were acquired with a 3T Philips Ingenia with the following parameters: PRESS, FOV 8x8x1.5 mm, VOI 8x8x1.5 mm, 16x16x1 resolution, TE=30ms, TR=2000ms. One radiologist labelled the voxels over CER using the post-contrast T1 weighted image at P1M. Progression status was clinically determined according to RANO criteria by using the next follow-up2. MRSI processing was performed with JMRUI2XML3 with INTERPRET parameters4,5. Quality control was expert-based. Inclusion criteria for patients were: 1) Histopathologically-verified GB, having undergone resection/treatment with concomitant chemoradiotherapy with TMZ, followed by adjuvant TMZ according to Stupp protocol1. 2) Presence of one or more CER in the P1M exploration. 3) Availability of follow-up with MRI at least 2 months after the P1M and clinical diagnosis of True Progression (TP), Pseudoprogression (PP), Stable disease (S) or Response (R) according to RANO working group criteria2 4) MRSI acquired in the P1M. Pooled spectra of sufficient spectral quality from all patients, passing all inclusion criteria, were used to extract characteristic spectral patterns by convex-Non-Negative Matrix Factorization (cNMF)6. This method factorizes the data matrix (X) into two non-negative matrices: one including the so-called sources (F) with dimensions d×k where k is the number of sources, and d is the observed data dimension, and another (H) with the source-mixing coefficients, with dimensions k×n , where n is the number of spectra, such that the product of F and H gives a good approximation to the original data matrix as X ≈ FH. The values of H were used to calculate a “winning source” (predominant source contribution for each spectrum). cNMF was repeated 100 times to ensure sources' robustness. This information was then used to create colour (nosologic) maps as overlays onto the reference MRI displaying the CER regions of each patient, to visually display the contribution of each characteristic pattern or source to each patient’s CER, with an in-house Matlab script based on Gannet7, between 0 (transparent) and 1. Weights were also used as input features for supervised Machine Learning-based classification with the scikit-learn8 library, with grid search for finding the optimal model parameters. Classifiers were built for “TP” vs. “PP+S+R” with linear regression (LR), support vector machines (SVM), random forests (RF) and linear discriminant analysis (LDA). Performance was evaluated with balanced accuracy, area under curve (AUC), sensitivity and specificity with 95% confidence intervals. Association of sources with the progression status was calculated using Cramer’s V9.RESULTS
After filtering data based on inclusion criteria, data from 31 patients were included: 11 TP, 15 PP, 3 Stable (S) and 2 Response (R), in total 172 individual spectra with 72, 80, 12 and 8 spectra per class, respectively. Figure 1 displays the input of cNMF and extracted sources; Figure 2 shows an example of colour (nosologic) maps for two cases, while Figure 3 shows factor weights plot for each class and Figure 4 summarises classification results. Cramer’s V value was 0.38, indicating a moderate association of the sources with the outcome, in line with the classification results. Figure 5 shows examples of heterogeneous cases.DISCUSSION
We evaluated the utility of MRSI in distinguishing TP vs. PP, achieving moderate success in terms of classification, with an 80-81% balanced accuracy and 75-81% AUC depending on the classifier, using patterns extracted from the data as input features. Cramer’s V also pointed to a moderate association of these patterns with the progression status. Evaluation of the colour maps showed that there were two groups of cases, namely those in which there was a majority contribution from one of the sources extracted, and those in which there was a heterogeneous pattern contribution. Metabolic heterogeneity in glioma is an acknowledged phenomenon as seen with MRSI11. In our study, we detect this heterogeneity in a very homogeneous patient population with respect to time after treatment, and with respect to the problem of differentiating TP from PP. In a previous study12 with 27 patients, eight of whom were with a P1M follow-up, authors used 3D echo-planar spectroscopic imaging and found very promising differences in the Choline / n-Acetyl Aspartate (Cho/NAA) ratio from the abnormal contrast-enhancing growths, with an AUC of 0.83, similar to our present results.CONCLUSION
At the P1M time point after the Stupp protocol, we identified MRS patterns that are moderately associated with progression, however, the CER regions are also metabolically heterogeneous.Acknowledgements
Johannes Slotboom is acknowledged for help with colour map validation with Spectrim. INSPIRE-MED, H2020-EU-1.3.1-813120 EXCELLENT SCIENCE - Marie Skłodowska-Curie Actions, Fostering new skills by means of excellent initial training of researchers.References
1. Stupp R, Mason WP, van den Bent MJ, et al. Radiotherapy plus concomitant and adjuvant temozolomide for glioblastoma. N Engl J Med. 2005;352(10):987-996. doi:10.1056/NEJMoa043330
2. Wen PY, Chang SM, Van den Bent MJ, Vogelbaum MA, Macdonald DR, Lee EQ. Response Assessment in Neuro-Oncology Clinical Trials. J Clin Oncol. 2017;35(21):2439-2449. doi:10.1200/JCO.2017.72.7511
3. Mocioiu V, Ortega-Martorell S, Olier I, et al. From raw data to data-analysis for magnetic resonance spectroscopy--the missing link: jMRUI2XML. BMC Bioinformatics. 2015;16:378. Published 2015 Nov 9. doi:10.1186/s12859-015-0796-5
4. Pérez-Ruiz A, Julià-Sapé M, Mercadal G, Olier I, Majós C, Arús C. The INTERPRET Decision-Support System version 3.0 for evaluation of Magnetic Resonance Spectroscopy data from human brain tumours and other abnormal brain masses. BMC Bioinformatics. 2010;11:581. Published 2010 Nov 29. doi:10.1186/1471-2105-11-581.
5. Tate AR, Underwood J, Acosta DM, et al. Development of a decision support system for diagnosis and grading of brain tumours using in vivo magnetic resonance single voxel spectra. NMR Biomed. 2006;19(4):411-434. doi:10.1002/nbm.1016
6. Ding CHQ, Li T, Jordan MI, Convex and Semi-Nonnegative Matrix Factorizations, IEEE Transactions on Pattern Analysis and Machine Intelligence. 2010;32(1): 45-55, doi: 10.1109/TPAMI.2008.277.
7. Edden RAE, Puts NAJ, Harris AD, Barker PB, Evans CJ. Gannet: A batch-processing tool for the quantitative analysis of gamma-aminobutyric acid-edited MR spectroscopy spectra. J. Magn. Reson. Imaging 2014;40:1445–1452. doi: 10.1002/jmri.24478
8. Pedregosa F, Varoquaux G, Gramfort A, et al. Scikit-learn: Machine learning in Python. Journal of Machine Learning Research. 2011;12:2825–2830.
9. Cohen J (1988). Statistical Power Analysis for the Behavioral Sciences (2nd ed.). Hillsdale, NJ: Lawrence Erlbaum Associates, Publishers.
10. Delgado-Goñi T, Ortega-Martorell S, Ciezka M, et al. MRSI-based molecular imaging of therapy response to temozolomide in preclinical glioblastoma using source analysis. NMR Biomed. 2016;29(6):732-743. doi:10.1002/nbm.3521.
11. Franco P, Huebschle I, Simon-Gabriel CP, et al. Mapping of Metabolic Heterogeneity of Glioma Using MR-Spectroscopy. Cancers (Basel). 2021;13(10):2417. Published 2021 May 17. doi:10.3390/cancers13102417.
12. Verma G, Chawla S, Mohan S, et al. Three‐dimensional echo planar spectroscopic imaging for differentiation of true progression from pseudoprogression in patients with glioblastoma. NMR in Biomed. 2018;32. 10.1002/nbm.4042.
Figures