0839
MR Molecular Imaging of EDB-Fibronectin for Non-Invasive Monitoring of miR-200c Therapy in Pancreatic Cancer
Victoria Laney1, Ryan Hall 1, Grace Yeung1, Victoria Laney1, Suneel Apte 2, and Zheng-Rong Lu3
1Case Western Reserve University, CLEVELAND, OH, United States, 2Cleveland Clinic Foundation, CLEVELAND, OH, United States, 3Case Western Reserve University, Cleveland, OH, United States
1Case Western Reserve University, CLEVELAND, OH, United States, 2Cleveland Clinic Foundation, CLEVELAND, OH, United States, 3Case Western Reserve University, Cleveland, OH, United States
Synopsis
PDAC is a highly aggressive malignant cancer and the 3rd leading cause of cancer related deaths in the US. Currently, treatment options for patients are limited due to late detection of the tumors and lack of effective therapies. The aggressive nature of PDAC is in part due to the desmoplastic tumor microenvironment. MiR-200c regulates epithelial-to-mesenchymal transition and extracellular remodeling for effective treatment of aggressive tumors. In this study, we investigate the effectiveness of MR molecular imaging of extradomain-B fibronectin, an extracellular matrix oncoprotein associated with EMT, for non-invasive monitoring of PDAC tumor response to miR-200c therapy in a mouse model.
Introduction
Pancreatic ductal adenocarcinoma (PDAC) is an aggressive malignant tumors with a five-year survival rate of <9% [1]. Currently, surgical resection is the only curative treatment for PDAC, but the majority of cases are diagnosed at later stages once surgery is no longer viable [2]. PDAC is also resistant to traditional chemo/radio- therapies [3-4]. Critically, both the invasive and desmoplastic nature of PDAC have been linked to the epithelial-mesenchymal transition (EMT) [5-7]. EMT is a morphological process whereby a phenotypic change in cells leads to a mesenchymal state. EMT is regulated by a complex network influenced by epigenetic modifications and transcriptional control. Transcription regulators such as microRNAs including the miR-200 family have been identified as epithelial markers and suppressors of EMT. miR-200c, part of miR-200 gene cluster, has been shown to reduce tumor growth in various cancers including breast cancer and osteosarcoma [8-10]. One goal of this project is to assess the efficacy of miR-200c in treating PDAC. Fibronectin (FN), an abundant matrix protein, is often overexpressed in cancer and is associated with increased tumor growth, migration, invasion and stiffness [11]. Extradomain-B fibronectin (EDB-FN) is an alternatively spliced isoform of FN involved in neovasculatization, cell motility and proliferation. EDB-FN is overexpressed during EMT, with little/no expression in normal adult tissues [12-13]. Previously, we developed a novel EDB-FN targeted contrast agent ZD2-N3-Gd(HP-DO3A) (MT218) for MR molecular imaging (MRMI) [12, 14]. With MT218, we have observed significant contrast enhancement in MR images of aggressive tumors. Because miR-200c is a promising regulator of EMT for PDAC therapy, we intend to assess the therapeutic efficacy of miR-200c in treating PDAC while using MRMI with MT218 for non-invasive monitoring of tumor response and for image-guided therapy.Methods
Murine KPC K8484 PDAC cells were used both in vitro and in vivo. The expression of EDB-FN was analyzed at the mRNA level using quantitative real-time PCR (qRT-PCR) and on the protein level via Western blotting using G4 antibody. KPC cells were also cultured on Matrigel to facilitate ECM and 3D spheroid formation. 3D spheroids were stained with an EDB-FN specific fluorescent probe, ZD2-Cy5.5 and imaged with confocal fluorescence microscopy. A PDAC model was established by subcutaneous inoculation of 100,000 KPC cells on the flank of C57J/B6 mice. One week after tumor initiation, T1-weighted MR images were obtained using a 2D fast spin-echo sequence and a 3D-FLASH sequence pre- and post-i.v.-injection of 0.08 mmol/kg MT218 using a 3T MRSolutions small animal scanner. Mice then received weekly i.v.-injections of RGD-PEG-ECO/miRNA at 1 mg-RNA/kg for a total of 4 doses. MRMI was conducted during and after treatment at weeks 4 (after 2 doses) and week 6 (after 4 doses). Contrast-to-noise ratio (CNR) were calculated using muscle as the control tissue. All animal studies were conducted in accordance with CWRU’s Institutional Animal Care and Use Committee. The targeted contrast agent, MT218, was provided by Molecular Theranostics, LLC. Mice were sacrificed and tumors were excised and embedded in formalin. Fixed samples were subsequently stained for H&E, immunochemistry using G4 antibody, and trichrome stain RGB.Results and discussion
In vitro transfection ECO/miR-200c showed downregulation of FN and EDB-FN mRNA expression in KPC cells when measured with qRT-PCR (Fig 1A). Western blotting also showed a difference in protein level of EDB-FN with siNS versus miR-200c treatment (Fig 1B). Furthermore, when grown in 3D culture, cells transfected with siNS experienced stronger ZD2-Cy5.5 staining compared to miR-200c (Fig 1C). Thus, both the ZD2-Cy5.5 and western blot corroborate the qRT-PCR results on the protein level.Treatment monitoring of PDAC allografts showed a significant difference in tumor size over the course of therapy (Fig 2A). Both siNS and miR-200c treated groups exhibited similar levels of CNR at weeks 1 and 4, after 0 and 2 doses, respectively (Fig 2B). However, at week 6, after 4 doses, there was a reduction in CNR for the miR-200c treated group (Fig 2B and 2C). At week 6, miR-200c mice exhibit a CNR-fold enhancement of 3.5, compared to 5.3-fold in the siNS treated group. This significant difference in CNR may be due to a reduction in EDB-FN expression from miR-200c treatment. Additionally, tumor growth is significantly different between the siNS group and the miR-200c group, where the miR-200c treated group has substantially smaller tumors than those treated with siNS (Fig 2A).
Histopathology indicated differences in tumor composition across groups. While both groups presented with distinct adenocarcinoma and were poorly differentiated in H&E staining, miR-200c tumors appeared to have a less dense microenvironment (Fig 3). Additionally, both tumors stained throughout for EDB-FN but miR-200c tumors distinctly showed less strong staining. The stronger staining with G4 in the siNS group suggests that there is more EDB-FN in siNS treated tumors. Lastly, RGB staining of siNS showed glycoprotein throughout the sample. In the miR-200c tumors, the pattern of collagen staining in the microenvironment may be indicative of tumor remodeling.
Conclusion
The targeted ECO/miR-200c nanoparticles downregulated EDB-FN and elicited significant inhibition of tumor growth. MRMI with MT218 data corresponded to changes in EDB-FN after treatment. Thus, MRMI of EDB-FN-specific MT218 is a promising modality for non-invasive monitoring of tumor response and therapeutic efficacy of the treatment.Acknowledgements
No acknowledgement found.References
- Rawla, P. (2019). Epidemiology of Pancreatic Cancer: Global Trends, Etiology and Risk Factors, 10(1), 10–27.2.
- Wei, K., & Hackert, T. (2021). Surgical Treatment of Pancreatic Ductal Adenocarcinoma. Cancers, 13(8), 1971. https://doi.org/10.3390/cancers130819713.
- Hall, B. R., Cannon, A., Atri, P., Wichman, C. S., Smith, L. M., Ganti, A. K., … Batra, S. K. (2018). Advanced pancreatic cancer: a meta-analysis of clinical trials over thirty years. Oncotarget, 9(27), 19396–19405. https://doi.org/10.18632/oncotarget.250364.
- Zeng, S., Pöttler, M., Lan, B., Grützmann, R., Pilarsky, C., & Yang, H. (2019). Chemoresistance in Pancreatic Cancer. International Journal of Molecular Sciences, 20(18), 4504. https://doi.org/10.3390/ijms201845045.
- Hall, B. R., Cannon, A., Atri, P., Wichman, C. S., Smith, L. M., Ganti, A. K., … Batra, S. K. (2018). Advanced pancreatic cancer: a meta-analysis of clinical trials over thirty years. Oncotarget, 9(27), 19396–19405. https://doi.org/10.18632/oncotarget.250366.
- Porter, R. L., Magnus, N. K. C., Thapar, V., Morris, R., Szabolcs, A., Neyaz, A., … Neyaz, A. (2020). Epithelial to mesenchymal plasticity and differential response to therapies in pancreatic ductal adenocarcinoma, 117(3). https://doi.org/10.1073/pnas.19224691177.
- Takahashi, K., & Ehata, S. (2018). Pancreatic tumor microenvironment confers highly malignant properties on pancreatic cancer cells. Oncogene, 2757–2772. https://doi.org/10.1038/s41388-018-0144-08.
- Vaidya, A., Wang, H., Qian, V., Gilmore, H., & Lu, Z. (2020). Overexpression of Extradomain-B Fibronectin is Associated with Invasion of Breast Cancer Cells, 1–19.9.
- Liu, Y., Zhu, S., Wang, X., Deng, J., Li, W., Zhang, P., & Liu, B. (2017). MiR-200c regulates tumor growth and chemosensitivity to cisplatin in osteosarcoma by targeting AKT2. Scientific Reports, (September), 1–9. https://doi.org/10.1038/s41598-017-14088-310.
- Schilb, A. L., Ayat, N. R., Vaidya, A. M., Hertz, L. M., Hall, R. C., Scheidt, J. H., … Lu, Z. (2021). Efficacy of Targeted ECO / miR-200c Nanoparticles for Modulating Tumor Microenvironment and Treating Triple Negative Breast Cancer as Non-invasively Monitored by MR Molecular Imaging, 1405–1418.11.
- Han, Z., & Lu, Z.-R. (2017). Targeting Fibronectin for Cancer Imaging and Therapy. Journal of Materials Chemistry. B, 5(4), 639–654. https://doi.org/10.1039/C6TB02008A12.
- Han, Z., Li, Y., Roelle, S., Zhou, Z., Liu, Y., Sabatelle, R., … Lu, Z.-R. (2017). Targeted Contrast Agent Specific to an Oncoprotein in Tumor Microenvironment with the Potential for Detection and Risk Stratification of Prostate Cancer with MRI. Bioconjugate Chemistry, 28(4), 1031–1040. https://doi.org/10.1021/acs.bioconjchem.6b0071913.
- Neri, D., & Bicknell, R. (2005). Tumour vascular targeting. Nature Reviews Cancer, 5(6), 436–446. https://doi.org/10.1038/nrc162714.
- Qiao, P., Ayat, N. R., Vaidya, A., Gao, S., Sun, W., Chou, S., … Lu, Z. (2020). Magnetic Resonance Molecular Imaging of Extradomain B Fibronectin Improves Imaging of Pancreatic Cancer Tumor Xenografts, 10(October), 1–13. https://doi.org/10.3389/fonc.2020.586727
Figures
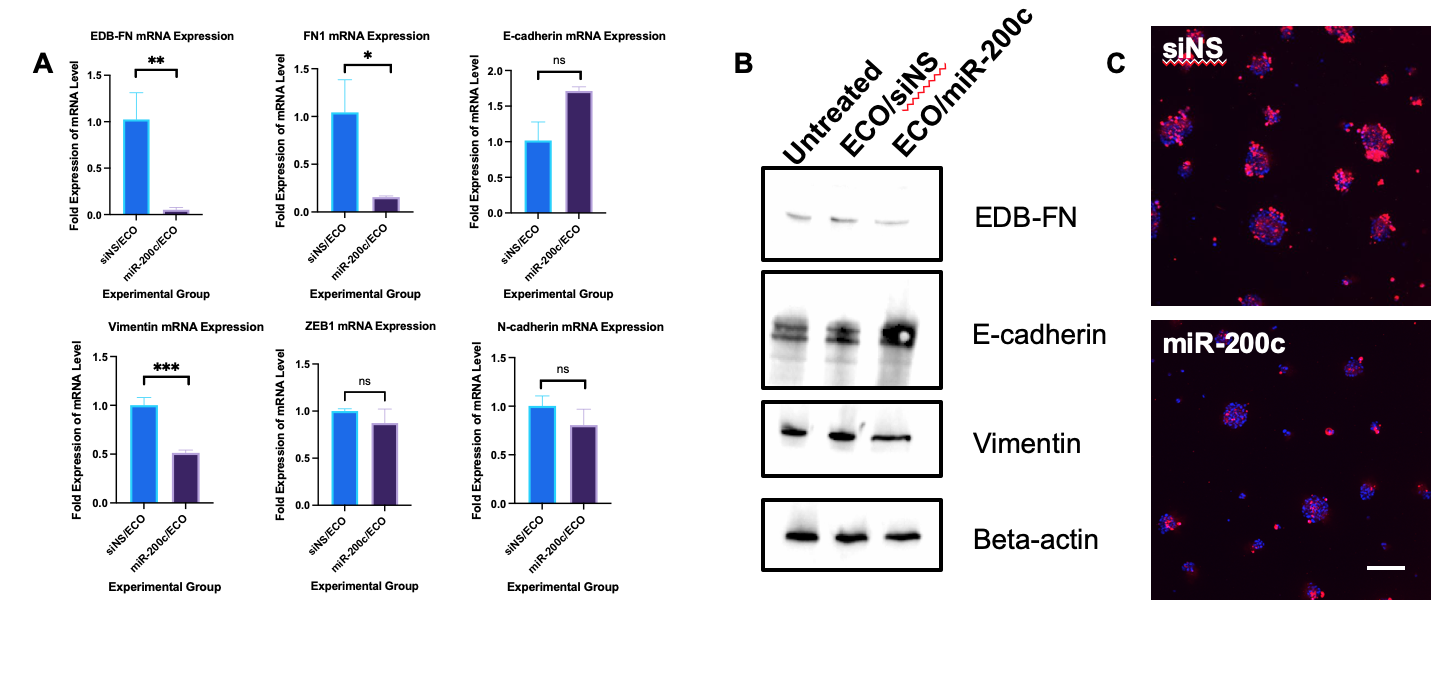
Figure 1. In vitro assessment of ECO/miR-200c therapy on EDB-FN expression. A. qRT-PCR analysis of EDB-FN and EMT markers mRNA expression in KPC cells (* p<0.05). B. Western blot images of EDB-FN and EMT marker protein levels. C. Confocal fluorescence microscopy of EDB-FN protein expression with ZD2-Cy5.5 staining of 3D spheroids. Blue represents nuclei (Hoechst 33342) and red represents EDB-FN (ZD2-Cy5.5).
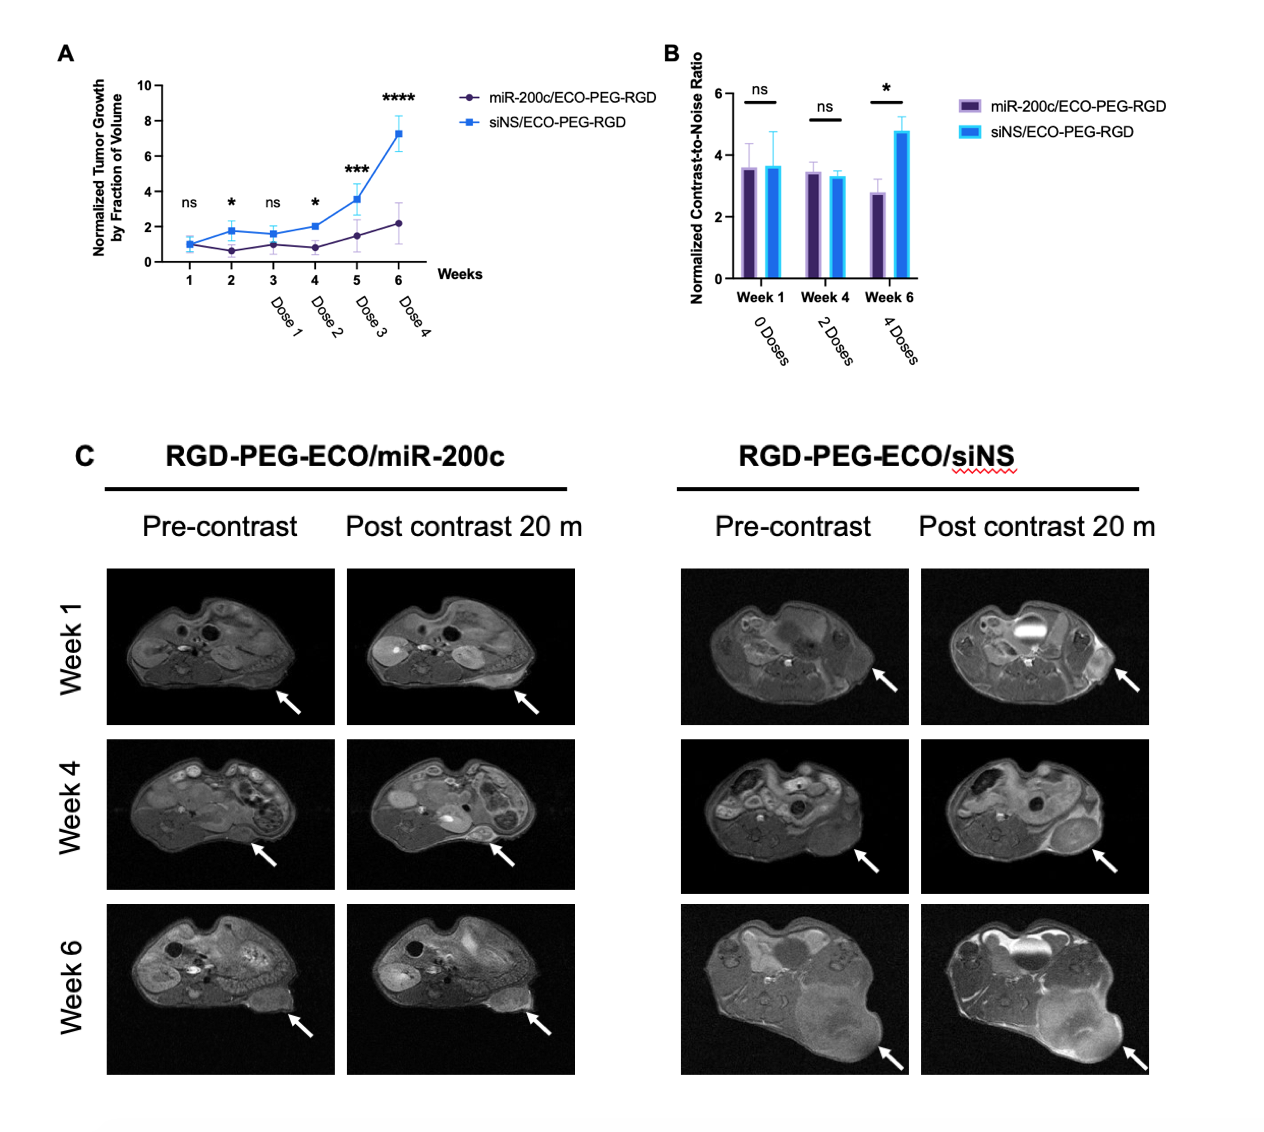
Figure 2. In vivo therapeutic monitoring of RGD-PEG-ECO/miR-200c in PDAC allografts. A. Calipher measurements of tumor growth over time. B. Quantitative CNR analysis for MRMI of KPC allografts with MT218. C. MRMI of RGD-PEG-ECO/siNS and RGD-PEG-ECO/miR-200c prior to treatment (week 1), during treatment (week 4) and after treatment (week 6).
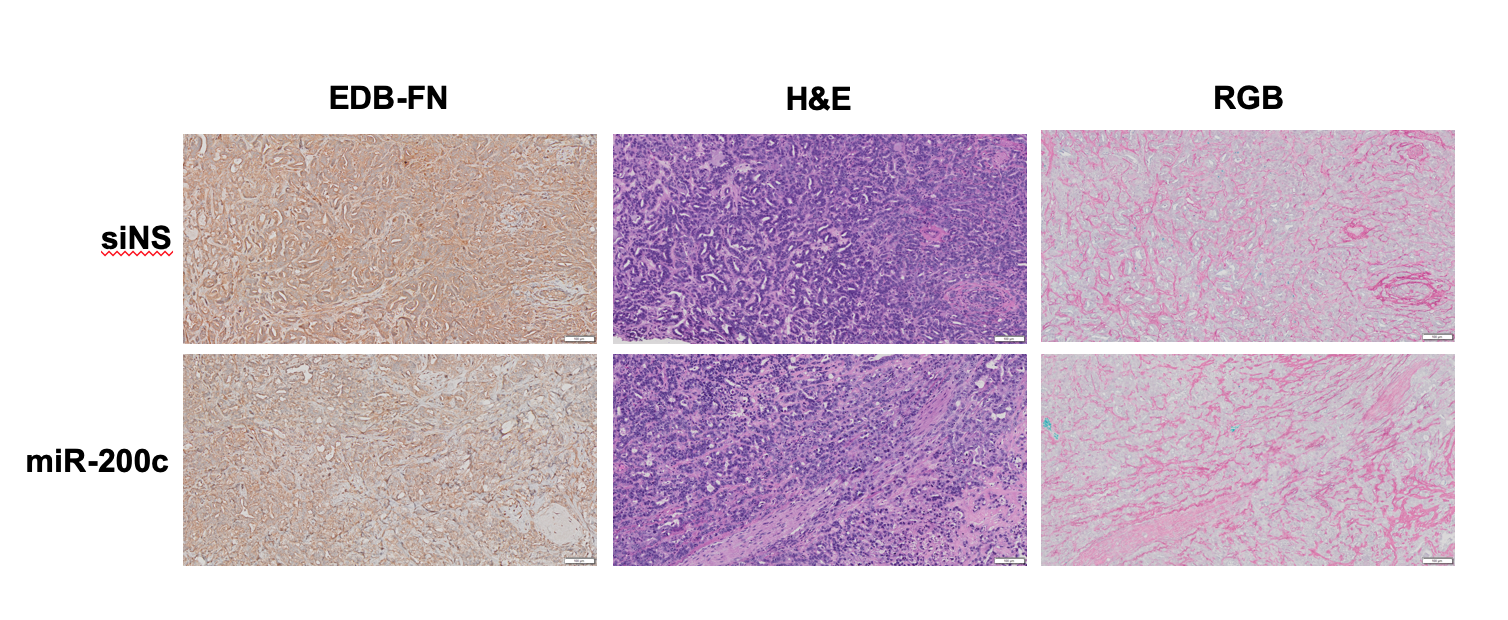
Figure 3. Ex vivo histopathology of siNS versus miR-200c treated tumors: H&E stained tumors for morphology, G4 stained IHC for EDB-FN and RGB stained tumors for collagen, non-collagenous protein and glycoproteins.
DOI: https://doi.org/10.58530/2022/0839