0838
Imaging response to radio-chemotherapy in glioblastoma tumor models using deuterium metabolic imaging1CRUK CI, University of Cambridge, Cambridge, United Kingdom, 2Department of Radiology, University of Cambridge, Cambridge, United Kingdom, 3Department of Chemistry, University of Cambridge, Cambridge, United Kingdom, 4Department of Biochemistry, University of Cambridge, Cambridge, United Kingdom
Synopsis
Metabolic imaging of brain tumor responses to radio-chemotherapy can give an early indication of treatment outcome. We show here that Deuterium Metabolic Imaging (DMI) with 2H-labeled fumarate is more sensitive than diffusion weighted 1H imaging (DWI) in detecting early evidence of cell death following radio-chemotherapy in orthotopically implanted patient-derived glioblastoma xenografts. 2H spectra were acquired from tumors with a time resolution of 5min, following an injection of 2H-labelled fumarate. Within 48h after the last chemo-radiotherapy treatment (CRT) the rate of tumor malate production from labelled fumarate increased significantly, whereas changes in ADC values were only detectable 7 days post treatment.
Introduction
Cell death is an important imaging target for assessing early tumor treatment response and the effectiveness of therapy. The degree of tumor cell death can be a predictive indicator of patient outcome 1. Imaging modalities available in the clinic, such as CT and MRI, have focused on detecting late changes in tumor size rather than evaluating early changes in tumor metabolism or physiology. Here we investigated whether deuterium MRI can be used to detect cell death in radio-sensitive and radio-resistant glioblastoma models and compared these measurements with 1H DWI measurements.Fumarate is hydrated in a reaction catalyzed by the enzyme fumarase to produce malate. Loss of plasma membrane integrity during cell necrosis results in fumarate rapidly gaining access to the enzyme and an increased rate of malate production. We have shown recently that 2H magnetic resonance spectroscopic imaging can be used to measure the rate of tumor malate production following intravenous injection of [2,3-2H2]fumarate2.
Methods
Serial 2H spectra and spectroscopic images were acquired from patient-derived glioblastoma (GB) tumor models implanted orthotopically in mice following injection of [2,3-2H2] fumarate, before and 48 h after the last treatment with targeted radio-chemotherapy (20 Gy in total with 5 fractions per day, temozolomide (100 mg/kg)) delivered using a small-animal radiation research platform (SARRP). Spectra were acquired using a pulse-acquire sequence with a 2 ms BIR4 adiabatic pulse and images using a fast chemical shift imaging sequence with a time resolution of 5 minutes, and a spatial resolution of 3 x 3 x 9 mm3. 2H MR spectra and spectroscopic images were acquired at 7 T, whereas the axial reference 1H images were acquired at 9.4 T. Diffusion-weighted 1H images were acquired at 9.4 T using a spin echo pulse sequence with echo planar readout (FOV 40 x 40 mm2, data matrix 64 x 64; TE 44.86 ms). Diffusion-sensitising gradients equivalent to b-values of 16.17, 56.06, 106.06, 206.06, 406.06 and 806.06 s/mm2 were applied along the slice axis. The apparent diffusion coefficient (ADC) was measured pre-treatment and at 48 h and 7 days post-treatment in a 1 mm thick slice covering the tumor.Results
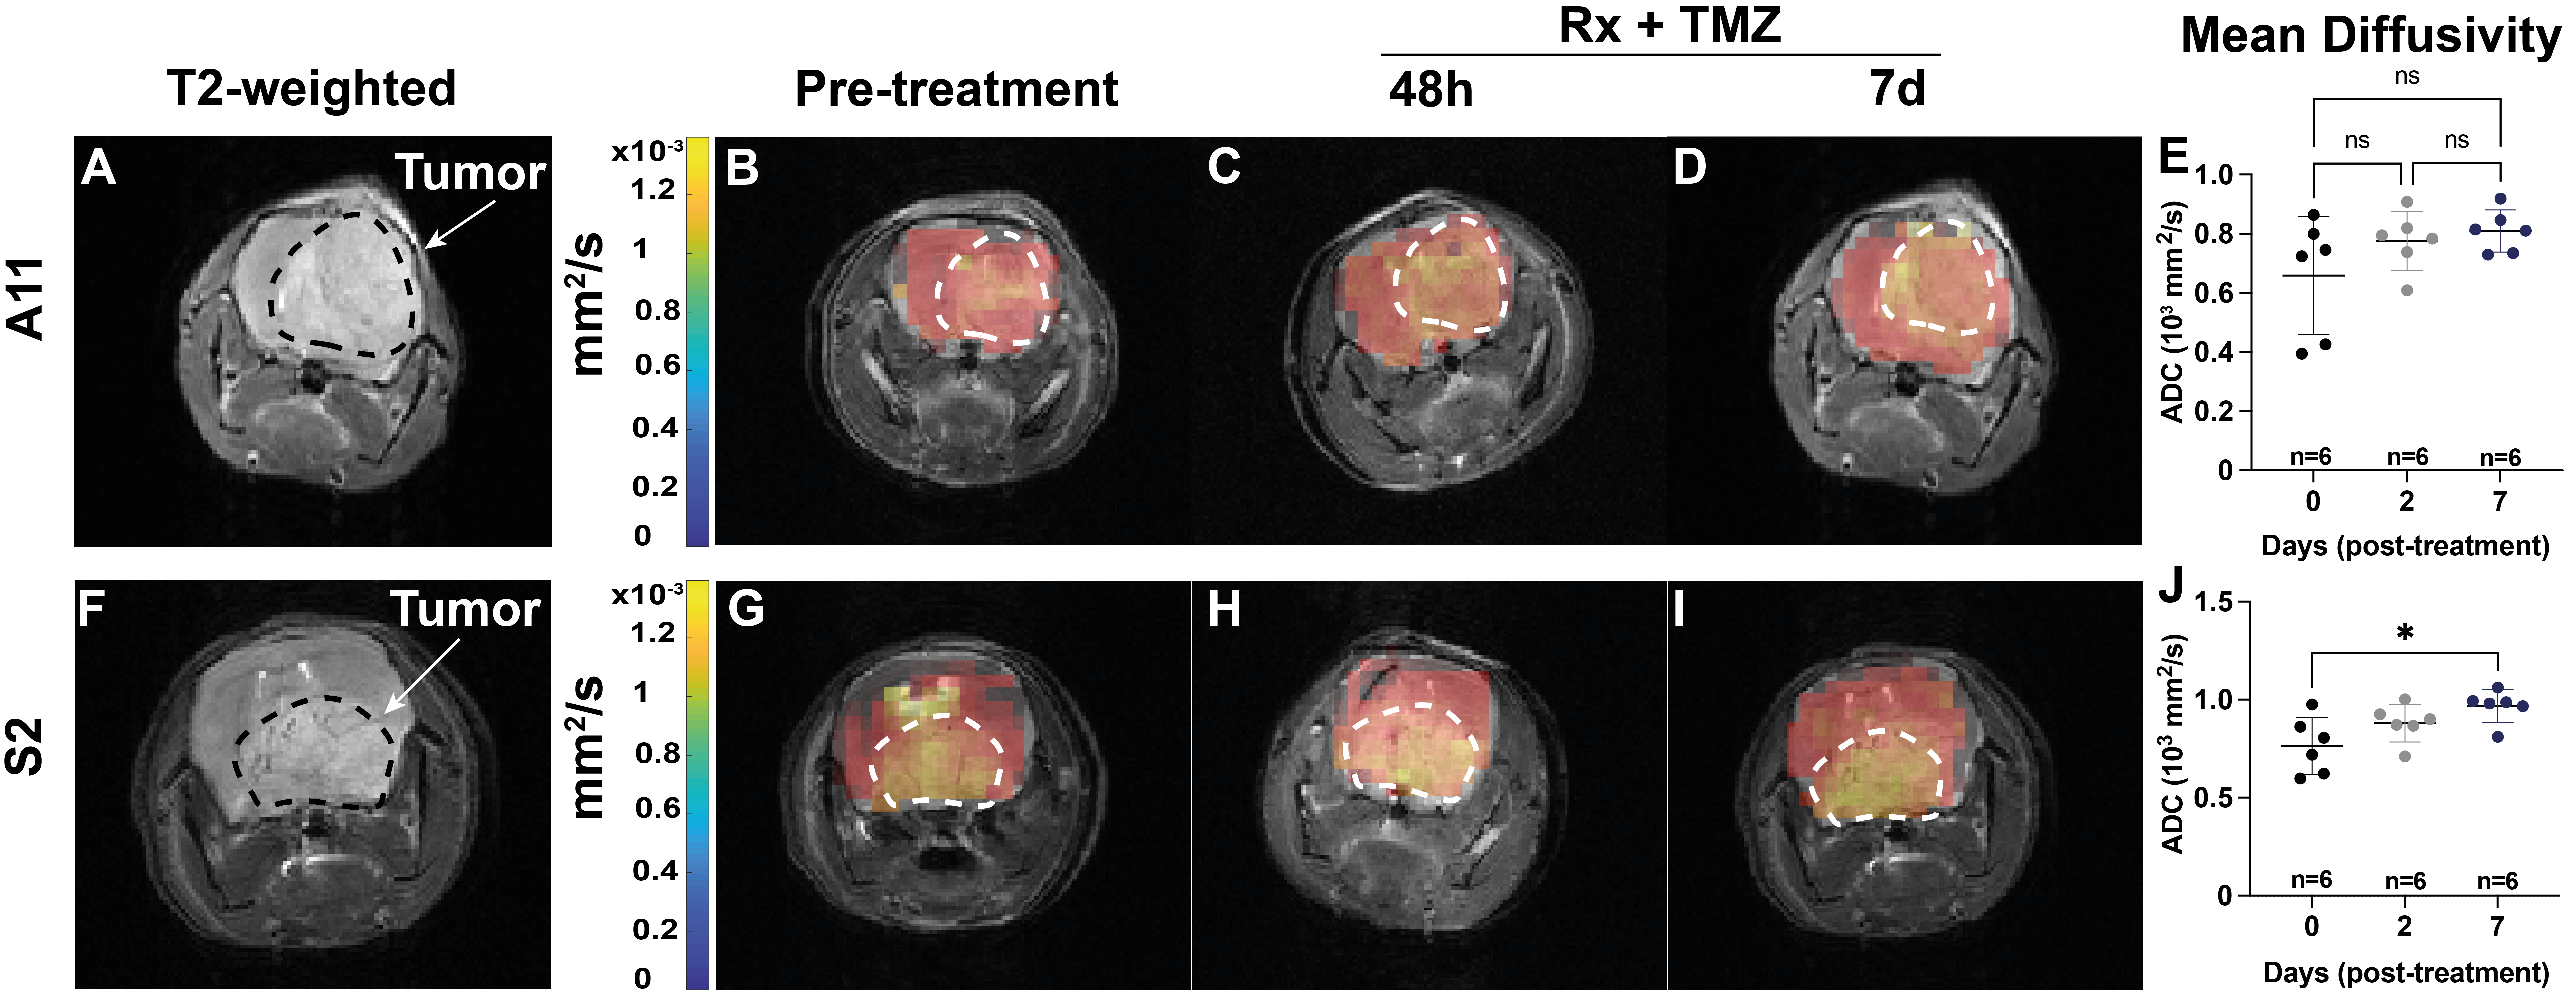
Surface-coil localized 2H MR spectroscopy and spectroscopic imaging were used to assess conversion of [2,3-2H2]fumarate to [2,3-2H2]malate in orthotopically implanted GB tumors following an injection of labelled fumarate (1g/kg) into tumor-bearing mice (Figures 1). 2H spectra acquired over 60 minutes at 48 h after the last chemo-radiotherapy treatment showed an increase in the malate/fumarate ratio from 0.051 ± 0.03 to 0.22 ± 0.03 (p=0.04, n=3) in a radioresistant tumor (A11) and from 0.11 ± 0.032 to 0.94 ± 0.05 (p=0.0006, n=3) in a radiosensitive tumor (S2). Changes in ADC values were only apparent 7 days after treatment (0.71 x10³ ± 0.14 x 10³ to 0.9 x 103 mm2/s, p=0.017) and only in the radiosensitive S2 model (Figure 2).Discussion
Deuterium metabolic imaging (DMI) with [2,3-2H2] fumarate can be used for the quantitative assessment of GB tumor cell death in vivo following standard-of-care treatment with chemoradiation. Malate production, was increased significantly post-treatment after injection of 2H-labeled fumarate. The DW- 1H MRI experiment, however, showed no change in the median ADC of tumor water over this period and the tumor area on diffusion images remained homogeneous. The 2H-labeled fumarate experiment, therefore, detects diffuse tumor necrosis and so may be a more sensitive measure of necrosis than the DW-MRI experiment4.Conclusion
Tumor malate production from [2,3-2H2] fumarate increased significantly at 48 h after targeted chemo-radiotherapy, demonstrating the potential of 2H-labeled fumarate for assessing GB tumor cell death. Diffusion weighted imaging in contrast, only detected response when necrosis was widespread at 7 days post-treatment.Acknowledgements
The work was supported by grants from Cancer Research UK (C197/ A17242, C197/A16465, C9685/A25177). FH is in receipt of a Cambridge European Scholarship from the Cambridge Trust.References
1. Neves AA, Brindle KM. Imaging cell death. J Nucl Med 2014;55(1):1-4.
2. Hesse F, Somai V, Kreis F, et al. Monitoring tumor cell death in murine tumor models using deuterium magnetic resonance spectroscopy and spectroscopic imaging. Proc Natl Acad Sci U S A 2021;118(12).
3. Kreis F, Wright AJ, Hesse F, et al. Measuring Tumor Glycolytic Flux in Vivo by Using Fast Deuterium MRI. Radiology 2020;294(2):289-296.
4. Bohndiek SE, Kettunen MI, Hu DE, et al. Detection of tumor response to a vascular disrupting agent by hyperpolarized 13C magnetic resonance spectroscopy. Mol Cancer Ther 2010;9(12):3278-3288.
Figures
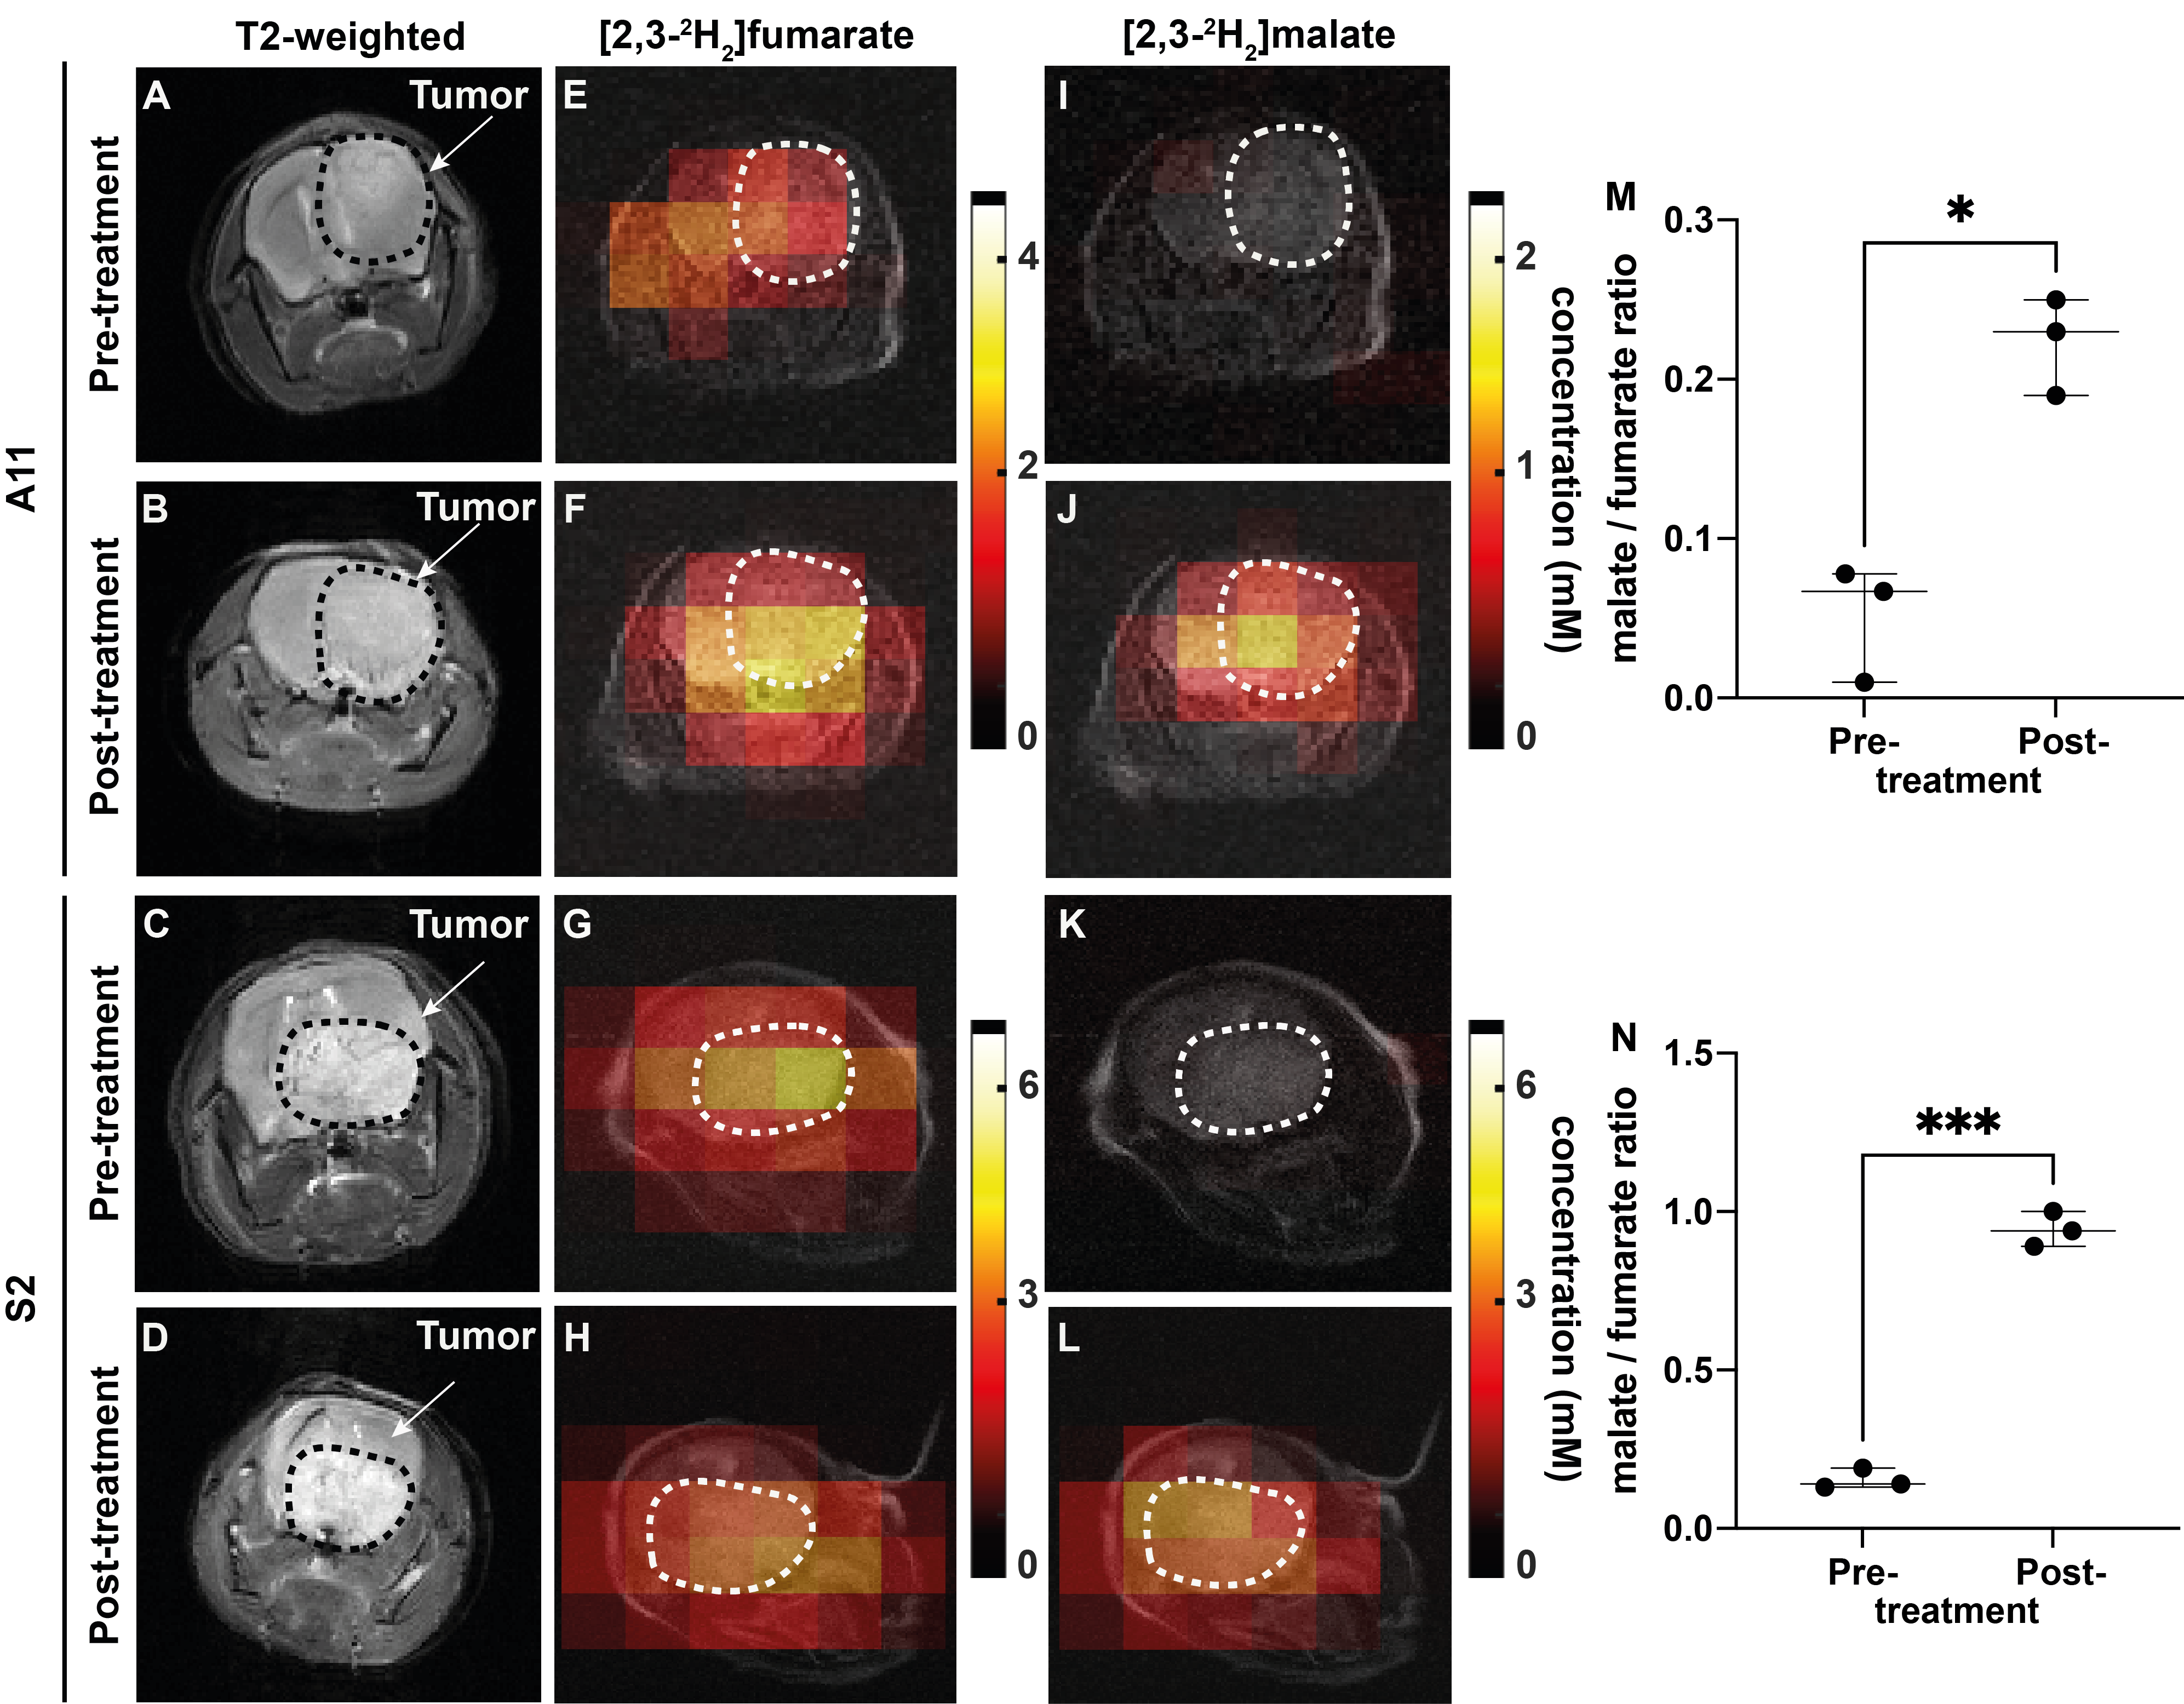
Figure 1: Metabolite concentration maps derived from dynamic 3D chemical shift 2H images summed over 60 min following 2H-fumarate injection. The color code represents conc. (mM) derived from ratios of peak intensities in the malate and fumarate maps to peak intensities in an initial HDO map and corrected for number of 2H labels / molecule and signal saturation. (A-D) Axial reference 1H images (E-L) Conc. maps of (E,G) fumarate, (I,K) malate pre-treatment; (F,H) fumarate, (J,L) malate 48h after CRT. (M,N) Mal/Fum ratio before and 48h after CRT of A11 (*P=0.04) and S2 tumors (***P= 0.0006)