0832
Comparison of MR spectroscopy cut-off parameters in differential diagnosis between glioma recurrence and radionecrosis1MR Unit, Department of Diagnostic and Interventional Radiology, Institute for Clinical and Experimental Medicine, Prague, Czech Republic, 2Department of Neurosurgery, JE Purkyne University and Masaryk Hospital, Ústí nad Labem, Czech Republic
Synopsis
Differential diagnosis between brain tumor recurrence and radionecrosis is still problematic. MR Spectroscopy Imaging (MRSI) is useful in differentiating between these two histologically and radiologically distinct entities. Six methods with different combination of metabolic parameters were used to compare 37 lesions examined by 2D/3D MRSI. The lesional and contralateral comparison of choline-containing compounds and lactate using long echo time achieved the highest sensitivity and specificity. Choline to creatine ratio showed low specificity. The distinction of regressive recurrence as a separate entity is helpful in the effort to discern the complexity of events leading to new enhancing lesions in neurooncologic patients.
INTRODUCTION
Up to 30% of patients with high grade gliomas (HGG) treated with combined radiochemotherapy (RChT) develop a radionecrosis (RAD) mimicking tumor recurrence (REC) on conventional magnetic resonance imaging (MRI)1. The differential diagnosis (DD) between REC and RAD is crucial to tailor appropriate therapeutic response. Numerous studies suggest that proton magnetic resonance spectroscopic imaging (1H MRSI) can distinguish with acceptable specificity between these two entities2,3. MRS correlation with pathologic specimens obtained at biopsy/resection has been shown4-6. However, these studies often differ in methodology, inclusion criteria and metabolite analysis. This heterogeneity complicates the wider use of MRSI in clinical practice. We therefore compared multiple methods of metabolic analysis to test which one performed the best in discriminating REC from RAD in a single prospective cohort of patients.METHODS
Thirty-seven new contrast-enhancing lesions on MRI from 26 patients with a previous surgery for a histologically verified HGG, treated with RChT and 38 healthy subjects were included in the study. All subjects provided written informed consent.Sixteen lesions were classified based on histology from MRI/MRSI navigated specimen (RAD: pure radiation changes, REC: active tumor with mitoses and neovascularization, regressive REC (rREC): tumor cells with necrotic tissue without mitoses or neovascularization; the mean time from MRS to final diagnosis: 37±28 days). 21 lesions were classified based on radiological follow-up during at least 6 months (mean 147±65 days).
The MR examination protocol at 3T scanner (Trio, Siemens) included standard MRI, 1H 2D MRSI (TR/TE/ACQ=1510 ms/30 or 135 ms/4) and 3D MRSI (TR/TE/ACQ=1200 ms/135 ms/1). The spectroscopic voxel of interest included the entire enhancing lesion as well as a feasible biopsy target when possible.
MRSI data was analyzed using jSIPRO with a graphical LCModel-MRSI data interface7.
Six different methods of data evaluation were tested:
Method M1: comparison of lesional choline (Cho)/creatine (Cr) in patients with Cho/Cr in the corresponding brain region of the control group
Method M2: comparison of lesional Cho and lactate (Lac) in patients with corresponding control Cho and Lac intervals
Method M3: interhemispheric comparison of lesional Cho/Cr and contralateral nCho/nCr in each patient. Expressed as percentual metabolite (X) changes between hemispheres:
∆X [%] = (X - nX)/nX*100, (1)
where X was lesional Cho/Cr and nX was contralateral nCho/nCr.
∆X is mathematically similar expression as X/nX, often stated in the literature.
Method M4: interhemispheric comparison of ∆Cho, ∆Lac and ∆(Cho/Cr) using equation (1).
Method M5: Cho/nCr and Cho/nCho comparison with cut-off criteria suggested by Rock4.
Method M6: assessment of Cho/nCho and Cho/N-acetylaspartate (NAA) cut-offs.
Kruskal-Wallis one-way statistical analysis of metabolites or their interhemispheric differences by diagnosis was performed. In case of statistically significant differences (p<0.05), non-parametric comparisons were used for all pairs using Steel-Dwass method.
RESULTS
Significant differences in metabolic and interhemispheric metabolic values between REC, rREC and RAD were found (Tab.1).A subgroup of three histologically confirmed RAD demonstrated a similar metabolic interhemispheric pattern as rREC with the exception of ∆Lac (RAD vs. rREC: -39 vs. 980%) in case of short TE and with the exception of ∆Cho (RAD vs. rREC: -17 vs 38%) and ∆Lac (101 vs -32%) in case of long TE.
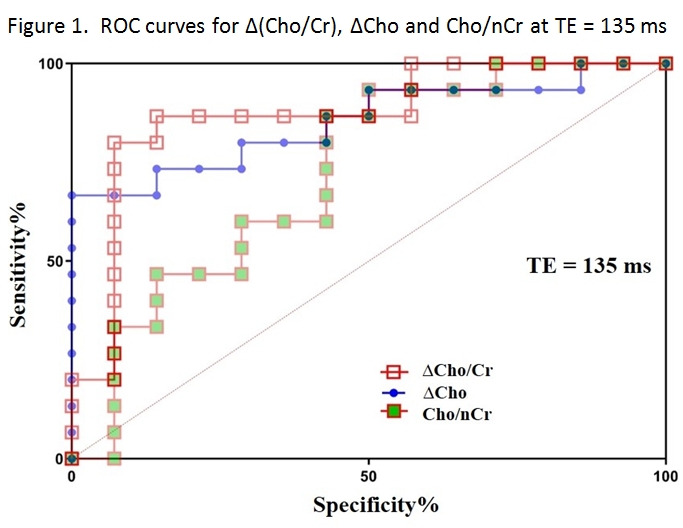
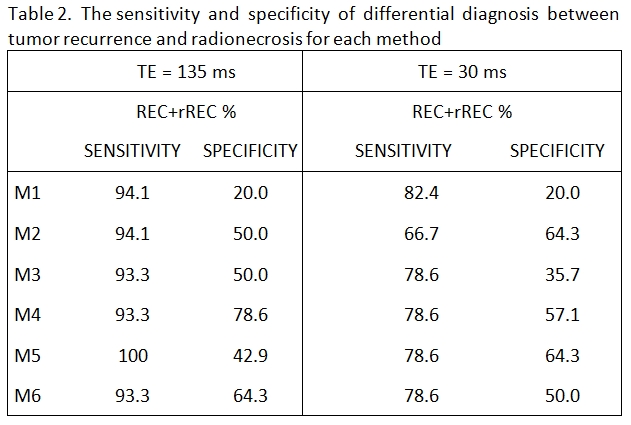
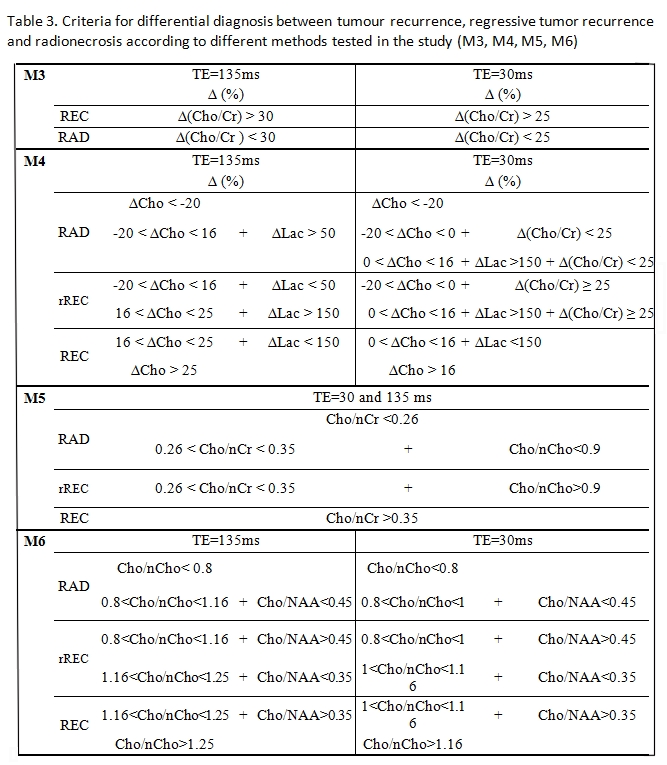
The widest area under the ROC curves was obtained with interhemispheric ∆Cho comparison measured by long TE (Fig.1). All 6 tested methods showed different sensitivities and specificities in differentiating REC from RAD, depending also on TE (Tab.2). The best cut-off criteria found for M3-M6 are summarized in Table 3.
DISCUSSION
Our study confirmed the results of other studies showing a significant difference in Cho/Cr between groups of REC and RAD with TE=135 ms (Tab.1)8,9. Many authors indicate Cho/Cr as a reliable metabolic parameter for DD between these two entities6,10. In our study, Cho/Cr was tested in M1 and M3 and both reached good sensitivity, but low specificity (Tab.2). It may be related to widespread metabolic impairment after oncologic treatment across both REC and RAD, which is in accordance with8; Cr was significantly lower in both groups compared to controls, which resulted in high Cho/Cr in all lesions.Rock4 used Cho/nCho, Cho/nCr and/or (Lac+lipids)/Cho to distinct pure tumor and pure necrosis. Our data confirmed these findings. M4 using the combination of ∆Cho (i.e. Cho/nCho) and ∆Lac (i.e. Lac/nLac) in case of long TE and the combination of ∆Cho, ∆Lac and ∆(Cho/Cr) in case of short TE reached high sensitivity and acceptable specificity.
Four histologically classified rREC showed low energetic metabolism with no significant difference in intralesional Cr concentrations between rREC and RAD during ongoing RChT. Differences in interhemispheric metabolic values between REC, rREC and RAD suggest that a radiologic distinction between three entities, rather than a dichotomic system REC versus RAD, may be more accurate in reflecting the complex nature of these lesions.
CONCLUSION
The sensitivity and the specificity of different metabolic parameters in DD between REC and RAD depended on TE. Cho/Cr is not an appropriate marker in DD. Lesional and contralateral comparison of Cho and Lac signal intensities using long TE appear to be the optimal method in clinical practice. RAD diagnosis assessed during ongoing RChT should be confirmed when RChT is terminated.Acknowledgements
The study was supported by MHCZ-DRO 00023001IKEM.References
1. Alexiou GA, Tsiouris S, Kyritsis AP, et al. Glioma recurrence versus radiation necrosis: accuracy of current imaging modalities. J Neurooncol. 2009;95:1-11.
2. Weybright P, Sundgren PC, Maly P, et al. Differentiation Between Brain Tumor Recurrence and Radiation Injury Using MR Spectroscopy. AJR Am J Roentgenol. 2005;185:1471-1476.
3. Prat R, Galeano I, Lucas A, et al. Relative value of magnetic resonance spectroscopy, magnetic resonance perfusion, and 2-(18F) fluoro-2-deoxy-D-glucose positron emission tomography for detection of recurrence or grade increase in gliomas. J. Clin. Neurosci. 2010;17:50-53.
4. Rock JP, Hearshen D, Scarpace L, et al. Correlations between Magnetic Resonance Spectroscopy and Image-guided Histopathology, with Special Attention to Radiation Necrosis. Neurosurgery. 2002;51:912-920.
5. Croteau D, Scarpace L, Hearshen D, et al. Correlation between magnetic resonance spectroscopy imaging and image-guided biopsies: semiquantitative and qualitative histopathological analyses of patients with untreated glioma. Neurosurgery. 2001;49:823-829.
6. Dowling C, Bollen AW, Noworolski SM, et al. Preoperative proton MR spectroscopic imaging of brain tumors: correlation with histopathologic analysis of resection specimens. AJNR Am J Neuroradiol. 2001;22:604-612.
7. Jiru F, Skoch A, Wagnerova D, et al. jSIPRO – Analysis tool for magnetic resonance spectroscopic imaging. Computer Methods and Programs in Biomedicine. 2013;112:173-188.
8. Siu A, Wind JJ, Iorgulescu JB, et al. Radiation necrosis following treatment of high grade glioma-a review of the literature and current understanding. Acta Neurochir. 2012;154:191-201.
9. Seeger A, Braun C, Skardelly M, et al. Comparison of Three Different MR Perfusion Techniques and MR Spectroscopy for Multiparametric Assessment in Distinguishing Recurrent High-Grade Gliomas from Stable Disease. Acad. Radiol. 2013;20:1557-1565.
10. Plotkin M, Eisenacher J, Bruhn H, et al. 123 I-IMT SPECT and 1 HMR-Spectroscopy at 3.0T in the Differential Diagnosis of Recurrent or Residual Gliomas: A Comparative Study. J Neurooncol. 2004;70:49-58.
Figures
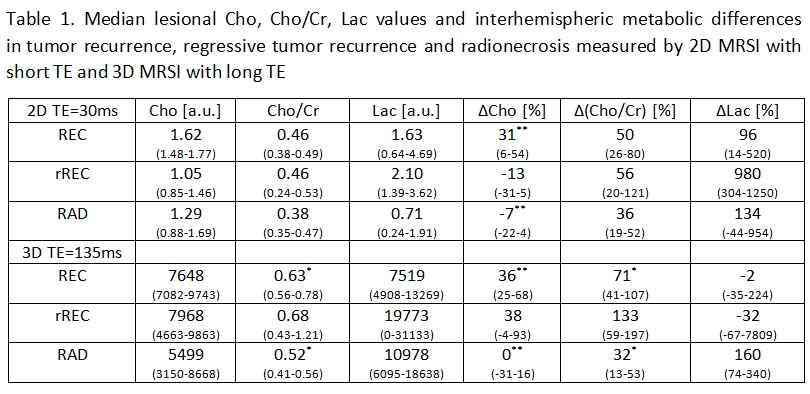
Table 1. a.u. – arbitrary unit, Cho – choline-containing compounds, Cr – creatine/phosphocreatine, Lac – lactate, TE – echo time, ∆ - interhemispheric metabolic changes, RAD – radionecrosis, REC – tumor recurrence, rREC – regressive tumor recurrence, intervals of 25–75% quantile are stated within parentheses, * – p<0.05 statistical significance, ** – p<0.01