0826
MCR-ALS application for prostate cancer localization1Radiology and Nuclear Medicine, Radboud University Medical Center, Nijmegen, Netherlands, 2Analytical Chemistry & Chemometrics, Institute for Molecules and Materials, Nijmegen, Netherlands
Synopsis
Three-dimensional MRSI data of the prostate was analyzed with a Multivariate Curve Resolution-Alternating (MCR) approach for rapid automated localization and classification of cancer and healthy tissue. This data-driven method was used to extract common spectroscopic components without a need of prior knowledge, and compared to fitting a linear combination of prior knowledge models (LCModel). The MCR method identified components with known prostate metabolites and residual lipid and water signals Altogether, our approach can be considered as a step towards the development of an automated tool for classification of prostate MRSI spectra, avoiding subjective human intervention.
Introduction
Automated and reliable spectral evaluation is essential for the clinical use of 3D 1H-MRSI of the prostate1. The multivariate Curve Resolution-Alternating (MCR) method aims at reconstructing the relative intensity of spectral profiles of individual chemical components within a sample2, providing an easily interpretable model. Aim of this work is to apply the data-driven MCR method to prostate MRSI data for rapid automated localization and classification of cancer and healthy tissue, reducing the requirement for in-house expertise and improving objectiveness by avoiding subjective human intervention.Method
We used data from 5 patients with prostate cancer (53-69 years, mean age 61 years) acquired on a 3T MR system (MAGNETOM Trio, Siemens Healthcare, Erlangen, Germany) with a body coil for transmission and an endorectal coil (MEDRAD, Pittsburgh, PA) for signal reception.Non-water suppressed MRSI data were acquired using a semi-LASER sequence with frequency-selective refocusing and crushing of lipid signals3, optimized pulse timing for the spectral shape of citrate(TE 88ms) and a TR of 1930 ms. The water signal and sideband artefacts were removed in post-processing using the Löwner BSS algorithm4. Magnitude spectra(n=1824) in the spectral range of interest(2-4ppm) of 4 patients were used to perform MCR, which models the data X as a linear mixture of components: X=CS, where C and S are matrices of the pure components’ relative abundances and spectral profiles respectively. These profiles are obtained by imposing mathematical constraints based on physicochemical principles. Therefore, MCR differs from other commonly used bilinear models such as Principal Component Analysis, whose components satisfy pure mathematical criteria(e.g.orthogonality) that do not necessarily relate to natural properties. The number of components in the model was estimated with Singular Value Decomposition(SVD) and initialized by entropy minimization5. The initial profiles were iteratively optimized using MCR-Alternating Least Squares(MCR-ALS)2, imposing a non-negativity constraint.
The relative intensities of each component for each voxel were normalized across all voxels from 4 patients, and mapped slice-by-slice for a qualitative validation of the model, using the histopathology reports as gold standard. The model’s components were interpreted following the patterns of in-vivo prostate spectral shapes1. The component with the highest intensity in the Choline ppm region was further investigated as the most suspicious for the presence of tumor. As a second independent quantification method, spectra from all voxels were fitted with LCModel (Fig.1b,c) and the ratio (Choline+Creatine)/Citrate was calculated6. Z-score approach for both the relative intensity of the suspicious component from MCR-ALS and the LCModel’s metabolite ratio was used to calculate thresholds to discriminate between healthy and cancerous spectra. Different thresholds were calculated for the peripheral zone(PZ) and the central gland(CG) of the prostates. The performance of the two methods was compared with the untested data of the 5th patient(456voxels) with a confusion matrix.
Results and Discussion
The optimal number of components, as assessed by SVD, was 4 for the training set of 4 prostate cancer patients (Fig.1). Examples of relative intensity maps of the components are presented for a slice in a patient with a tumor with Gleason score 2+3 (Fig.2) and for a patient with an aggressive tumor(Gleason score 3+4) (Fig.3). The spectral profile of component 1 has a shape similar to that of healthy prostate spectra, with high levels for Cit (2.6ppm) and low for Cho (3.2ppm) and Cre (3.03ppm). In contrast, the spectral profile of component 2, with elevated intensity in the Cho ppm range, is deemed representative for tumor spectra. Qualitatively in all 4 patients, the regions of increased levels of component 1 and 2 seemed to correlate with histopathologically healthy regions and regions with tumor tissue, respectively. Tentatively, in cases with more aggressive tumors, the intensity levels of component 2 were increased in comparison with less aggressive tumors (Fig.3). In the example of the aggressive tumor (Fig. 3), the mean value of the relative intensity of component 2 in 6 voxels located in the tumorous region was 0.87±0.05 AU, while in the second case (Fig.2) it was 0.68±0.04AU. The spectral profile of component 3 corresponded to prostate signals that were contaminated by lipids, which commonly occurs at the borders of the prostate (comp.3 in Fig.2,3). Finally, the profile of component 4 may arise from water signal that was not sufficiently removed.The model, built on 1824 spectra from 4 patients, was applied to the 456 untested spectra of the 5th patient. The defined thresholds for component 2 from MCR-ALS (0.36AU for CG and 0.31AU for PZ) and for the metabolite ratio from LCModel (0.37AU for CG and 0.30AU for PZ) were used to classify the spectra as suspicious and non-suspicious for prostate cancer. Both methods agreed with an accuracy of 98% in classifying voxels of test patient 5 (Table 1), and the added value of MCR-ALS that prior knowledge is not required.
Conclusion
MCR-ALS can be used for the extraction of common spectroscopic components without a need of prior knowledge. The components can be used to classify prostate spectra as suspicious and non-suspicious for cancer, as well as identify lipids in the prostate. Furthermore, the results indicate the method may also assess tumor aggressiveness. Altogether, our approach can be considered as a step towards the development of an automated tool for classification of prostate MRSI spectra.Acknowledgements
This project has received funding from the European Union's Horizon 2020 research and innovation program under the Marie Sklodowska-Curie grant agreement No 813120.
References
1. Tayari N, Heerschap A, Scheenen TWJ, Kobus T. In vivo MR spectroscopic imaging of the prostate, from application to interpretation. Anal Biochem. 2017;529. doi:10.1016/j.ab.2017.02.001
2. De Juan A, Jaumot J, Tauler R. Multivariate Curve Resolution (MCR). Solving the mixture analysis problem. Anal Methods. 2014;6(14). doi:10.1039/c4ay00571f
3. Tayari N, Wright A, Heerschap A. Absolute choline tissue concentration mapping for prostate cancer localization and characterization using 3D 1 H MRSI without water-signal suppression. Magn Reson Med. Published online September 23, 2021.
4. Stamatelatou A, Sima DM, Van Huffel S, Van Asten JJ, Heerschap A, Scheenen TWJ. Post-acquisition water signal removal in 3D water-unsuppressed 1H-MR spectroscopic imaging data of the prostate. ISMRM Proceedings; 2021.
5. Bertinetto CG, de Juan A. Systematic comparison and potential combination between multivariate curve resolution–alternating least squares (MCR-ALS) and band-target entropy minimization (BTEM). J Chemom. 2018;32(6). doi:10.1002/cem.3000
6. Kobus T, Wright AJ, Weiland E, Heerschap A, Scheenen TWJ. Metabolite ratios in 1H MR spectroscopic imaging of the prostate. Magn Reson Med. 2015;73(1). doi:10.1002/mrm.25122
Figures
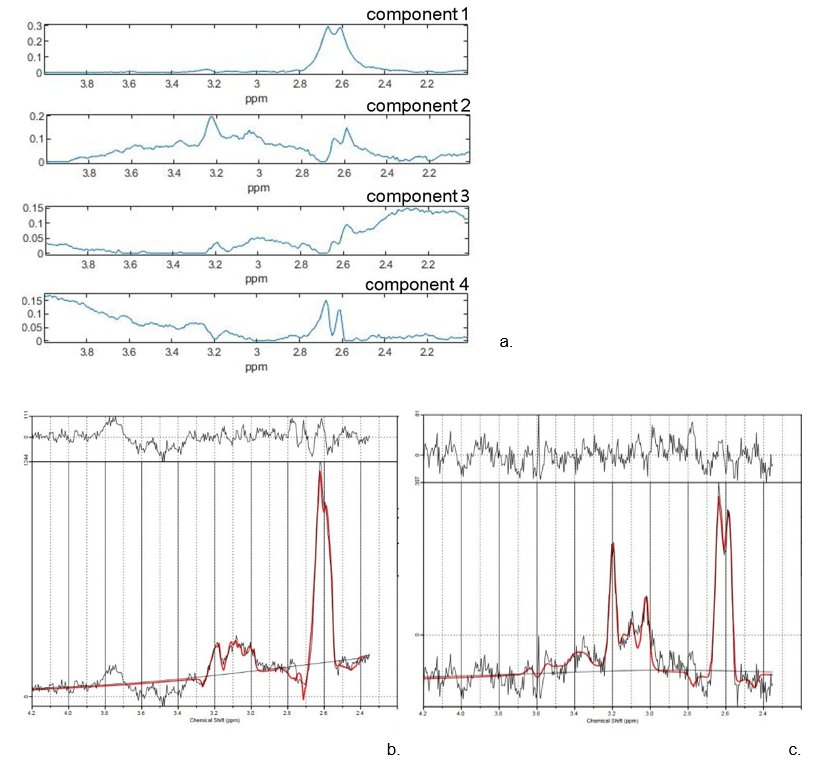
Figure 1. a. The spectral profiles of the components extracted with MCR-ALS from 4 prostate cancer patients. b. LCModel output of a healthy spectrum with high citrate levels that are also present in component 1. c. LCModel output of a cancerous spectrum, with an elevated choline signal at 3.2 ppm that can be observed in component 2.
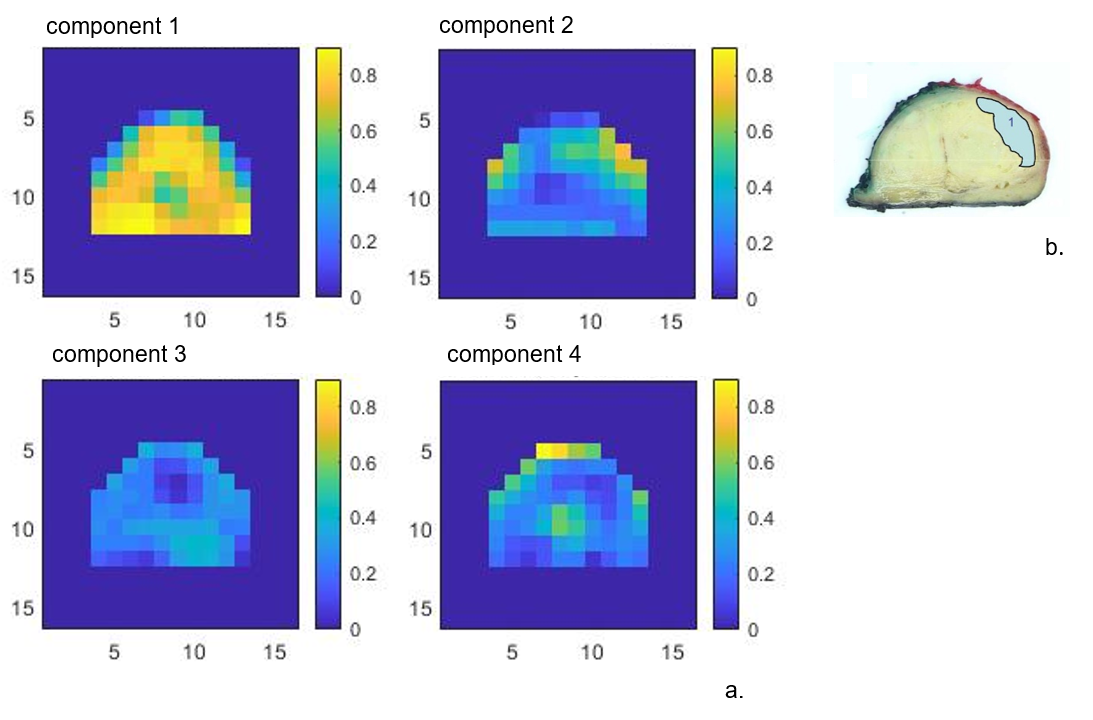
Figure 2. a. The relative intensity maps of each component in a slice of a prostate with a cancer lesion. The values are normalized across all voxels from 4 patients. b. Histopathology of the closest matching slice. A tumor is present with a Gleason score 2+3.
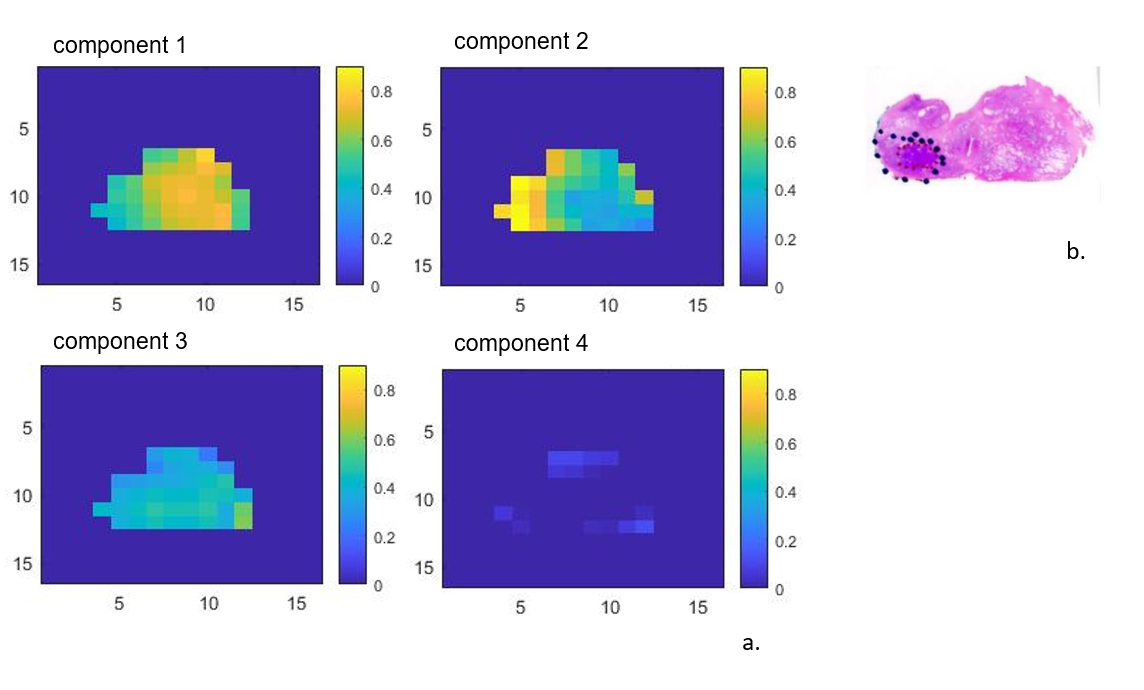
Figure 3.a. The relative intensity maps of each component in a slice of the prostate of a different patient with prostate cancer. The values are normalized across all voxels from 4 patients. b. Matching histopathology identified a tumor with Gleason score 3+4.
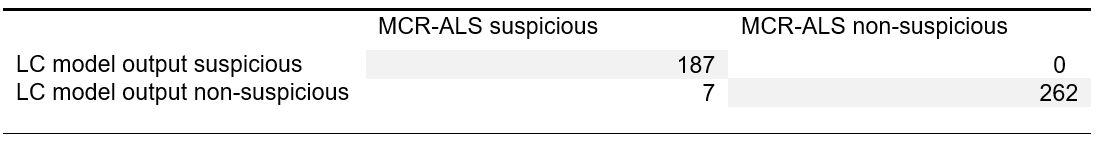
Table1. Confusion matrix comparing the performance of the data-driven MCR-ALS approach and LCModel fitting. Both methods had their own z-score calculated as the threshold between suspicious and non-suspicious spectra for the presence of prostate cancer.