0825
Incorporating compartmental T2 measurements into Restriction Spectrum Imaging of the prostate1Department of Radiology, University of California San Diego, La Jolla, CA, United States, 2Department of Radiation Medicine and Applied Sciences, University of California San Diego, La Jolla, CA, United States, 3Department of Neurosciences, University of California San Diego, La Jolla, CA, United States, 4Halıcıoğlu Data Science Institute, University of California San Diego, La Jolla, CA, United States, 5Department of Bioengineering, University of California San Diego, La Jolla, CA, United States
Synopsis
Restriction Spectrum Imaging (RSI) examines diffusion in discrete tissue compartments to better detect and characterize prostate cancer. T2 information from these compartments may further improve prostate cancer evaluation. In this study, RSI data was acquired using multiple echo times to measure both compartmental T2 and diffusion in patients with suspected prostate cancer. A multivariable model was then developed to identify cancer from compartmental T2 and diffusion measurements. Significant differences in compartmental T2 were observed between normal and cancerous prostatic tissue. However, the multivariable model did not significantly improve cancer detection performance over diffusion measurements alone.
Introduction
Restriction Spectrum Imaging (RSI) is a multicompartmental approach to diffusion-weighted imaging (DWI) that examines diffusion within discrete tissue compartments to detect and characterize prostate cancer.1–3 While T2 assessment has also proven useful for prostate cancer imaging,4–6 it is not known whether the T2-relaxation properties of RSI tissue compartments would provide complementary information to improve cancer detection beyond that achieved with diffusion alone.In this study, we acquired prostate RSI data at multiple echo times (TEs) to derive measurements of not only diffusion, but also compartmental T2. Compartmental T2 values were then compared between normal prostatic tissue and biopsy-proven cancer. Finally, a multivariable model was developed to identify cancerous tissue using both diffusion and compartmental T2 measurements.
Methods
This study included 46 patients who underwent MRI evaluation for prostate cancer. Radiological examination (compliant with PI-RADS v2 standards7) and subsequent biopsy identified prostate cancer in 23 patients, while the remaining 23 had no detectable cancer. Benign lesions were identified in 13 patients.MRI acquisition
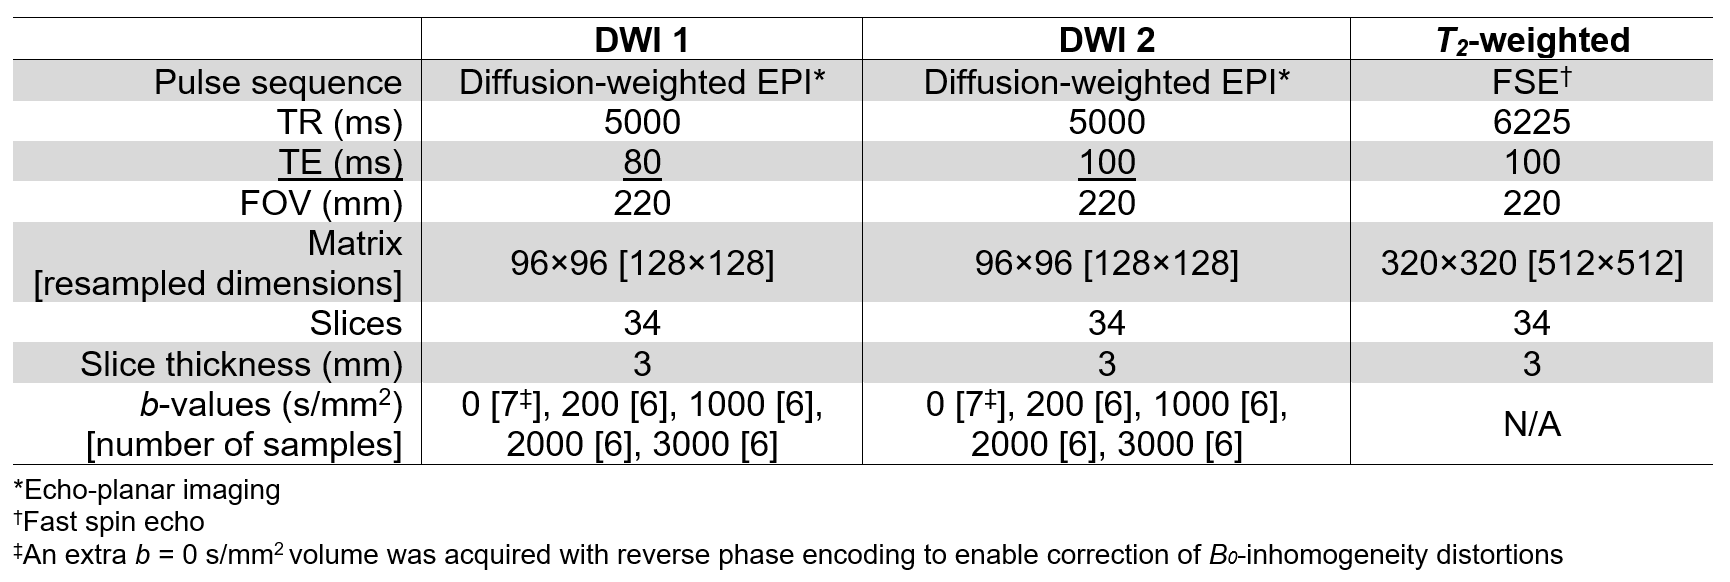
MRI acquisition details are summarized in Table 1. For each patient, two axial DWI volumes were separately acquired using different TEs but with all other parameters held constant. A T2-weighted volume was also acquired for anatomical reference.
MRI post-processing
Each DWI volume was corrected to account for B0-inhomogeneities, gradient nonlinearities, eddy currents,8 and image noise.1 Samples at each b-value were averaged together. Image registration9 was applied to correct for patient motion between acquisitions. To account for arbitrary signal-intensity scaling between acquisitions, the DWI volumes were normalized by the median signal intensity of urine in the bladder.10 For all patients, regions of interest (ROIs) were defined over the whole prostate, peripheral zone, and transition zone. ROIs were also defined over all cancerous and benign lesions.
RSI modeling
Prior studies established an RSI model for evaluating prostate diffusion characteristics1,2:
$$S(b)=\sum_{i=1}^{4}C_{i}e^{-bD_i}$$
where S(b) denotes the measured DWI signal at a particular b-value, Ci describes the compartmental signal contributions to be determined via model-fitting, and Di refers to the compartmental diffusion coefficients which are fixed for each of the 4 tissue compartments (to 1.0e-4, 1.8e-3, 3.6e-3, and >3.0e-2 mm2/s, respectively). Signal-contribution (Ci) maps were computed for both DWI volumes per patient by fitting this model to the signal-vs-b-value curve from each voxel.
Compartmental T2 mapping
For each RSI model compartment, voxel-wise maps of apparent compartmental T2 (acT2) were computed from the two signal-contribution measurements at different TEs. Median acT2 was computed within all ROIs and compared between tissue types, using two-sample t-tests (α=0.05) to check for significance. Any compartments with a significant difference in acT2 between normal and cancerous tissue were noted for inclusion in subsequent multivariable modeling.
Multivariable modeling
Logistic regression was used to relate diffusion and acT2 measurements from a voxel to the probability that it contains cancer. The previously described RSI restriction score2 (normalized C1 signal) was included as the diffusion parameter of the model. Parameter measurements from all voxels in all ROIs were used to train the model. Ten-fold cross validation was applied to evaluate the voxel-level cancer-detection performance of model probability estimates, using area under the receiver operating characteristic curve (AUC) and 95% confidence interval (CI). AUC and bootstrapped 95% CI were also computed for patient-level cancer detection, using maximum probability within the prostate as the predictor variable.
Results
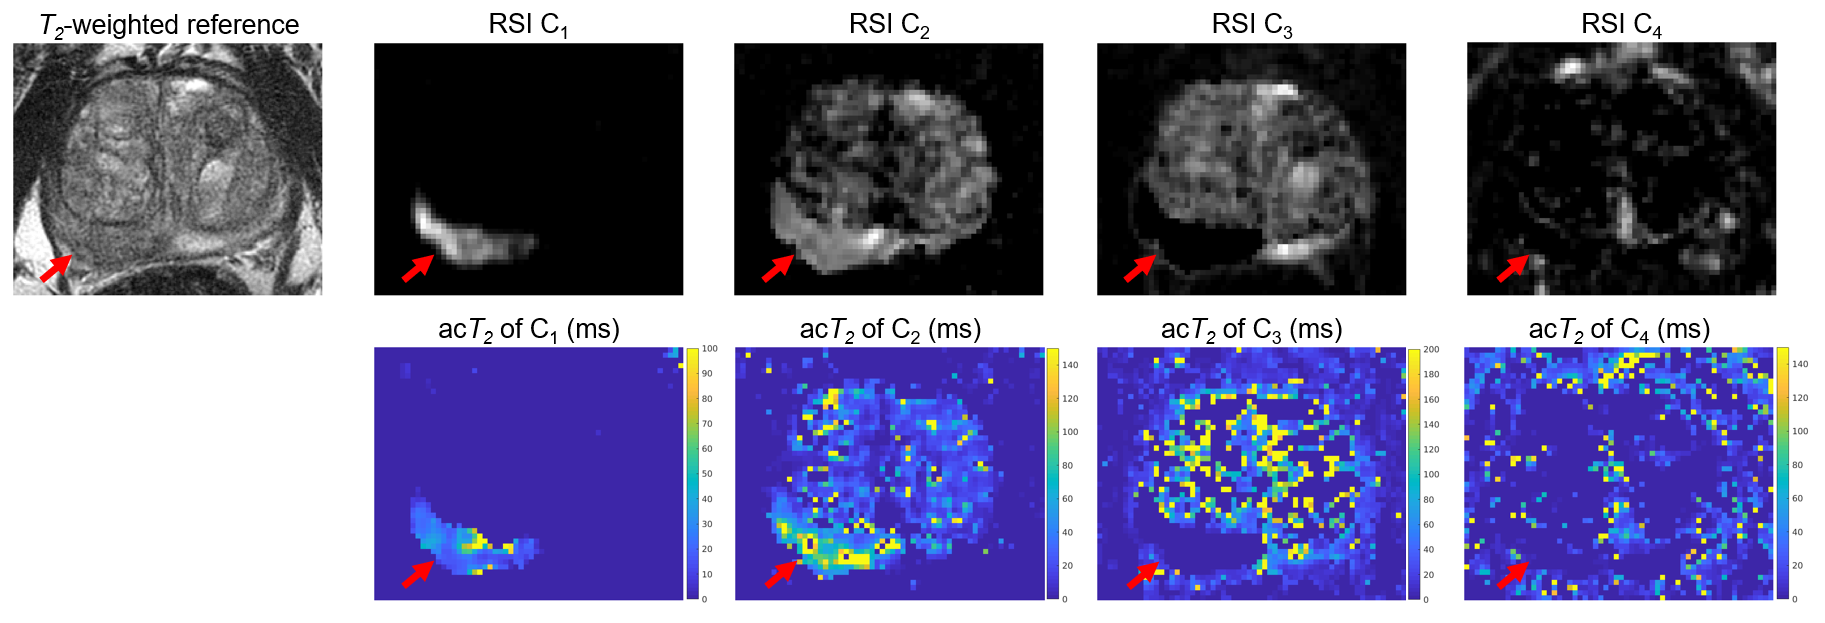
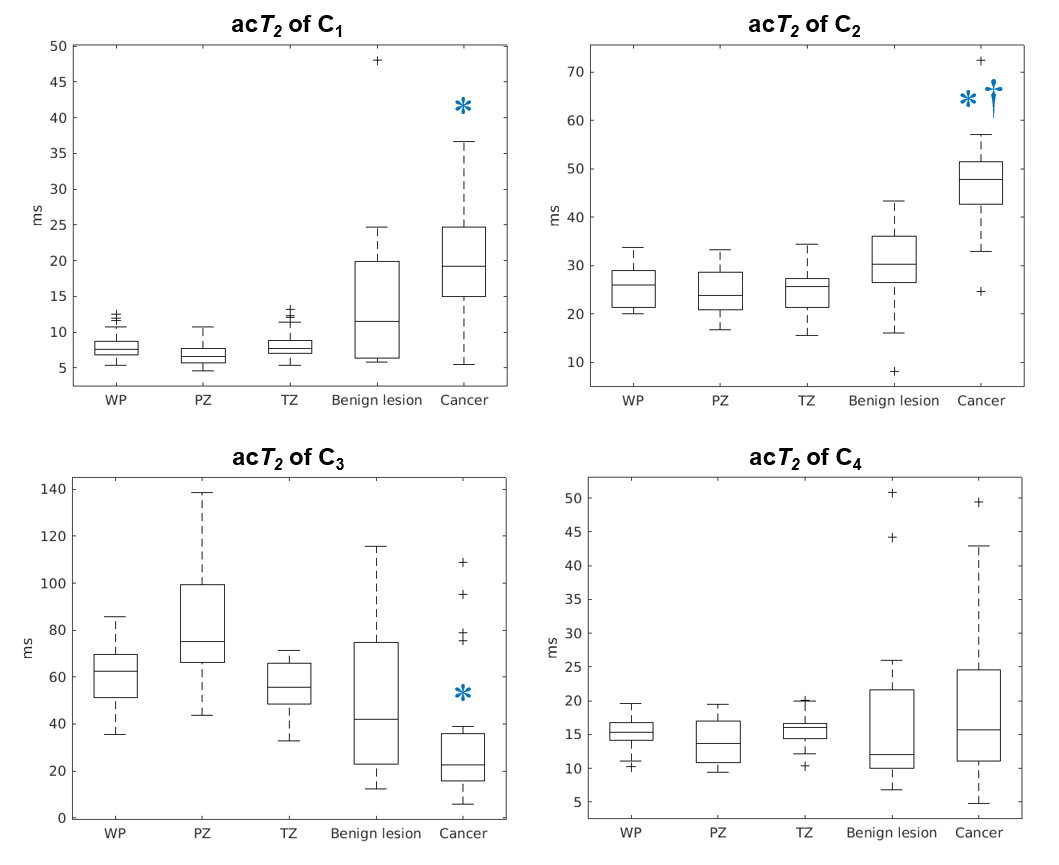
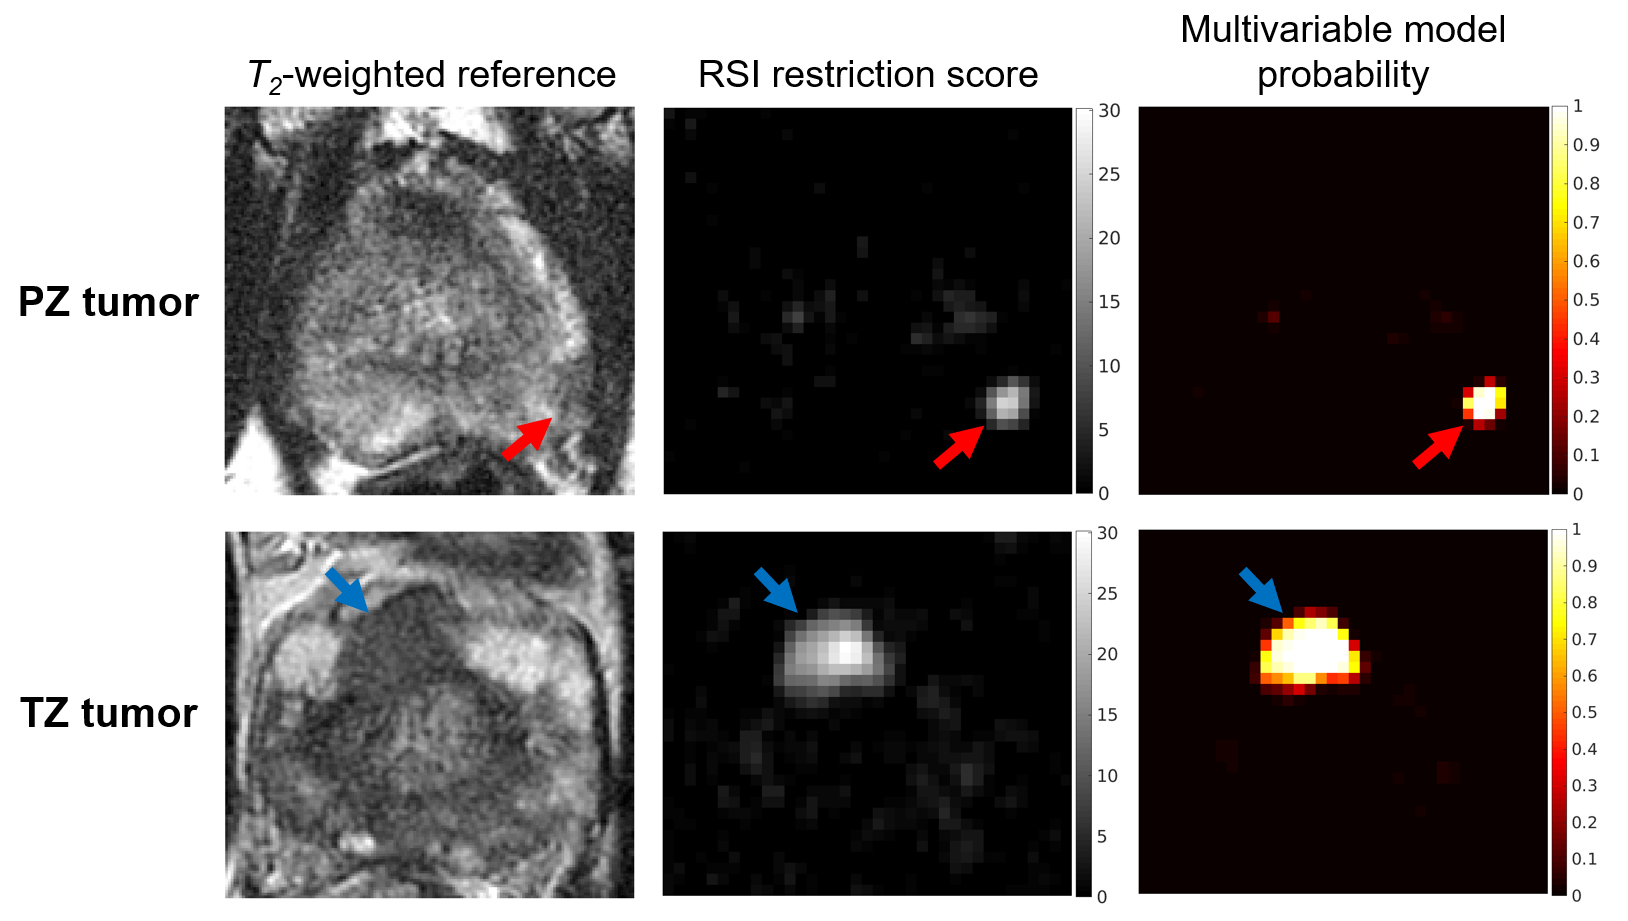
Example acT2 maps for the 4 RSI model compartments are shown in Figure 1 for a patient with prostate cancer. Figure 2 compares the acT2 of each compartment between tissues. Cancer showed significantly higher acT2 values in C1 (P$$$\ll$$$0.001) and C2 (P$$$\ll$$$0.001) than normal tissues, and significantly lower acT2 in C3 (P$$$\leq$$$0.004). The acT2 of C2 was also significantly higher in cancer than in benign lesions (P$$$\ll$$$0.001).Multivariable model parameters were acT2 measurements from C1, C2, and C3, in addition to the RSI restriction score. Cancer probability maps generated using the model are shown in Figure 3. While tumors were salient on model probability maps, the cancer-detection performance of the model was not significantly greater than that of the RSI restriction score alone. At the voxel level, model AUC was 0.982 [95% CI: 0.970, 0.993], versus 0.979 [0.964, 0.994] from the RSI restriction score. At the patient level, model AUC was 0.783 [0.779, 0.788], versus 0.781 [0.777, 0.786] from the RSI restriction score.
Discussion
Differences in acT2 between cancerous and normal tissue provide insight into the microstructural changes associated with prostate cancer. Elevated acT2 in compartment C1 of cancer suggests an increased nuclear volume fraction,11 and lower acT2 in C3 may reflect hyperplasia-induced reductions in luminal space.4 Extracellular matrix remodeling likely contributed to increased acT2 in C2.3 In this study, consideration of acT2 did not significantly improve cancer detection performance over diffusion alone. However, our data included only high-confidence cancer and control phenotypes, for which there is limited capacity for improvement over conventional RSI.2 Furthermore, the use of separate acquisitions and only 2 TEs may have limited the accuracy of voxel-wise acT2 measurements. Ongoing work with a larger patient cohort that includes whole-mount histopathology will permit improved assessment of the potential impact of compartmental T2 measurements on the prediction of cancer grade and extent with RSI.Acknowledgements
This work was supported, in part, by the National Institutes of Health (NIH/NIBIB K08 EB026503), the American Society for Radiation Oncology, and the Prostate Cancer Foundation.References
1. Conlin CC, Feng CH, Rodriguez‐Soto AE, et al. Improved Characterization of Diffusion in Normal and Cancerous Prostate Tissue Through Optimization of Multicompartmental Signal Models. Journal of Magnetic Resonance Imaging 2021; 53:628–639.
2. Feng CH, Conlin CC, Batra K, et al. Voxel-level Classification of Prostate Cancer on Magnetic Resonance Imaging: Improving Accuracy Using Four-Compartment Restriction Spectrum Imaging. Journal of Magnetic Resonance Imaging 2021; 54:975–984.
3. White NS, McDonald CR, Farid N, et al. Diffusion-Weighted Imaging in Cancer: Physical Foundations and Applications of Restriction Spectrum Imaging. Cancer Res 2014; 74:4638–4652.
4. Hectors SJ, Said D, Gnerre J, Tewari A, Taouli B. Luminal Water Imaging: Comparison With Diffusion-Weighted Imaging (DWI) and PI-RADS for Characterization of Prostate Cancer Aggressiveness. Journal of Magnetic Resonance Imaging 2020; 52:271–279.
5. Chatterjee A, Bourne RM, Wang S, et al. Diagnosis of Prostate Cancer with Noninvasive Estimation of Prostate Tissue Composition by Using Hybrid Multidimensional MR Imaging: A Feasibility Study. Radiology 2018; 287:864–873.
6. Zhang Z, Wu HH, Priester A, et al. Prostate Microstructure in Prostate Cancer Using 3-T MRI with Diffusion-Relaxation Correlation Spectrum Imaging: Validation with Whole-Mount Digital Histopathology. Radiology 2020; 296:348–355.
7. Weinreb JC, Barentsz JO, Choyke PL, et al. PI-RADS Prostate Imaging – Reporting and Data System: 2015, Version 2. European Urology 2016; 69:16–40.
8. Holland D, Kuperman JM, Dale AM. Efficient correction of inhomogeneous static magnetic field-induced distortion in Echo Planar Imaging. NeuroImage 2010; 50:175–183.
9. Paquin D, Levy D, Schreibmann E, Xing L. Multiscale Image Registration. Mathematical Biosciences & Engineering 2006; 3:389.
10. Sunoqrot MRS, Nketiah GA, Selnæs KM, Bathen TF, Elschot M. Automated reference tissue normalization of T2-weighted MR images of the prostate using object recognition. Magn Reson Mater Phy 2021; 34:309–321.
11. White NS, Dale AM. Distinct effects of nuclear volume fraction and cell diameter on high b-value diffusion MRI contrast in tumors. Magnetic Resonance in Medicine 2014; 72:1435–1443.
Figures