0817
Ferumoxytol-Enhanced T2* Mapping of Human Placenta with Fetal Growth Restriction1Medical Physics, University of Wisconsin - Madison, Madison, WI, United States, 2GE Global Research, Niskayuna, NY, United States, 3Radiology, University of Wisconsin - Madison, Madison, WI, United States, 4Obstetrics & Gynecology, University of Wisconsin - Madison, Madison, WI, United States, 5Medicine, University of Wisconsin - Madison, Madison, WI, United States, 6Emergency Medicine, University of Wisconsin - Madison, Madison, WI, United States, 7Biomedical Engineering, University of Wisconsin - Madison, Madison, WI, United States, 8Electrical and Computer Engineering, University of Wisconsin - Madison, Madison, WI, United States
Synopsis
Fetal growth restriction (FGR) is associated with placental hypoxia, which can be identified by measuring placental T2* value in-vivo. In this pilot study, we acquired T2* maps in 2 subjects in late pregnancy diagnosed with FGR. Mean and histogram of T2* and R2* values in the placenta were analyzed for two timepoints after administration of ferumoxytol reflecting T2* maps dominated by the presence of the iron nanoparticles and a baseline. We observed lower baseline T2* values than previously reported in healthy controls at similar gestation as well as lower baseline T2* values as reported in FGR patients earlier in gestation.
Introduction
Fetal growth restriction (FGR) is the second highest cause of perinatal mortality and occurs in 5-10 percent of all pregnancies1. One indication of FGR is placental hypoxia originated from placentation deficiencies2; this can potentially be identified using placental baseline T2* value due to its sensitivity to placental oxygenation levels. Previous studies have investigated placental baseline T2* values for gestation ages between 21 to 40 weeks for normal subjects and for 24-31 weeks for subjects with FGR3,4. These studies showed a longitudinal decrease in mean placental T2* with gestation, as well as lower T2* for subjects with severe FGR.Recently, ferumoxytol (Feraheme, AMGA Pharmaceuticals) has been proposed as a potential contrast agent for placental imaging in pre-clinical work5. This iron-based nanoparticle formulation is FDA-approved to treat anemia and used as such during pregnancy. In MRI studies, it has been used as an off-label contrast agent which has been shown to have no detectable risk to the mother or fetus for non-human primates6, does not cross the fetal-maternal interface6, and has shown good safety profiles when used for pulmonary angiograms in pregnant patients7.
Methods
In this IRB approved study and with FDA-IND in place, two human subjects (maternal age = 34yr, 35yr; weight = 95 kg, 73 kg; GA = 35w2d, 35w0d) diagnosed with fetal growth restriction were imaged after providing informed consent. 255 mg Ferumoxytol (corresponding to 2.7 and 3.5 mg/kg respectively) was diluted in 50 ml saline for an intravenous infusion administered over 30 mins followed by a subsequent resting period, all with maternal and fetal monitoring in the obstetrics triage unit. MRI data (scan 1) were collected 3-4 hours later. The MRI protocol was repeated (scan 2) 3 to 4 days later, at which ferumoxytol was assumed to have cleared the placenta based on preclinical data8.MRI scans were acquired on a wide-bore 1.5T clinical MRI scanner (Optima MR 450w, GE Healthcare) with a 48-channel phased-array coil. Subjects were imaged in supine position. T2* mapping was achieved with a respiratory-gated, 3D multi-echo spoiled gradient echo sequence: flip angle=9°, TR=13.6 ms, number of echos = 16, TE1/ΔTE = 1.2/2.6 ms, FOV = 42x38x14 cm3, resolution = 2.2x2.0x3.0 mm3, scan time = 134.7 s.
T1-weighted anatomic images and T2* maps of each scan were reconstructed using monoexponential fit of the complex multi-echo images. Placental segmentation was conducted with ITK-SNAP9. In addition, a single circular muscle ROI in the gluteus region was drawn to investigate the consistency of T2* measures across scans.
Results
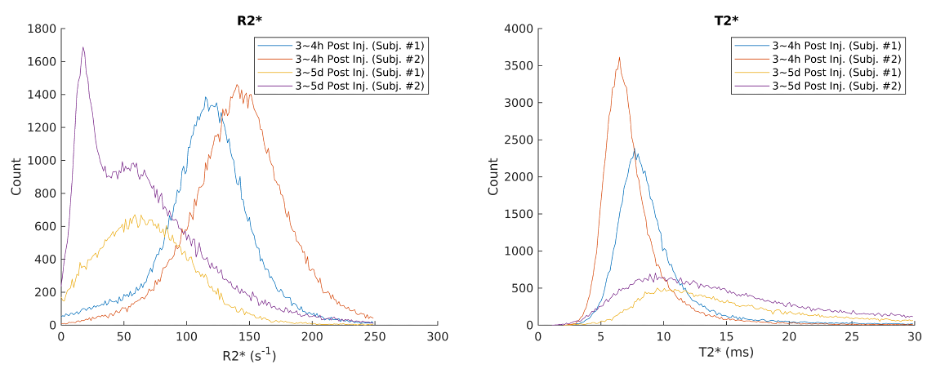
Figure 1 shows water maps, corresponding R2* maps (R2*=1/T2*), and placenta segmentations at the two timepoints. Figure 2 shows 3 non-consecutive slices of R2* maps for scans 1 and 2. Table 1 shows mean R2* and T2* measurements for the two subjects. Table 2 shows muscle ROI measurements that demonstrates muscle T2* stability between timepoints. Figure 4 shows histograms of pixel-wise placental R2* and T2* values of the two subjects. We observe a spread of T2* values, suggesting local T2* heterogeneities in the placenta, especially at timepoint 2. T2* histograms show a skewness to the left for all scans, whereas R1* histograms show different trends depending on the subject and presence of ferumoxytol.Discussion and Conclusion
This pilot study reports, for the first time, T2* values in human placenta in subjects with FGR in late pregnancy and R2* maps after ferumoxytol infusion. The repeatability of the T2* mapping was established from the stable muscle T2* values across scan dates; they are also in agreement with our measurements of muscle R2* at early gestation10.We observed lower baseline T2* values (scan 2) of 14.5 ms and 14.2 ms in our FGR patients compared to normal subjects around the same gestation age in relevant studies11-13. Our baseline T2* is also lower compared to FGR patients of earlier gestation age of 24 to 31 weeks3. Similarly, our baseline R2* measurements of 70.0 s-1 and 66.1 s-1 are higher than the measurements reported at mean gestation of 29 weeks4. Both results are in line with results from multiple longitudinal studies11-13 showing a decrease in mean T2* with gestation. Histograms of T2* values that show skewness to the left, which is consistent with our measurements of early gestation subjects10.
Limitations of this study include lack of voxel-wise comparisons between T2* values at the two timepoints, which require sophisticated elastic registrations. Additionally, our approved protocols do not allow for the administration of ferumoxytol in the scanner or an additional baseline scan session prior to infusion. Future studies of interest include regional comparisons of T2* signal variations with oxygenation and pathology, perfusion measurements, and longitudinal studies for early detection of placental abnormalities that predict complications such as FGR.
Acknowledgements
We gratefully acknowledge GE Healthcare for research support of UW-Madison, and funding support from NIH U01-HD087216, NIH R01 HD103443, UW-Madison Dept. of Radiology R&D Fund, and UW-Madison Dept. of Obstetrics and Gynecology R&D Fund. Ferumoxytol for the study was donated by AMAG Corp., MA after NIH funds were awarded.References
[1] Nardozza LM, Caetano AC, Zamarian AC, Mazzola JB, Silva CP, Marçal VM, Lobo TF, Peixoto AB, Araujo Júnior E. Fetal growth restriction: current knowledge. Arch Gynecol Obstet. 2017 May;295(5):1061-1077. doi: 10.1007/s00404-017-4341-9. Epub 2017 Mar 11. PMID: 28285426.
[2] Figueras F, Caradeux J, Crispi F, Eixarch E, Peguero A, Gratacos E. Diagnosis and surveillance of late-onset fetal growth restriction. Am J Obstet Gynecol. 2018 Feb;218(2S):S790-S802.e1. doi: 10.1016/j.ajog.2017.12.003. PMID: 29422212.
[3] Sinding M, Peters DA, Frøkjaer JB, Christiansen OB, Petersen A, Uldbjerg N, Sørensen A. Placental magnetic resonance imaging T2* measurements in normal pregnancies and in those complicated by fetal growth restriction. Ultrasound Obstet Gynecol. 2016 Jun;47(6):748-54. doi: 10.1002/uog.14917. PMID: 26041014.
[4] Ingram E, Morris D, Naish J, Myers J, Johnstone E. MR Imaging Measurements of Altered Placental Oxygenation in Pregnancies Complicated by Fetal Growth Restriction. Radiology. 2017 Dec;285(3):953-960. doi: 10.1148/radiol.2017162385. Epub 2017 Jul 14. PMID: 28708473.
[5] Ludwig KD, Fain SB, Nguyen SM, Golos TG, Reeder SB, Bird IM, Shah DM, Wieben OE, Johnson KM. Perfusion of the placenta assessed using arterial spin labeling and ferumoxytol dynamic contrast enhanced magnetic resonance imaging in the rhesus macaque. Magn Reson Med. 2019 Mar;81(3):1964-1978. doi: 10.1002/mrm.27548.
Epub 2018 Oct 25. PMID: 30357902; PMCID: PMC6715150.
[6] Nguyen SM, Wiepz GJ, Schotzko M, Simmons HA, Mejia A, Ludwig KD, Zhu A, Brunner K, Hernando D, Reeder SB, Wieben O, Johnson K, Shah D, Golos TG. Impact of ferumoxytol magnetic resonance imaging on the rhesus macaque maternal-fetal interface†. Biol Reprod. 2020 Feb 14;102(2):434-444. doi: 10.1093/biolre/ioz181. PMID: 31511859; PMCID: PMC7016288.
[7] Starekova J., Nagle SK, Schiebler ML, Reeder SB, and Meduri VN. Ferumoxytol-Enhanced Pulmonary MRA in Pregnancy: Evaluation of Initial Safety and Image Quality. Proc. Intl. Soc. Mag. Reson. Med. 29 (2021)
[8] Zhu A, Reeder SB, Johnson KM, et al. Quantitative ferumoxytol-enhanced MRI in pregnancy: A feasibility study in the nonhuman primate. Magn Reson Imaging. 2020;65:100-108. doi:10.1016/j.mri.2019.10.006
[9] Brian BA, Nicholas JT, Gang S, et al. A Unified Image Registration Framework for ITK.
Proceedings of the Fifth Workshop on Biomedical Image Registration 2012:266-275.
[10] Chen R, Zhu A, Starekova J, Batan T, Seiter D, Johnson KM, Reeder SB, Shah DM, Wieben O, Hernando D. Longitudinal Study on Early Gestation BOLD effect in Human Placenta with Maternal Obesity and Gestational Complications. In: Proc 29th Annual Meeting ISMRM.;2021
[11] Sørensen A, Hutter J, Seed M, Grant PE, Gowland P. T2*-weighted placental MRI: basic research tool or emerging clinical test for placental dysfunction? Ultrasound Obstet Gynecol. 2020 Mar;55(3):293-302. doi: 10.1002/uog.20855. PMID: 31452271.
[12] Hutter J, Slator PJ, Jackson L, Gomes ADS, Ho A, Story L, O'Muircheartaigh J, Teixeira RPAG, Chappell LC, Alexander DC, Rutherford MA, Hajnal JV. Multi-modal functional MRI to explore placental function over gestation. Magn Reson Med. 2019 Feb;81(2):1191-1204. doi: 10.1002/mrm.27447. Epub 2018 Sep 21. PMID: 30242899; PMCID: PMC6585747.
[13] Hutter J, Jackson L, Ho A et al. T2* relaxometry to characterize normal placental development over gestation in-vivo at 3T [version 1; peer review: 1 approved, 1 approved with reservations]. Wellcome Open Res 2019, 4:166
Figures
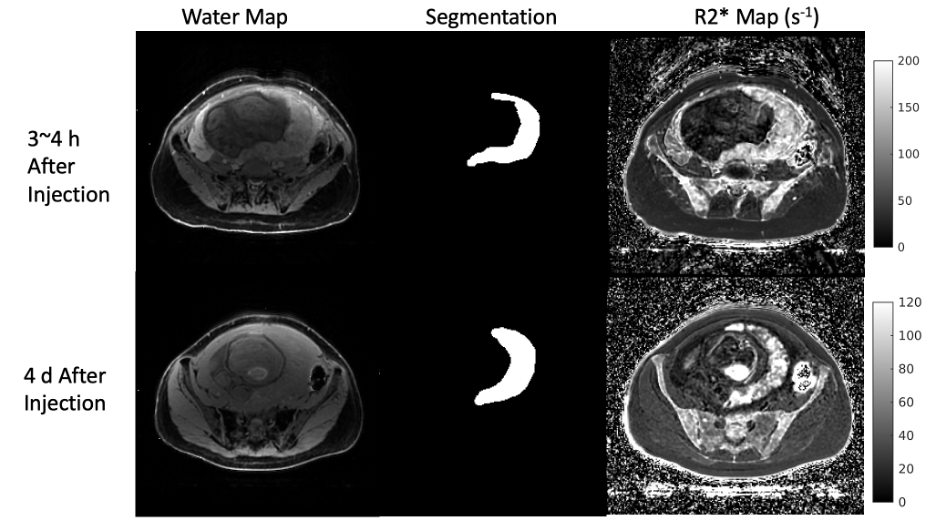
Figure 1. (Left to right) A slice of the water map used for segmentation, corresponding segmentation for that slice, and R2* maps (s-1), 3~4 h after contrast injection (top row) and ~96 h after contrast injection (bottom row). All images are from the same subject, although top and bottom row are not showing the exact same slice position of the subject. The grayscale on the right side of the figure is for the R2* maps only.
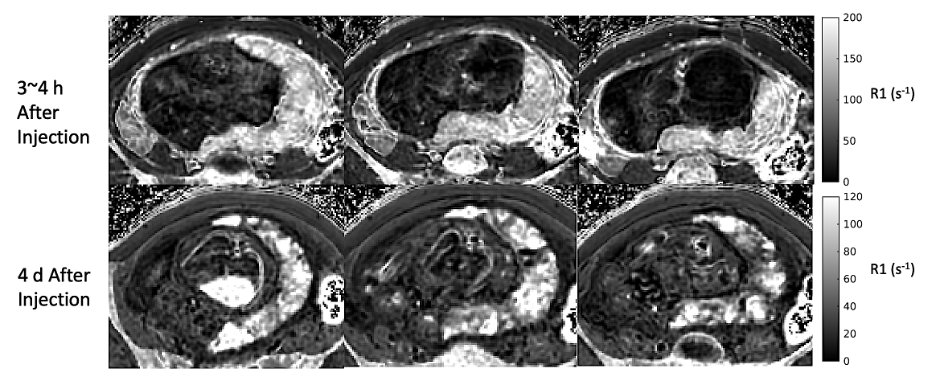
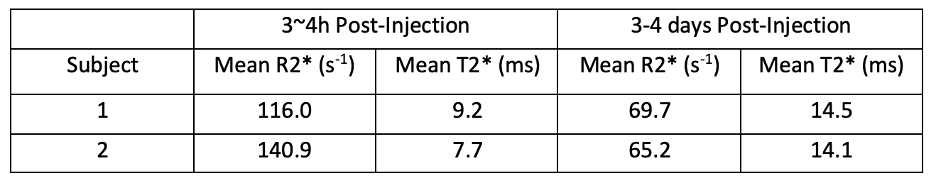
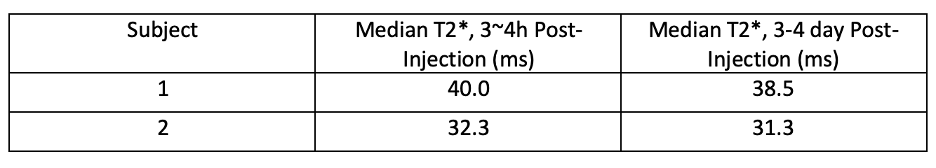
Table 2. Median muscle T2* values of the two subjects at two timepoints after Ferumoxytol injection. The muscle T2* is measured from a ROI drawn on each subject’s gluteus muscle. Although each subject has slightly different muscular T2*, there is consistency between T2* measurements between the two post-injection time points, showing repeatability of our scans.