0814
Multi-modal MRI reveals changes in placental function following preterm premature rupture of membranes
Andrew Melbourne1, Carla Avena Zampieri1, Dimitra Flouri1, Joseph V Hajnal1, Anna David2, Mary A Rutherford1, Jana Hutter3, and Lisa Story4
1Centre for Medical Engineering, King's College London, London, United Kingdom, 2University College London, London, United Kingdom, 3King's College London, London, United Kingdom, 4Women's Health, King's College London, London, United Kingdom
1Centre for Medical Engineering, King's College London, London, United Kingdom, 2University College London, London, United Kingdom, 3King's College London, London, United Kingdom, 4Women's Health, King's College London, London, United Kingdom
Synopsis
Preterm premature rupture of membranes (PPROM) complicates up to 40% of deliveries less than 37 completed weeks gestation. Absence of clinical symptoms means that fetal infection can be missed and later complications are significantly higher. There is thus a real need for non-invasive antenatal assessment of the early signs of placental inflammation. This study combines an efficient multimodal Diffusion-Relaxation acquisition with dedicated analysis to study the placental phenotype associated with PPROM. Initial results indicate that multi-modal MRI measurement of placental function is linked to eventual gestational age at delivery.
Introduction
Preterm premature rupture of membranes (PPROM) complicates up to 40% of deliveries less than 37 completed weeks gestation [1,2]. Neonatal morbidity, including sepsis, cystic periventricular leukomalacia, intraventricular hemorrhage, and later development of cerebral palsy, are significantly higher among pregnancies with PPROM complicated by infection and linked to chorioamnionitis measured in the placenta after delivery [3]. Infection can occur in the fetus in the absence of clinical signs in the mother and is thus often only identified in histopathological analysis after delivery. This retrospective diagnosis limits timely antenatal intervention such as administration of corticosteroids, early delivery or in utero transfer to a specialist medical centre.There is therefore a need for non-invasive antenatal assessment of early signs of placental inflammation. Multi-modal MRI techniques, allowing the assessment of the structural and functional properties of the tissue can thus play a crucial role in contributing to discriminate between acute and chronic phases of inflammation in vivo. Placental MRI including diffusion and relaxometry techniques have been successfully used in fetal growth restriction [6] and preeclampsia [4,5] revealing distinct structural and functional phenotypes. This study combines an efficient multimodal T2*-Diffusion acquisition with dedicated analysis using the DECIDE [7] model to study differences in placentas affected by PPROM.Methods
21 women with PPROM cases were recruited for this study and scanned in supine position on a 3T Philips Achieva scanner using a cardiac 32-channel coil. A multi-modal T2*-Diffusion technique sampling 4 echo times and 64 diffusion preparations between b=0 and b=1200 [5] (see Fig 1a) was employed (resolution 3mm isotropic, coronal acquisition plane, total acquisition time 8:30). The data was analysed using in-house software developed in Matlab. The modelling combines T2 relaxometry and diffusion-weighting data to estimate multi-compartment diffusivity and relaxation rates to estimate a voxel-wise fit of fetal (f) and maternal (v) perfusion, and feto-placental blood saturation [7]. As used previously [6], we define the Placental Function Index (PFI) describing the fraction of placental tissue with feto-placental blood oxygen saturation >60% (P60). This marker is intrinsically linked to the fraction of well-functioning tissue in the placenta.Figure 2a illustrates the acquisition scheme overlaid on the estimated signal decay strength at 3T. An example decay curve is shown in Figure 2b.Results
Example parametric maps for one case are shown in Figure 3 (three adjacent slices from the 3D segmentation). Placentas are segmented manually and model-fitting results shown. Histograms of parameter distributions are shown beneath each column. Smooth parametric distributions are seen for most parameters with larger fitting variability seen for the d* and v parameters. Oxygen saturation maps are shown in the final column.Relationships across the cohort are shown in Figure 4. Figure 4a is a graphical representation of the data for each subject during gestation. Red lines mark the time between GA at rupture and delivery. Blue dots mark the GA at MRI scan with size representing the birthweight of the foetus. Figure 4b shows the relationship between GA at delivery and duration of PPROM. We find no correlation between these measures despite late GAB at delivery theoretically linking to longer ROM duration. Figure 4c shows a significant correlation between the P60 marker of whole placental function and Duration of PPROM. This is illustrated further in Figure 4d, to show how this relationship varies with gestational age.Conclusion
Data was successfully acquired in a challenging group of patients and analysis revealed the first correlations between quantitative modal results and the time between rupture of the membranes and delivery. This combination of efficient data acquisition and multi-compartmental modelling has the potential to reveal longitudinal changes in placental function during progression and monitor impact of inflammation and infection on function at lobular level [8]. Future work will link to other longitudinal ultrasound and serum markers to further enhance information about these pregnancies, and hopefully further optimise deliveryAcknowledgements
This work was supported by supported by the Wellcome Trust (210182/Z/18/Z, 101957/Z/13/Z, 203148/Z/16/Z) and the EPSRC (NS/A000027/1), the NIH Human Placenta Project grant 1U01HD087202-01 (Placenta Imaging Project (PIP)), Wellcome Trust Collaboration in Science grant [WT201526/Z/16/Z], a Sir Henry Wellcome Fellowship, a UKRI FL fellowship and by core funding from the Wellcome/EPSRC Centre for Medical Engineering [WT203148/Z/16/Z] and by the National Institute for Health Research (NIHR) Biomedical Research Centre based at Guy’s and St Thomas’ NHS Foundation Trust and King’s College London and/or the NIHR Clinical Research Facility. The views expressed are those of the author(s) and not necessarily those of the NHS, the NIHR or the Department of Health and Social Care.References
[1] Nasef N, et al. Effect of clinical and histological chorioamnionitis on the outcome of preterm infants. Am J Perinatol. 2013;30(1):59-68.[2] Morris JM, et al. Immediate delivery compared with expectant management after preterm pre-labour rupture of the membranes close to term (PPROMT trial): a randomised controlled trial. Lancet 2016;387:444–52.[3] Ramsey PS, et al., Chorioamnionitis increases neonatal morbidity in pregnancies complicated by preterm premature rupture of membranes. Am J Obstet Gynecol 2005; 192:1162-6.[4] Ho, AEP, et al T2* Placental Magnetic Resonance Imaging in Preterm Preeclampsia, An Observational Cohort Study, Hypertension. 2020;75:1523–1531[5] Slator, Paddy J. et al. “Placenta Microstructure and Microcirculation Imaging with Diffusion MRI.” Magnetic Resonance in Medicine 80(2): 2018, 756–66.[6] Aughwane, Rosalind et al. “MRI Measurement of Placental Perfusion and Oxygen Saturation in Early Onset Fetal Growth Restriction.” BJOG: An International Journal of Obstetrics & Gynaecology 2020, 128(2): 337–45. [7] Melbourne, Andrew et al. “Separating Fetal and Maternal Placenta Circulations Using Multiparametric MRI.” Magnetic resonance in medicine 2019, 81(1): 350–61.[8] Melbourne, Andrew. “On the Use of Multicompartment Models of Diffusion and Relaxation for Placental Imaging.” Placenta 2021, 112: 197–203.Figures
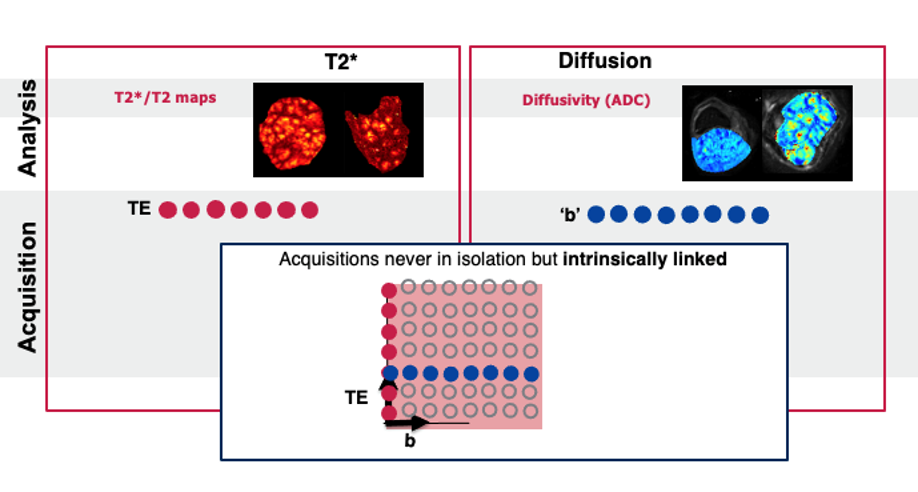
Figure 1: Schematic illustration of recently used placental diffusion and T2* relaxometry.
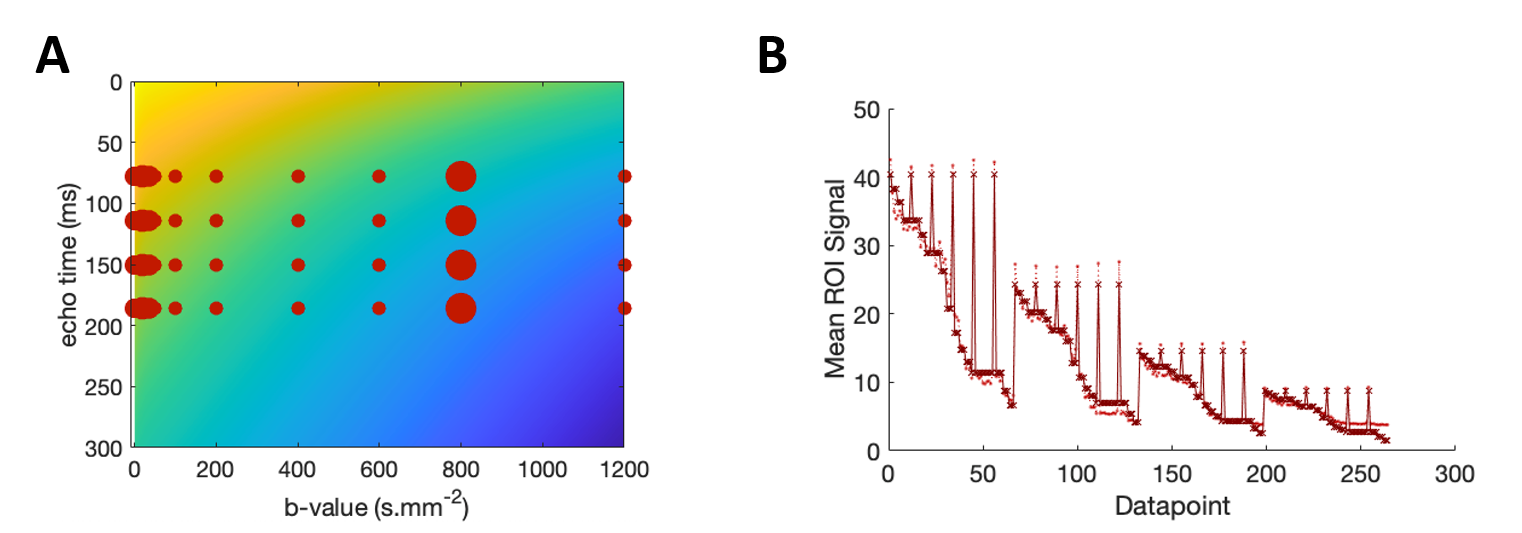
Figure 2: (a) illustration of the sampled parameters in the 2D parameter space between b-value and echo time. (b) signal evolution over all acquired data points.
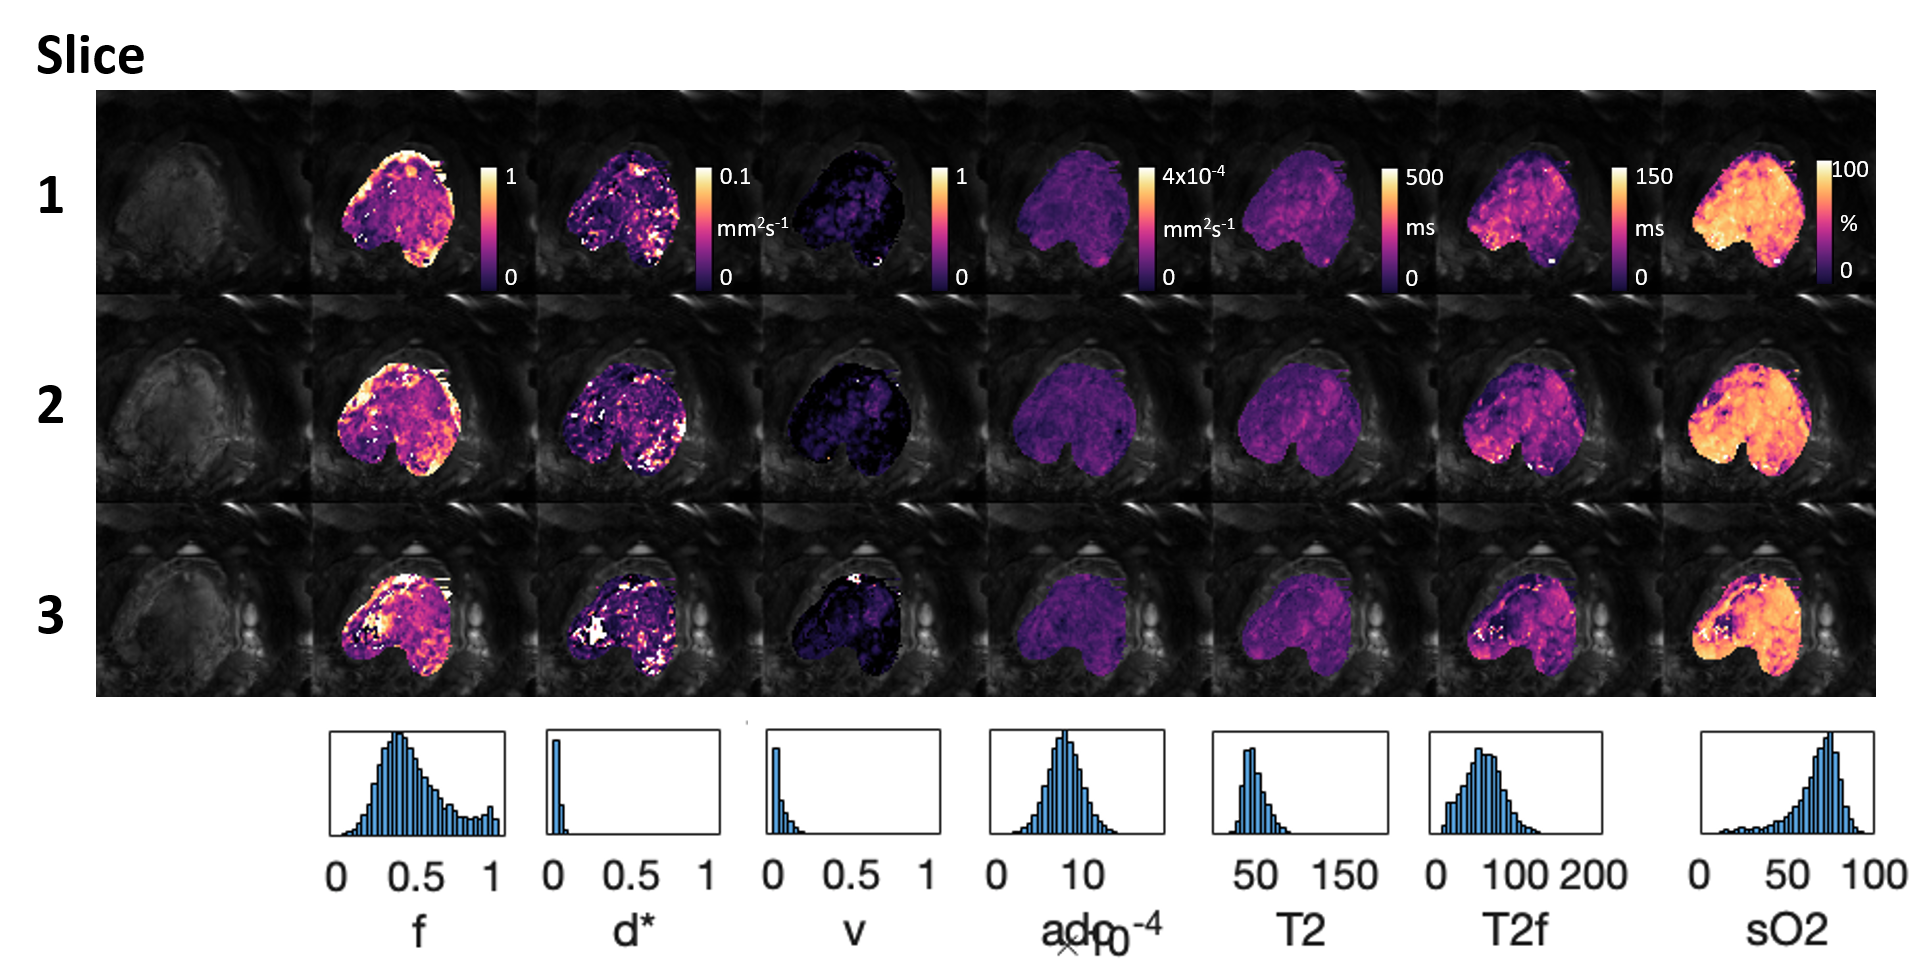
Figure 3: quantitative maps obtained using the DECIDE model, displaying (from left to right) a raw b=0 image,the tissue fraction, d*, v, adc, T2*, feta T2* and the estimated oxygen saturation.
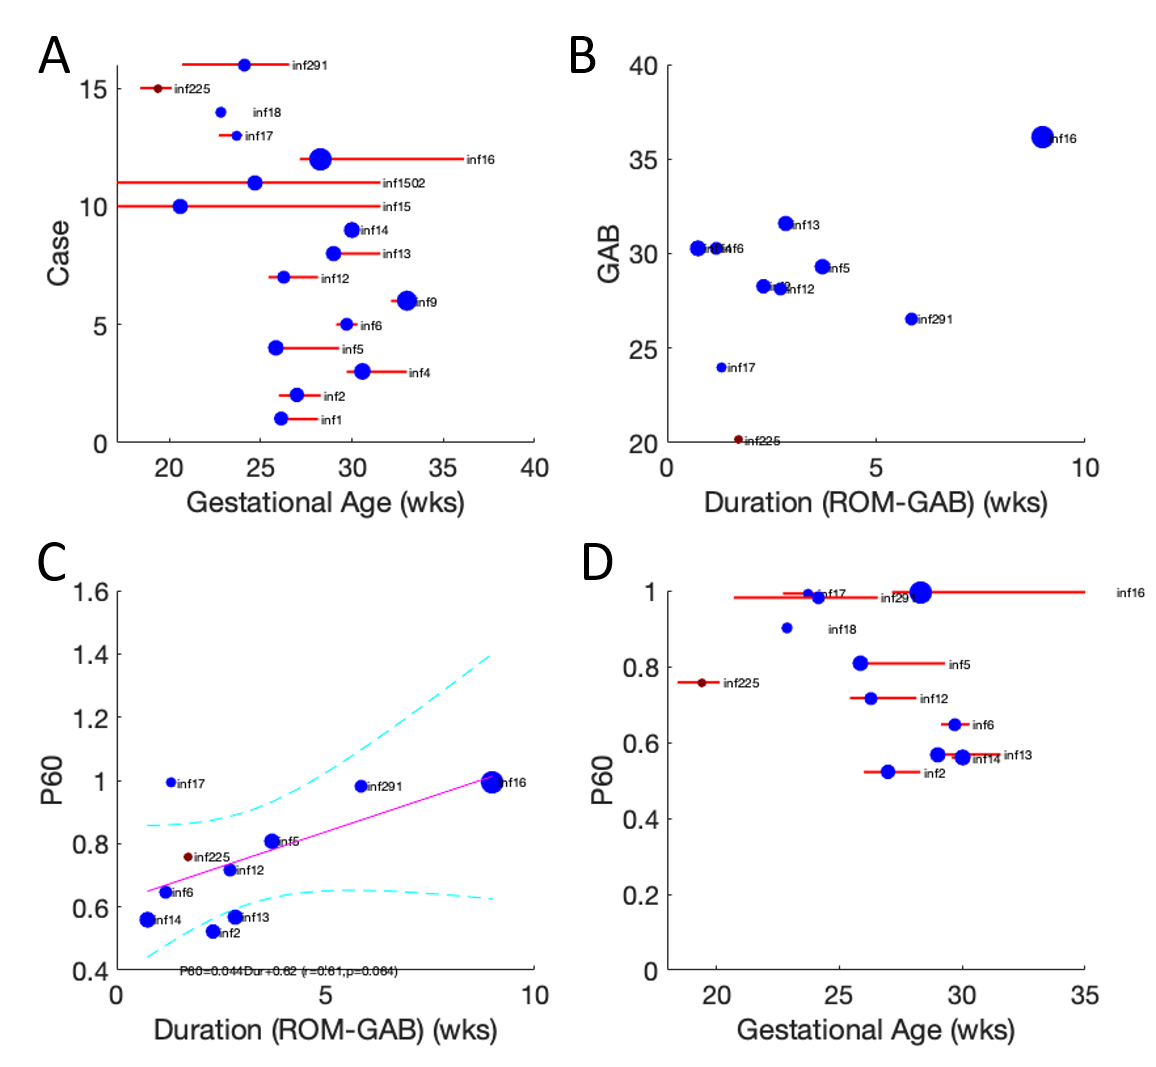
Figure 4: Upper left: The time between rupture of the membranes (ROM) and delivery is illustrated with a red line for all considered cases and the time point of the MRI scan with a blue dot. Upper right: the duration between ROM and the delivery is displayed against the GA at the time of delivery. Lower row: the placental function marker P60 is displayed against the duration between rupture of the membranes and delivery (left) and against the GA at birth (right).
DOI: https://doi.org/10.58530/2022/0814