0813
Coherent flows detected in placental diffusion weighted data1Sir Peter Mansfield Imaging Centre, The University of Nottingham, Nottingham, United Kingdom, 2Department of Child Health, Obstetrics and Gynaecology, School of Medicine, The University of Nottingham, Nottingham, United Kingdom, 3School of Life Sciences, The University of Nottingham, Nottingham, United Kingdom
Synopsis
Diffusion weighted imaging is commonly used in the placenta to characterise regions of differing structure and flow, including differences between the healthy and compromised placenta. Typically placental diffusion data is described by a combination of exponential decays with increasing diffusion weighting, but we have observed signals that show oscillations in signal or even increasing initial signal and are likely to relate to refocusing caused by coherent flows. By altering our diffusion fitting we can access information about flow patterns and provide more information regarding placental haemodynamics.
Introduction
Diffusion weighted imaging is commonly used in the placenta to characterise regions of differing structure and flow, including differences between the healthy and compromised placenta1. Typically, placental diffusion data is described by a combination of exponential decays with increasing diffusion weighting (b values), but we have observed signal decays that cannot be described as the sum of exponential decays but instead show oscillations in signal or even increasing initial signal and are likely to relate to refocusing caused by coherent flows2. This abstract aims to identify, characterise, and compare regions of refocused flow across both healthy and compromised placentas.Theory
Different types of motion will cause different signal decays with increasing ‘diffusion’ weighting in the pulse gradient spin echo (PGSE) sequence (fig 1a).- Simple diffusion leads to exponential decay $$$S = S_0e^{-bD}$$$ Eq1
- IVIM: Intravoxel incoherent motion (effective diffusion like motion on two length scales) leads to biexponential decay $$$S=S_0[(1-f_{ivim})e^{-bD}+f_{ivim}e^{-bD*}]$$$ Eq2 (fit in Fig 2B)
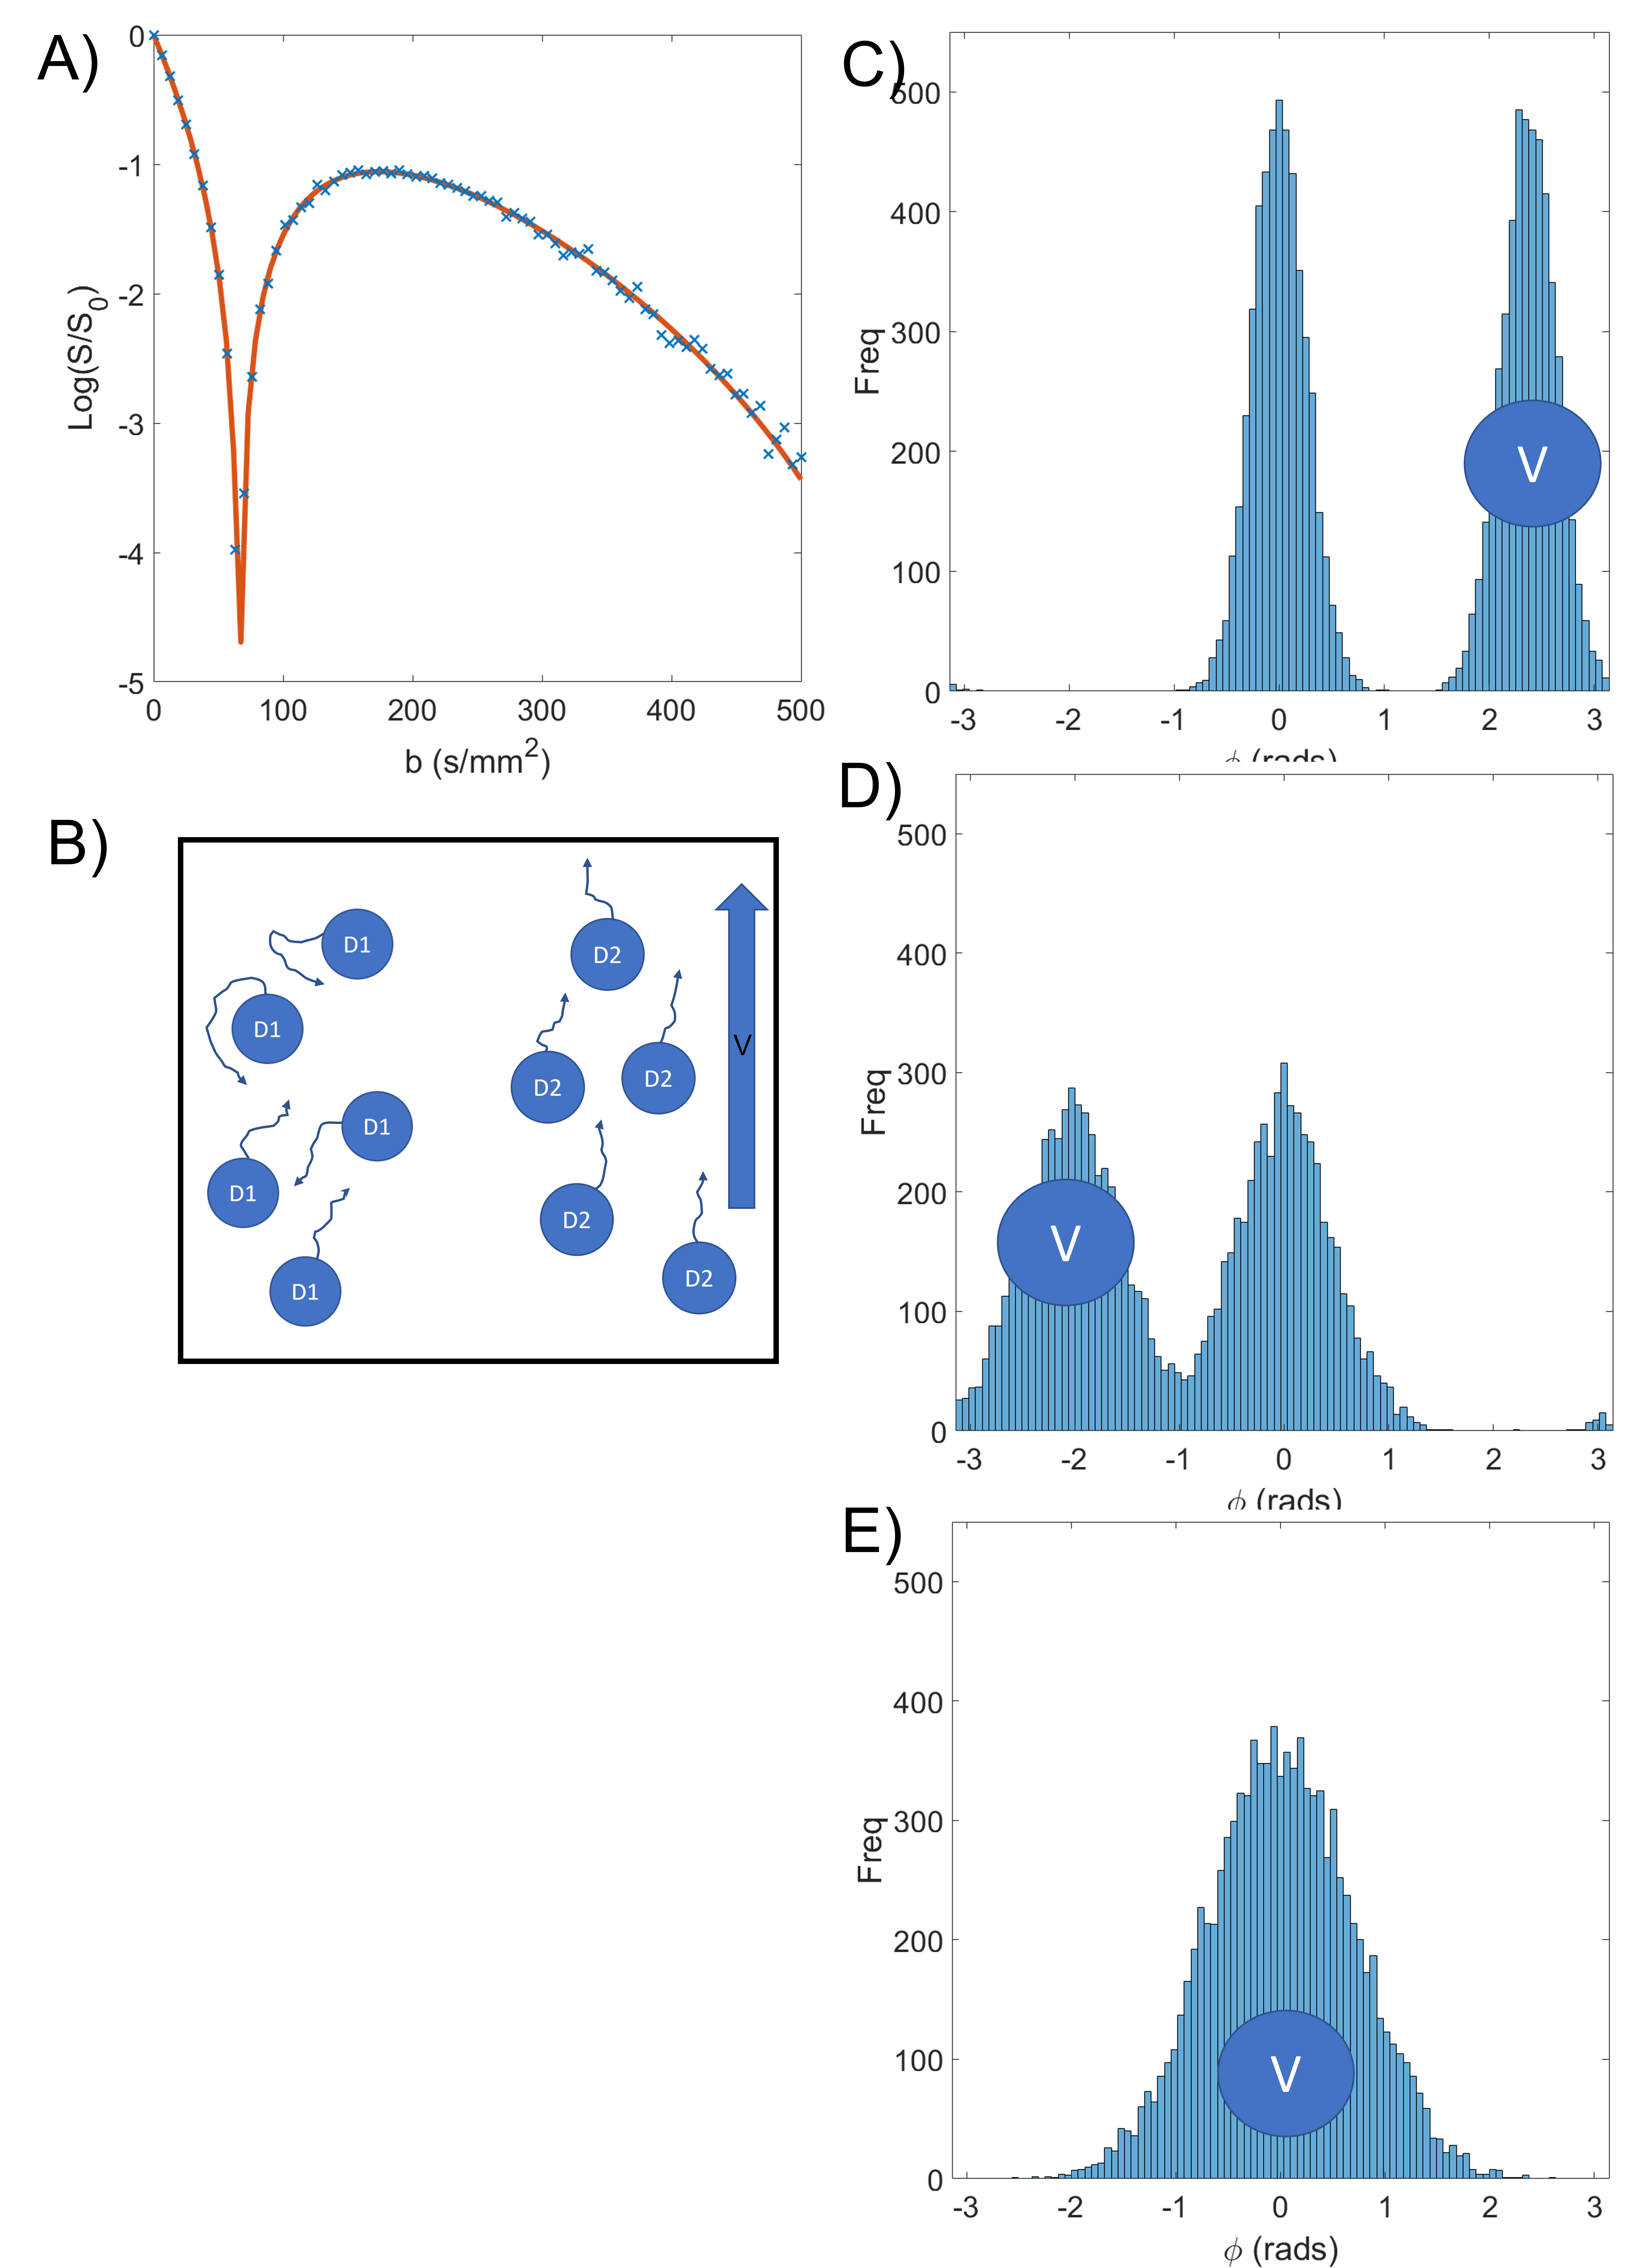
- Rephasing: The combination of spatially varying coherent
motion and diffusion in a voxel will lead to rephasing of the signal with
b-value[2]: $$$S=S_0[(1-f)e^{-bD} + f|cos(cv')|e^{-bD*}]$$$ Eq3, where $$$ c = \gamma G \Delta \delta $$$ and v' is related to the net velocity. This
was simulated in 1D with N = 10000 spins diffusing at mm2/s, and 5000 of the spins also
having coherent velocity of 2 mm/s in the direction of the gradient. The position $$$\textbf{r}(t)$$$ of each spin was updated every $$$ \Delta t = 1\mu s$$$and the phase at timepoint $$$t_n$$$ was calculated as $$$\phi_{t_n}=\phi_{t_n -1}+\textbf{G}(t)\textbf{r}(t)\Delta t$$$, with the final signal being $$$S = \sum\limits_{n=1}^Ne^{-i \phi _n}$$$.(Figure 3 and fit in Fig 2c)
Method
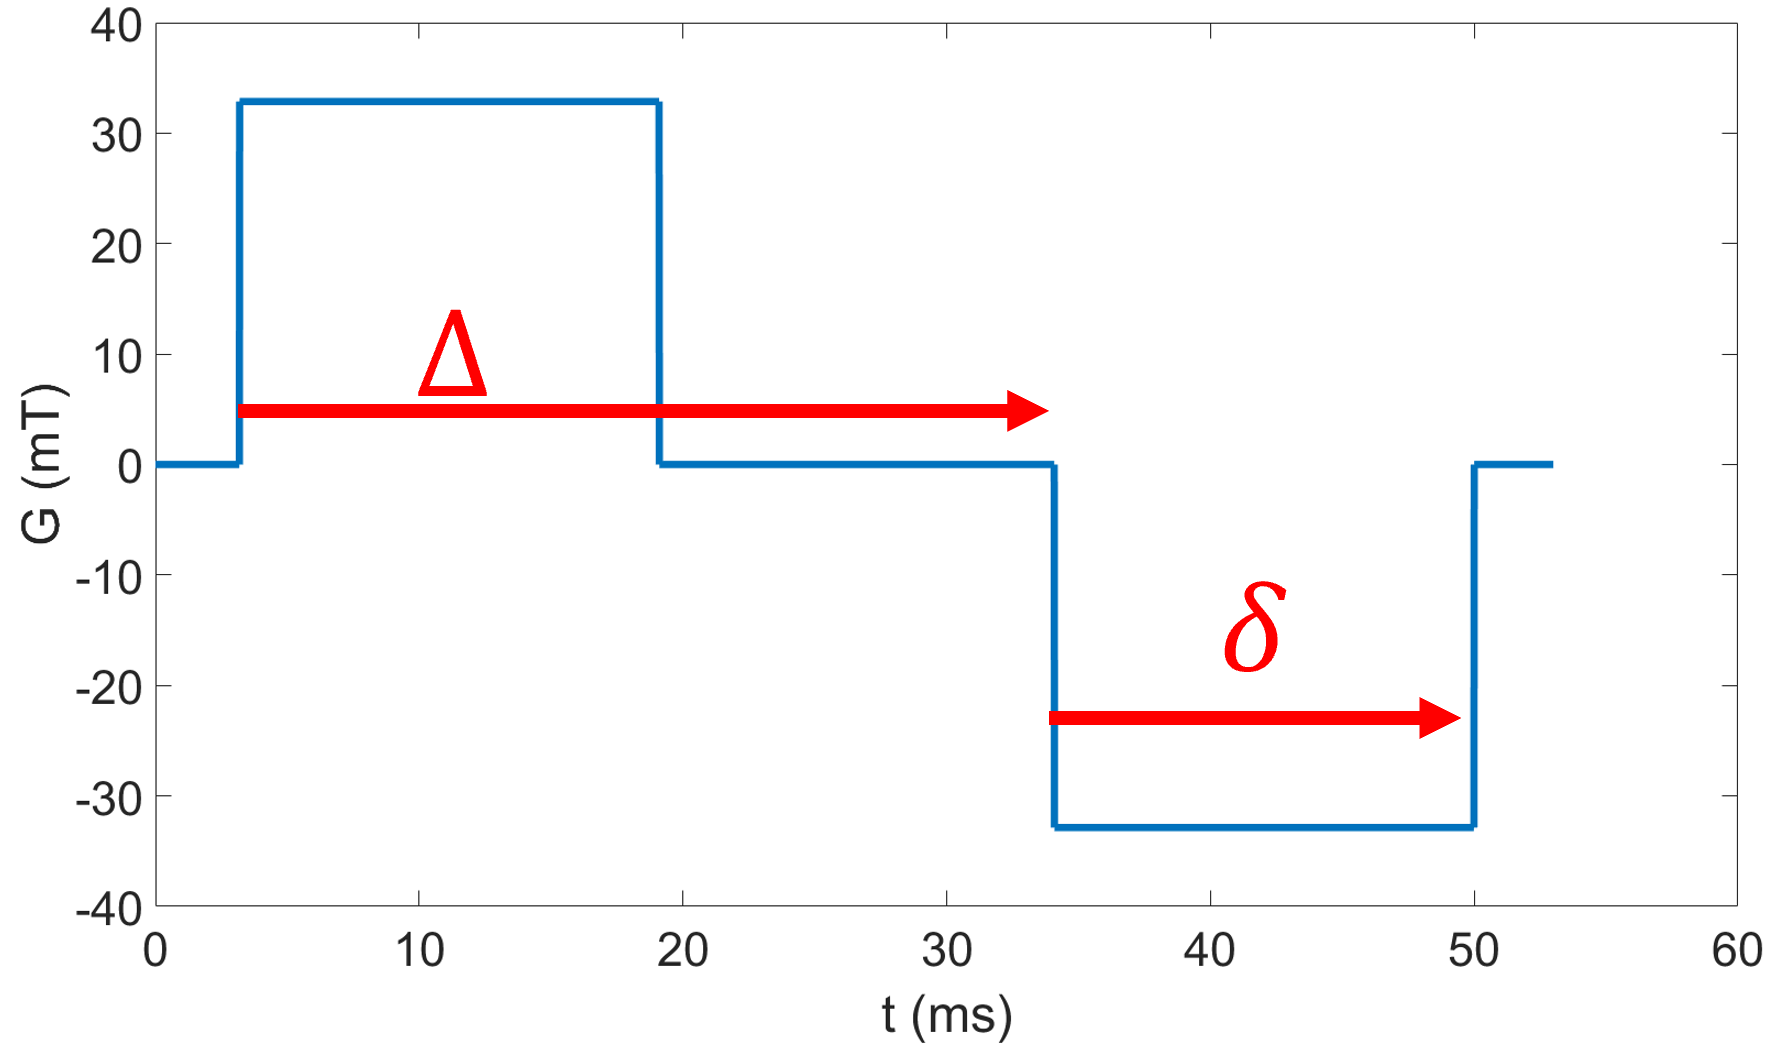
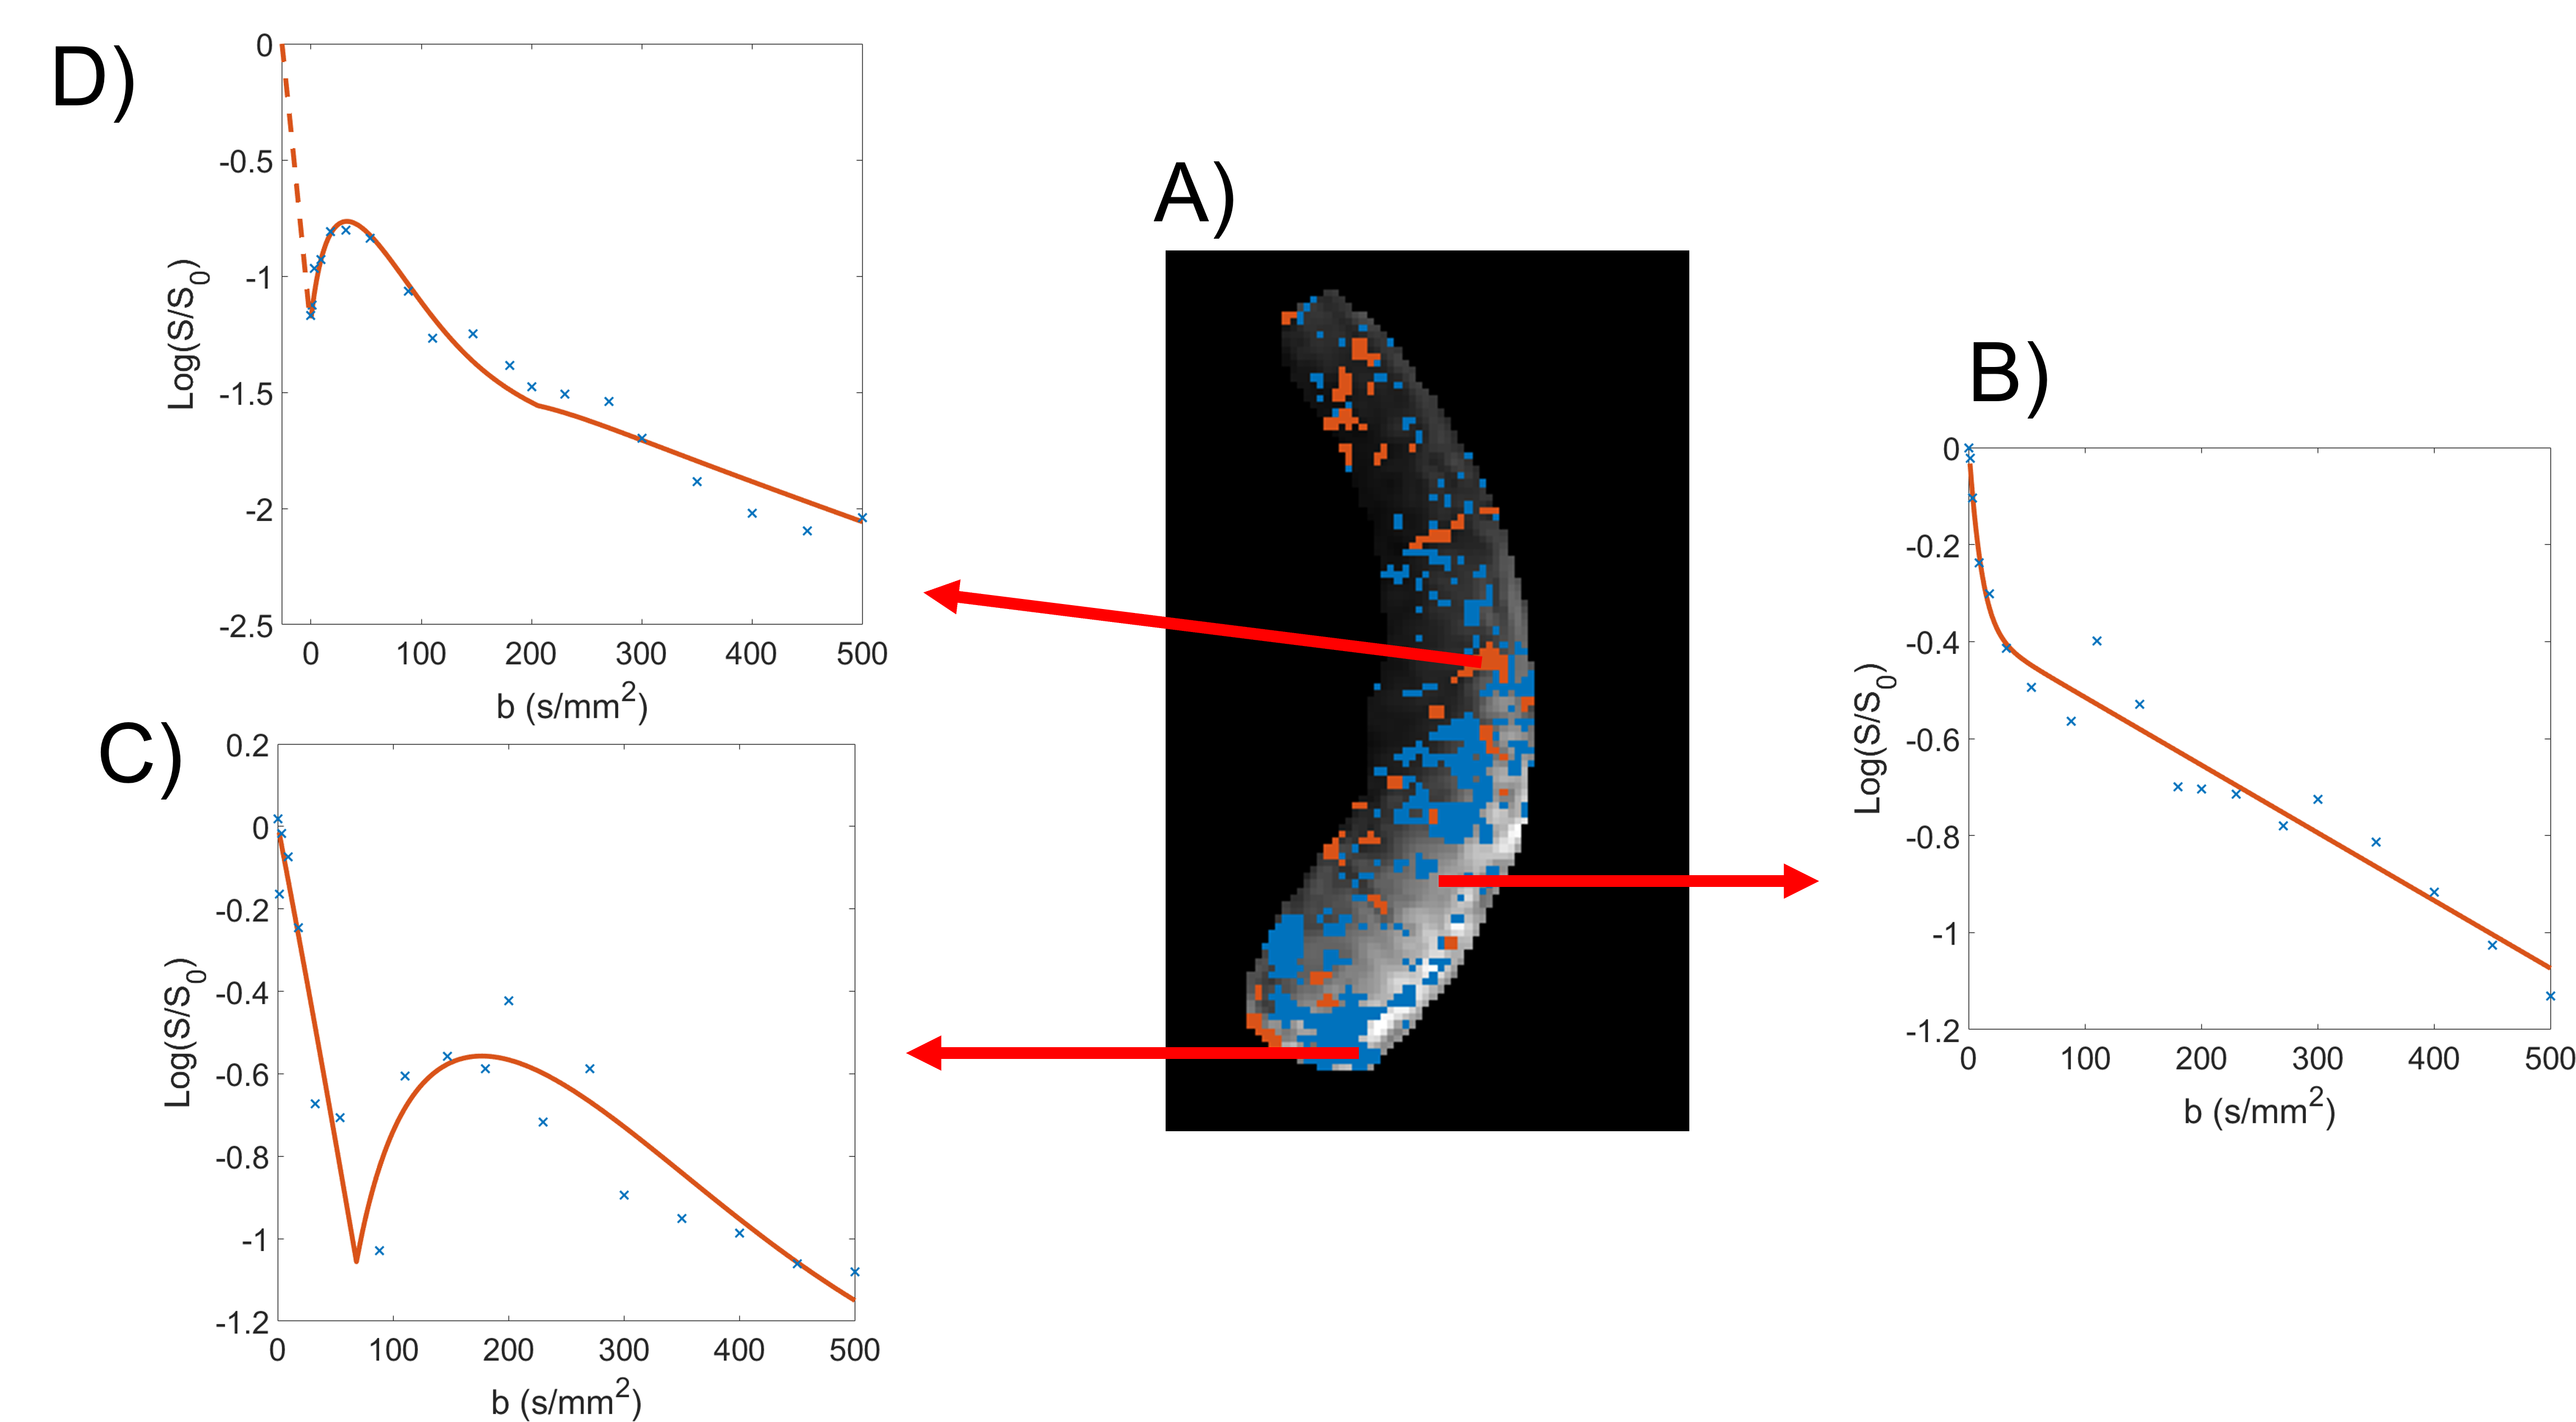
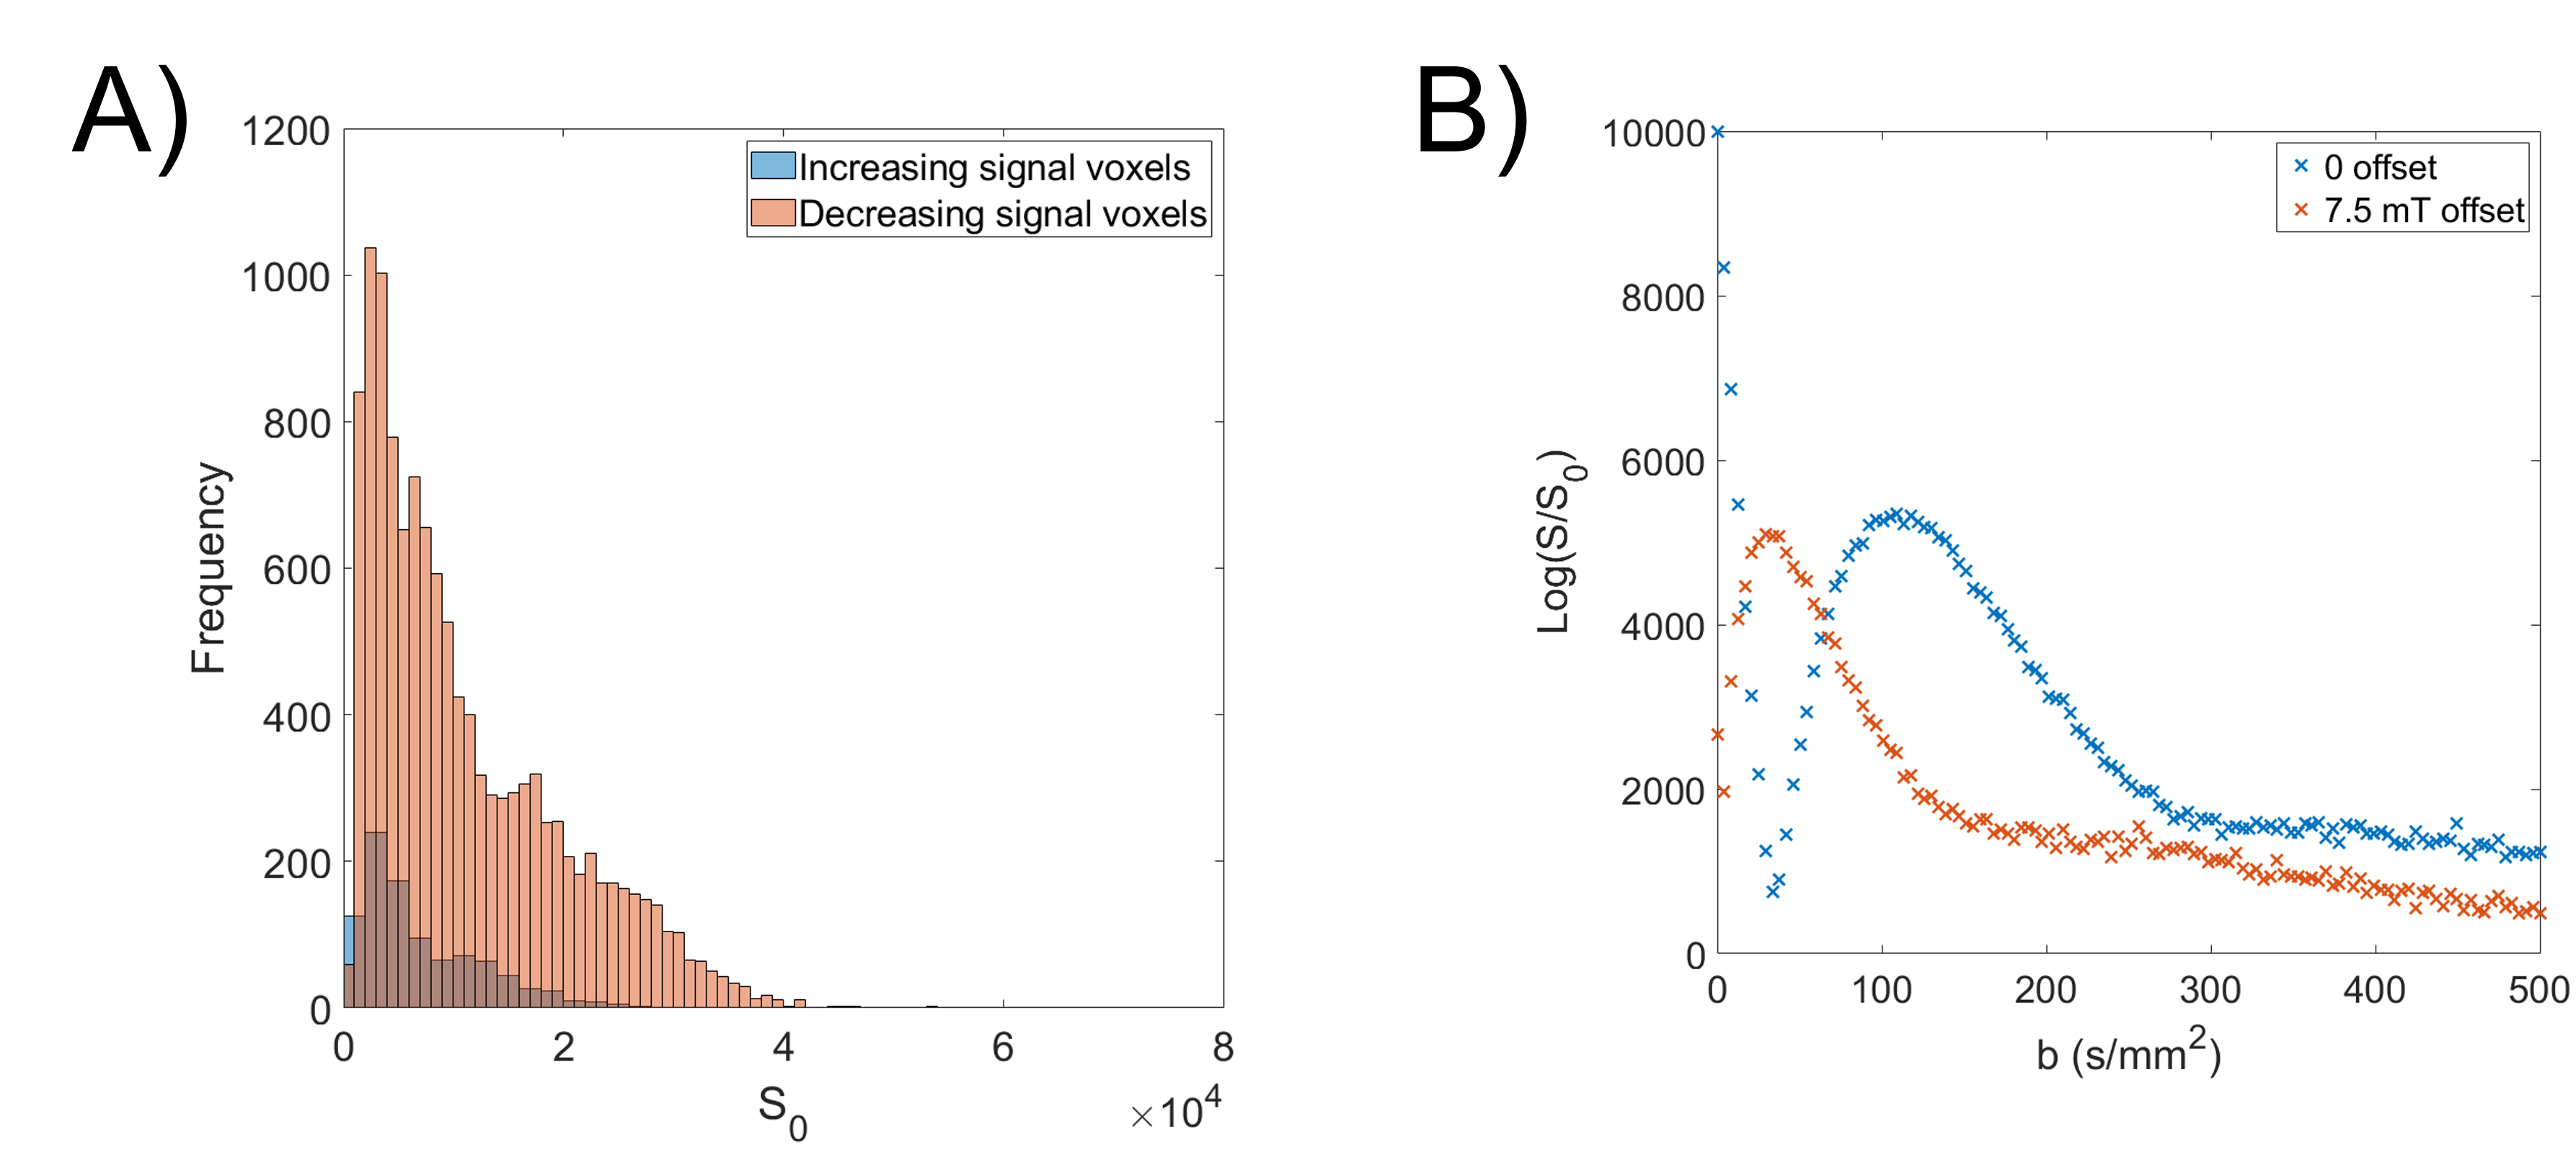
A respiratory gated PGSE-EPI sequence was used to acquire data on a 3T Philips Ingenia system at 19 b-values (0-500 s/mm2), $$$\delta$$$=19.6ms, $$$\Delta$$$=30.9ms (figure 1A). 22 women gave informed consent to participate in the study which was approved by the local ethics committee. 13 Women had apparently healthy pregnancies (HP), and 9 were compromised (2 preeclampsic, 4 preeclampsic and fetal growth restriction, 2 fetal growth restriction).It was observed that some voxels showed increasing initial signal (IIS) at low b value (fig 2d). To identify these data was smoothed using a centred moving mean filter of window size 5. Any voxel in which the signal peaked between b=9 s/mm2 and b = 180 s/mm2 were classified as IIS voxels and omitted from other fits. The signal in these voxels and the rest of the placenta was compared for b = 0 s/mm2 using a t-test.
The placenta was masked by hand on the b=0 image and volumes which were corrupted by fetal or maternal motion were discarded. Data was initially fitted to Eq 1 to determine starting values for subsequent fits. Next all voxels were fitted to a conventional IVIM model (Eq 2) with parameters limited to plausible biological values figure 2b. Finally, data was fitted to Eq 3 figure 2c, and fits to Eq2 and Eq 3 were compared using an F-test: if rephased model (Eq3) performed significantly (p<0.05) better than the IVIM model (Eq2), the voxel was flagged as rephasing.
To compare between the HP and CP groups the fraction of the placenta represented by each decay type was compared, and the fraction of voxels in each group was compared with a 2-tailed t-test.
Results
Figure 2A shows a placental map indicating regions fitting each model, and example voxel-wise fits are shown in Figure 2B-D.Figure 4A is an example of the voxel intensities at b=0 for a single participant. In every participant the IIS voxels had lower average signal at b=0 (p<0.05, maximum p = 0.01).
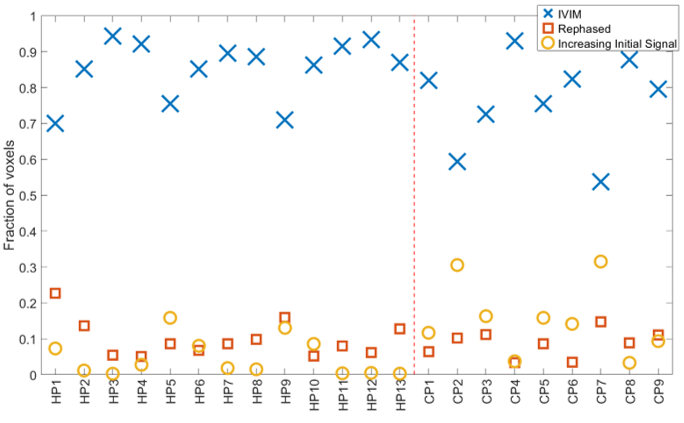
The fraction of each participant’s placenta best characterized by each model is shown in Figure 5. The CP group contained significantly more IIS voxels (p = 0.02) than the HP group, but not different IVIM or rephased voxels (p = 0.08 & p = 0.51 respectively).
Discussion
Figure 2 shows regions corresponding to different models clustered together, suggesting that these effects are related to regional flow within structures within the placenta or uterine wall.The simulations in figure 3 show how spatially varying coherent flow within the placenta can cause additional dephasing, followed by rephasing as the b-value increases. We hypothesise that IIS voxels figure 2D are due to rephased voxels with a constant field offset superimposed on the PGSE gradients. This could be tested in future by reversing the direction of the PGSE gradients. The exact cause of this offset is unclear, but in every participant the ISS signals have lower signal at b = 0 than non-increasing voxels, also indicating some dephasing even with b=0. The increase in ISS effect in the CP group compared to the HP suggests this may be related to inhomogeneous distribution of deoxygenated blood in those placentas[1].
The results here suggest that diffusion imaging in the placenta is more complex than can be described by IVIM. By altering our diffusion fitting we can access more information regarding the rephasing of flow patterns and provide more information about placental haemodynamics. Future work could include probing flow effects by changing gradient timings and directions.
Acknowledgements
This work was supported by the EPSRC-MRC centre for doctoral training and the National Institute of Health Human Placenta Project (HPP): 1U01HD087202-01References
[1] - Dellschaft NS, Hutchinson G, Shah S, Jones NW, Bradley C, et al. (2020) The haemodynamics of the human placenta in utero. PLOS Biology 18(5): e3000676. https://doi.org/10.1371/journal.pbio.3000676
[2] – Le Bihan D, Breton E et al. (1988) Separation of Diffusion and Perfusion in Intravoxel Incoherent Motion MR Imaging. Radiology 168(2):497-505 doi: 10.1148/radiology.168.2.3393671.
Figures