0812
Placental MRI: The effect of maternal breath hold on T2* quantified by multi-echo gradient echo EPI1Fetal-Neonatal Neuroimaging Developmental Science Center, Boston Children's Hospital, Boston, MA, United States, 2Department of Radiology, Cincinnati Children's Hospital Medical Center, Cincinnati, OH, United States, 3Department of Radiology, University of Cincinnati College of Medicine, Cincinnati, OH, United States, 4Maternal-Fetal Medicine, Massachusetts General Hospital, Boston, MA, United States, 5Institute of Medical Engineering and Science, Massachusetts Institute of Technology, Cambridge, MA, United States, 6Electrical Engineering and Computer Science, Massachusetts Institute of Technology, Cambridge, MA, United States
Synopsis
T2* imaging has been the focus of research into the non-invasive MRI assessment of placental function, yet the fundamental physiology that determines placental T2* is under active investigation. We explored the effect of maternal breath holding on placental T2* quantified with multi-echo GRE EPI. We quantified T2* in free-breathing and breath hold periods by identifying voxels that responded to the breath hold stimulus through fitting with a GLM, and found a consistent positive increase in T2* during breath hold. This increase may be evidence that fetal SO2 rises during mild maternal hypercapnia, as has been observed previously in instrumented animals.
Introduction
Non-invasive assessment of placental function remains an area of active investigation, with T2* weighted imaging and T2* relaxometry receiving the most attention due to its ease of acquisition and inherent sensitivity to blood flow and blood oxygenation.1,2 However, studies of placental T2* have relied on various acquisition methods and different maternal breathing strategies to control abdominal motion.2 We have found that gradient echo (GE) T2* mapping during breath hold yielded lower whole placenta T2* than multi-echo GRE EPI (MEGE-EPI) during free breathing.3 In this study, investigated the effect of breath hold on placental T2* relaxometry by asking mothers to hold their breath and to breathe normally during a continuously acquired multislice MEGE-EPI acquisition and compared placental T2* between the two breathing states.Methods
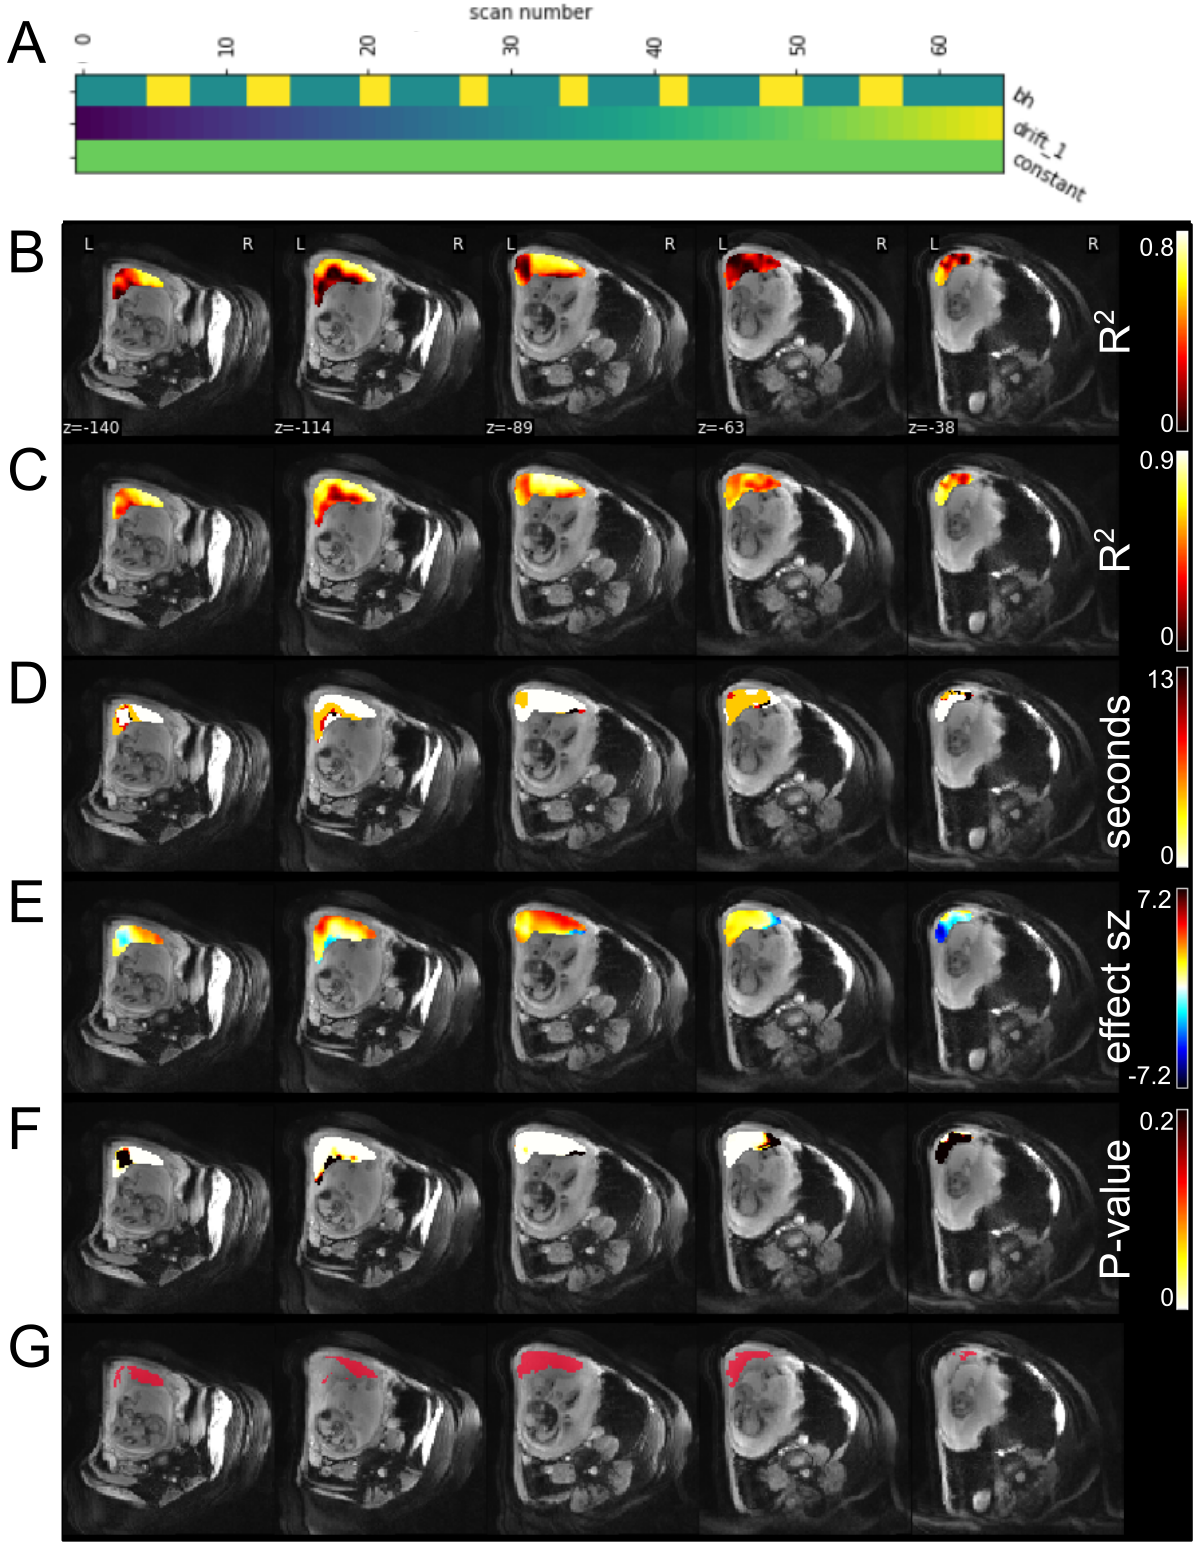
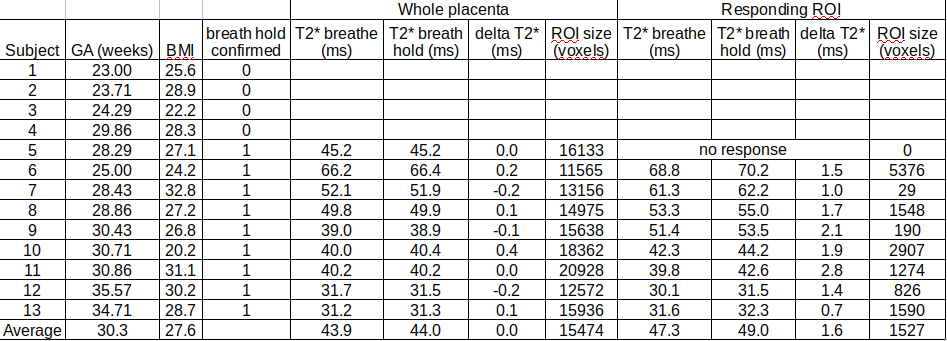
Subjects: 13 subjects with normal singleton pregnancies (gestational age: 23-35.6 weeks, BMI: 20.2-32.8) were included. Acquisitions: Scans were performed on a 3T Skyra scanner (Siemens Healtineers, Erlangen, Germany) with subjects in the left-lateral decubitus position. Images were obtained using a multi-echo (TEs: 18, 46.8, 75.6ms) GRE EPI sequence (TR: 4.2s, in-plane resolution of 3.2mm×3.2mm, a slice thickness of 3.2mm, 70slices, GRAPPA 2, SMS 2, 2 interleaves) during 8 periods of alternating free breathing (20s) and breath hold (10s). Breath hold was indicated by an audio or visual cue. Processing and Analysis: We verified that breathing motion was not present during the cued breath hold periods, then corrected signal non-uniformity, and motion, and determined outliers using our previously reported computational pipeline.4 Voxel-wise corrected signal intensity for each TE were fit using a general linear model (nilearn5) including regressors for breath hold task (βBH), baseline offset (β0), and linear drift. Breath holding was modeled as a piecewise constant function, 1 during breath hold and 0 during breathing (Figure 2A). The breath hold intervals were lagged by 0 to 3xTR in TR increments since the timescale of placental effects are unknown. The optimal voxel-wise lag was determined by selecting the lagged model of TE=18ms signals with the highest R2.6 A responding region of interest (ROI) in the placenta was defined by selecting voxels where, for TE=75.6ms, optimal-lag P-values<0.05 when controlling for a false discovery rate of 0.05. Within this ROI fit coefficients were averaged, and T2* were determined by fitting meanROI(β0) = Ae-TE/T2* and meanROI(β0+βBH) = Ae-TE/T2* for breathing and breath hold, respectively.Results
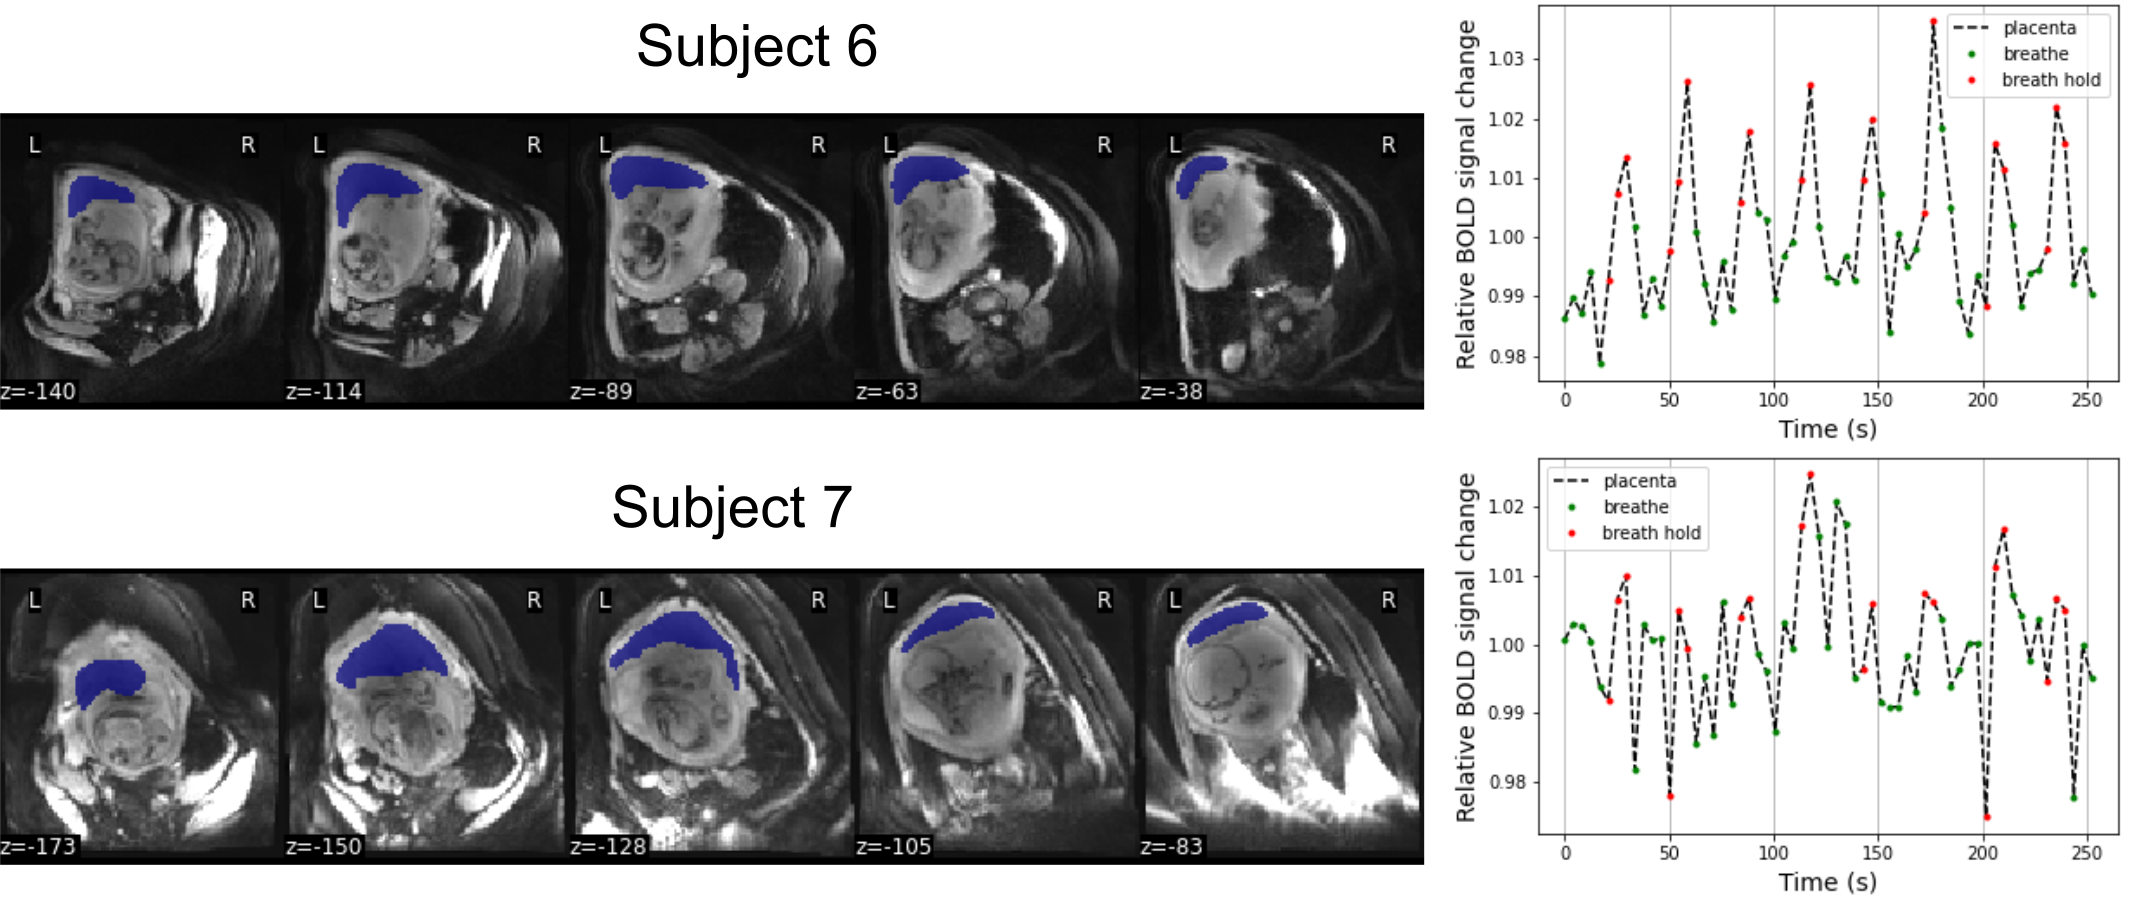
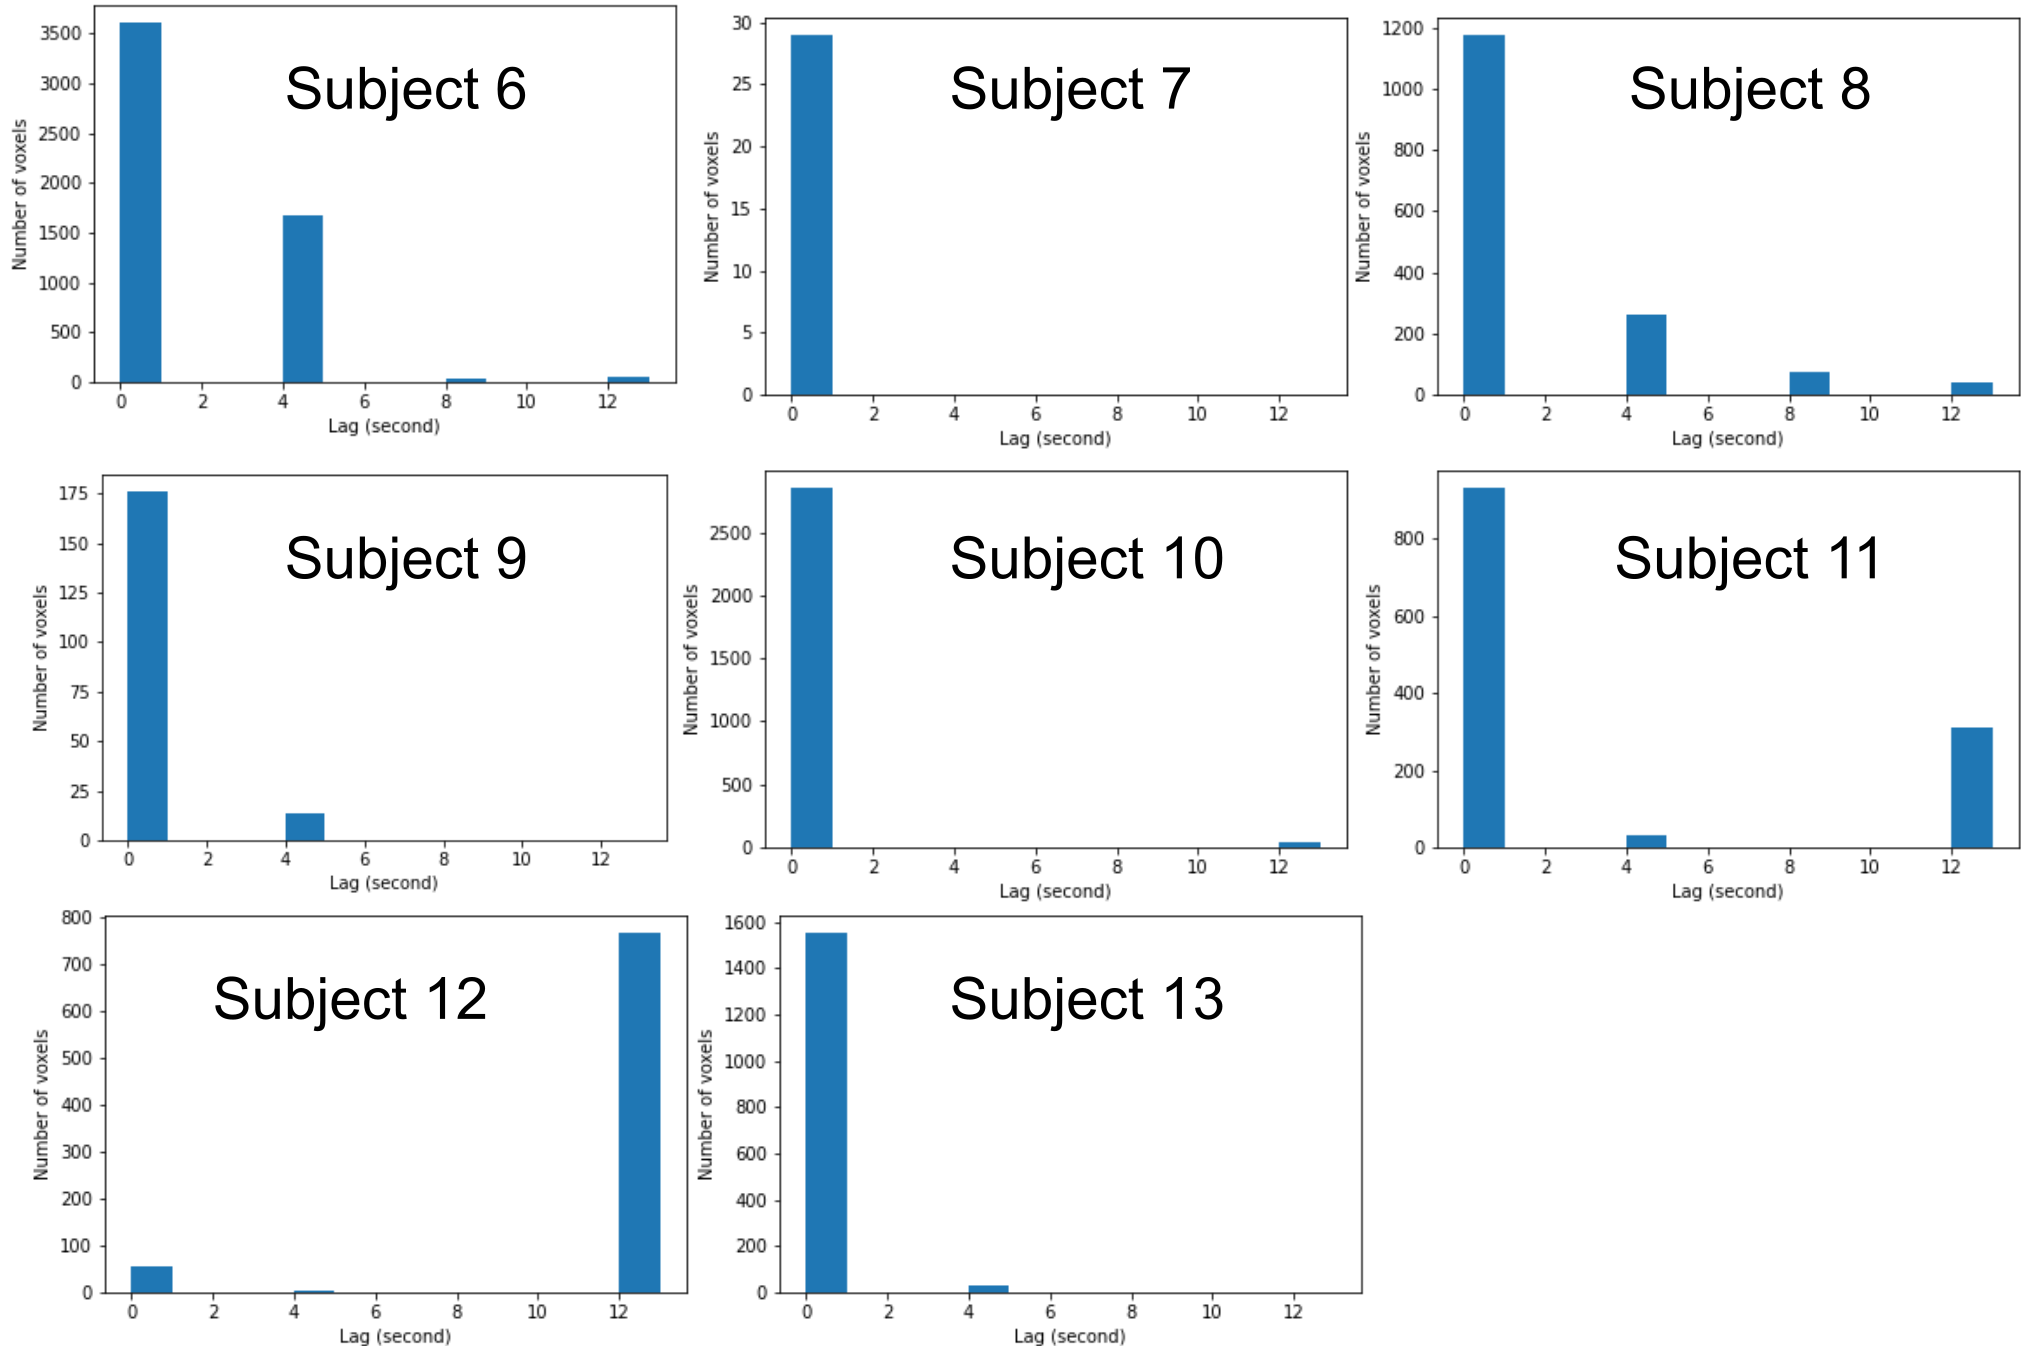
We confirmed that 9 subjects complied with the breathing task. Whole placenta BOLD signal changes were observed at a similar timing to the breath hold, but the strength of the response varied considerably (Figure 1). GLM analysis of placental BOLD signal responses to the breathing task yielded heterogeneous results both in terms of strength and onset (Figure 2). No consistent whole placenta response was observed, contrasting with a consistent, average 1.6ms increase in T2* in responding regions (Table 1). There was no discernable pattern of optimal voxel-wise lag within the responding regions (Figure 3).Discussion
Maternal breath holding was associated with a consistent, small increase in T2* in placental regions that responded. This was opposite our previous multi-modal observation.3 The current investigation used the same T2* acquisition method in both states, and substantially improved the temporal resolution of the underlying data. This permitted monitoring for contractions and compliance with breath hold cues, which in our current study was a modest 70%. The described GLM analysis acknowledges the heterogeneity of the placenta, and does not enforce a global response to breath hold at a certain moment. This flexibility was justified by the consistently observed increase in T2* in responding regions. This analysis approach permitted investigation into the temporal dynamics of the BOLD response to breath hold, which could lag its onset by more than 12 seconds (Figure 3).T2* is related to oxygenated hemoglobin concentration,7 so an increase in T2* suggests a counterintuitive increase in net placental SO2 during maternal breath hold. Previous animal studies of mild induced maternal hypercapnia also showed an increase in fetal umbilical vein oxygen saturation.8,9 The proposed mechanism was an increased uterine blood flow and greater mass delivery of oxygen. In lieu of direct observations of uterine vessel flow during maternal breath hold, we believe our data supports these previous observations, and is further evidence that mild hypercapnia may alter maternal placenta blood flow.
We did not additionally monitor maternal physiology so we are inferring the presence of mild hypercapnia based on previous studies.10 Mild hypoxia may be an additional confound.11 Future work will aim to relate the quantified placental T2* change with specific placental physiology, which may be aided in part by our ex vivo placental perfusion system.12 The multiple lag analysis framework here developed for placental imaging may also permit further exploration of the temporal heterogeneity of placental physiology/pathology.
Conclusion
Maternal breath hold caused placental T2* quantified by MEGE-EPI to increase in some regions. This observation agrees with previous invasive animal experiments that showed an increase in umbilical vein SO2 with mild maternal hypercapnia.Acknowledgements
NIBIB R01EB017337 “Advanced fetal imaging”
NICHD U01HD087211 “Noninvasive real time assessment of placental structure and function with novel MR imaging methods”
NICHD R01HD100009 “Novel Mri Assessment Of Placental Structure And Function Throughout Pregnancy”
References
1 Sørensen A, Hutter J, Seed M, Grant PE, Gowland P. T2* weighted placental MRI: basic research tool or an emerging clinical test of placental dysfunction? Ultrasound Obstet Gynecol [Internet]. 2019 Aug 26; Available from: http://dx.doi.org/10.1002/uog.20855 PMID: 31452271
2 Hutter J, Jackson L, Ho A, Pietsch M, Story L, Chappell LC, Hajnal JV, Rutherford M. T2* relaxometry to characterize normal placental development over gestation in-vivo at 3T. Wellcome Open Research. F1000 Research Ltd; 2019 Nov 5;4:166.
3 Abaci Turk E, Stout JN, Gagoski B, Manhard MK, Adalsteinsson E, Setsompop K, Goland P, Roberts DJ, Barth WH Jr, Grant PE. Placental MRI: Effect of maternal position, breath hold and oxygen state on placental T2* measurements. Proc ISMRM Annual Meeting. 2020. p. 0581.
4 Turk EA, Luo J, Gagoski B, Pascau J, Bibbo C, Robinson JN, Grant PE, Adalsteinsson E, Golland P, Malpica N. Spatiotemporal alignment of in utero BOLD-MRI series. J Magn Reson Imaging. 2017 Aug;46(2):403–412. PMCID: PMC5509493
5 Abraham A, Pedregosa F, Eickenberg M, Gervais P, Mueller A, Kossaifi J, Gramfort A, Thirion B, Varoquaux G. Machine learning for neuroimaging with scikit-learn. Front Neuroinform. 2014 Feb 21;8:14. PMCID: PMC3930868
6 Moia S, Stickland RC, Ayyagari A, Termenon M, Caballero-Gaudes C, Bright MG. Voxelwise optimization of hemodynamic lags to improve regional CVR estimates in breath-hold fMRI. Conf Proc IEEE Eng Med Biol Soc. 2020 Jul;2020:1489–1492. PMID: 33018273
7 Chavhan GB, Babyn PS, Thomas B, Shroff MM, Haacke EM. Principles, techniques, and applications of T2*-based MR imaging and its special applications. Radiographics. 2009 Sep;29(5):1433–1449. PMCID: PMC2799958
8 Hanka R, Lawn L, Mills IH, Prior DC, Tweeddale PM. The effects of maternal hypercapnia on foetal oxygenation and uterine blood flow in the pig. J Physiol. 1975 May;247(2):447–460. PMCID: PMC1309478
9 Walker AM, Oakes GK, Ehrenkranz R, McLaughlin M, Chez RA. Effects of hypercapnia on uterine and umbilical circulations in conscious pregnant sheep. J Appl Physiol. 1976 Nov;41(5 Pt. 1):727–733. PMID: 993146
10 Pinto J, Bright MG, Bulte DP, Figueiredo P. Cerebrovascular Reactivity Mapping Without Gas Challenges: A Methodological Guide. Front Physiol. 2021;11(January):608475. PMCID: PMC7848198
11 Chan S-T, Evans KC, Song T-Y, Selb J, van der Kouwe A, Rosen BR, Zheng Y-P, Ahn A, Kwong KK. Cerebrovascular reactivity assessment with O2-CO2 exchange ratio under brief breath hold challenge. Ogoh S, editor. PLoS One. 2020 Mar 24;15(3):e0225915.
12 Stout JN, Rouhani S, Turk EA, Ha CG, Luo J, Rich K, Wald LL, Adalsteinsson E, Barth WH, Grant PE, Roberts DJ. Placental MRI: Development of an MRI compatible ex vivo system for whole placenta dual perfusion. Placenta. 2020 Nov;101:4–12. PMID: 32905974
Figures