0811
Comparison of local SAR and temperature increase between 1.5T and 3T in fetal MRI across five numerical pregnant body models1Fetal-Neonatal Neuroimaging and Developmental Science Center, Boston Children's Hospital, Boston, MA, United States, 2Department of Pediatrics, Boston Children's Hospital, Boston, MA, United States, 3Department of Radiology, Boston Children's Hospital, Boston, MA, United States, 4Maternal Fetal Care Center, Boston Children's Hospital, Boston, MA, United States, 5Department of Electrical Engineering and Computer Science, Massachusetts Institute of Technology, Cambridge, MA, United States, 6Harvard-MIT Division of Health Sciences and Technology, Massachusetts Institute of Technology, Cambridge, MA, United States, 7Institute for Medical Engineering and Science, Massachusetts Institute of Technology, Cambridge, MA, United States, 8Athinoula A. Martinos Center for Biomedical Imaging, Massachusetts General Hospital, Charlestown, MA, United States, 9Department of Radiology, Massachusetts General Hospital, Boston, MA, United States
Synopsis
3T can improve fetal MRI compared to 1.5T, but concerns over increased RF safety risk for the fetus exist due to higher field nonuniformity. Previous studies comparing fetal SAR between two field strengths used either a single pregnant body model or artificial pregnant body models. In this study, we compare SAR and temperature increase in the fetus and mother at 1.5T and 3T using 5 anatomically realistic and diverse pregnant body models. Across these models, we find similar or lower levels of fetal SAR and temperature increase at 3T compared to 1.5T.
Target audience
MR physicists and clinicians interested in fetal MRI safety at 3T.Introduction
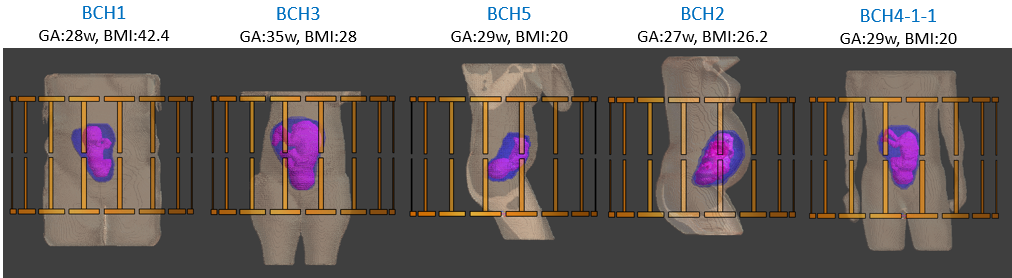
3T MRI can improve the quality of fetal imaging compared to the more established 1.5T MRI due to improved SNR.1,2 However, there is concern over increased local SAR at 3T, especially critical for the fetus, due to more nonuniform radiofrequency fields.3–5 Previous studies6–10 did not observe a significant increase in fetal SAR and temperature due to RF exposure at 3T compared to 1.5T. However, these studies either used a single body model,7–9 or used body models artificially generated from a single nonpregnant female body model9,10 or homogeneous mathematical models.6 Moreover, all body models had a normal BMI and were in supine position, which does not fully represent the large variation in subject size and posture in the pregnant population. Some previous studies used cerebrospinal fluid properties as a proxy for amniotic fluid which may inaccurately alter fetal SAR.11,12 Finally, some artificial models have unrealistic maternal trunk shapes and amniotic fluid amounts which might change fetal SAR exposure. In this study, we compare SAR, temperature and transmit field (B1+) between 1.5T and 3T across 5 pregnant body models13 generated from MRI data of pregnant subjects. These models include variations in posture (supine or left lateral), BMI (20-42), gestational age (29-35weeks) and arm position (side or up). Our goal is to provide an extensive and realistic safety assessment of fetal MRI at 3T.Methods
We utilized 5 previously described pregnant body models,13 BCH1-5, with 24 maternal tissues and 2 fetal tissues, fetus and fetal brain. These body models were loaded into a 2-port 16-rung bandpass birdcage body coil as shown in Figure 1 (diameter=750 mm, length=480 mm). The coil was tuned to either 64 MHz or 128 MHz by adjusting the rung and end ring capacitors. Electromagnetic and thermal simulations were carried out using Sim4Life (Zurich MedTech, Zurich, Switzerland). Tissue dielectric properties were assigned according to the IT’IS database14 except fetal tissues7 and amniotic fluid.15 Thermal properties were assigned according to the IT’IS database14 with ‘fetus’ assigned to muscle and ‘fetal brain’ assigned to brain. Heat generation of fetus was adjusted to result in average fetal temperatures of ~37.3 °C in the absence of RF exposure. The thermoregulation model in Murbach et al.10 was used for maternal tissues and perfusion rate was kept constant for fetal tissues. Average SAR (aveSAR) in fetus, 10g average peak local SAR (pSAR10g) in fetus and mother trunk, and transmit field (B1+) were calculated for whole-body average SAR (wbSAR) of 2W/kg, and circularly polarized excitation. Temperature changes were recorded after 30 minutes of exposure to 2W/kg wbSAR.Results
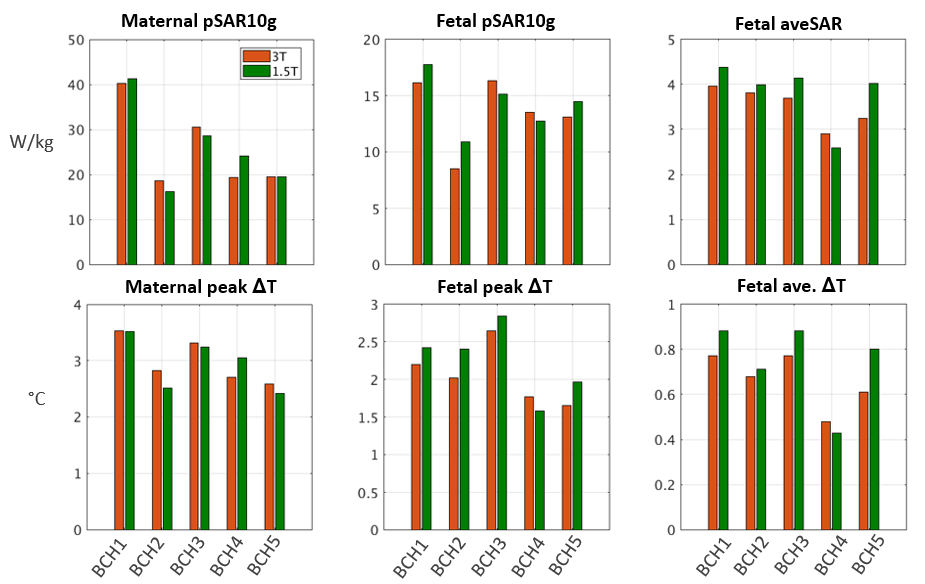
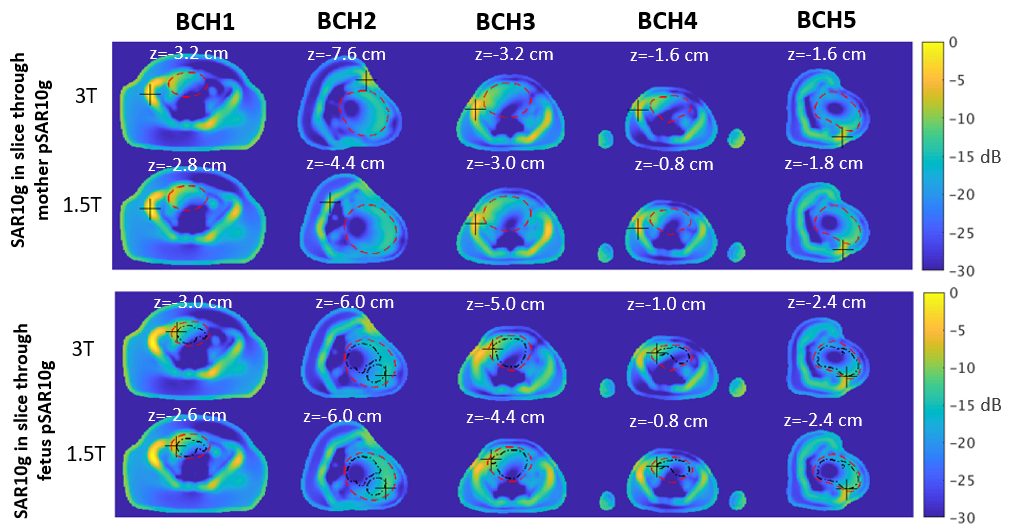
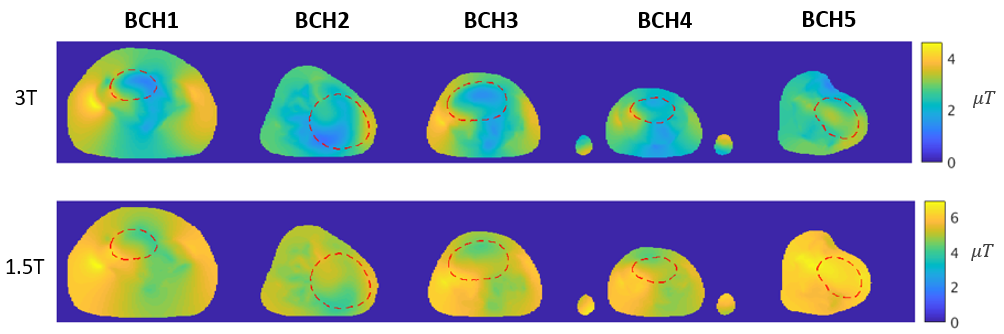
Figure 2 shows SAR and increase in maximum temperature (ΔT) due to RF exposure in mother and fetus. Maternal pSAR10g is between 18.6 and 40.2 W/kg at 3T and 16.2 and 41.2 W/kg at 1.5T. Fetal pSAR10g is between 8.5 and 16.3 W/kg at 3T and 10.9 and 17.8 W/kg at 1.5T. Fetal aveSAR is between 2.9 and 4.0 W/kg at 3T and 2.6 and 4.4 W/kg at 1.5T. Maximum peak ΔT across all models is 3.53°C and 3.52°C in mother and 2.64°C and 2.84°C in fetus at 3T and 1.5T, respectively. For the fetus, maximum average ΔT across models is 0.77°C at 3T and 0.88°C at 1.5T. Figure 3 shows SAR10g in the transverse slices through maternal and fetal pSAR10g. Fetal pSAR10g is always located at fetus-amniotic fluid interface and its location is similar between 1.5T and 3T. Maternal pSAR10g is observed usually in the muscle tissue around the hip bones. Figure 4 compares B1+ inside the isocenter transverse slice between 1.5T and 3T and shows higher and more uniform B1+ at 1.5T for the same wbSAR.Discussion and Conclusions
SAR and temperature increase in mother and fetus is compared between 1.5T and 3T MRI. Maternal pSAR10g and ΔT differs by up to 24% and 0.20°C respectively between 1.5T and 3T. Fetal pSAR10g is higher at 1.5T in 3 out of 5 models by up to 28% and fetal aveSAR is higher at 1.5T in 4 out of 5 models by up to 38%. Fetal peak and average ΔT is higher at 1.5T for 4 out of 5 models by up to 0.38°C and 0.19 °C, respectively. Therefore, we show similar or lower levels of fetal SAR and ΔT at 3T compared to 1.5T across 5 anatomically realistic and diverse pregnant models irradiated at 2W/kg wbSAR. The decrease in fetal SAR is likely due to better penetration of fields at 1.5T into deep tissues. Our results are in line with, and build on findings of previous studies.6–10 Fetal SAR and thus ΔT in this study and other studies11,13 using BCH models is higher than those reported in previous studies.6–10 This is likely due to model/subject differences such as amniotic fluid amount and distribution, and maternal trunk shape. Temperature increase observed in the fetus is also higher than those recommended by IEC.16 However, constant exposure at 2W/kg wbSAR with no fetal motion will significantly overestimate temperature increase during clinical fetal MRI scans where typical time-averaged wbSAR values are ~0.7W/kg.9,13 Future work involves including more body models and simulating temperature for realistic scan scenarios.Acknowledgements
This work was supported by R01HD100009, U01HD087211, and R01EB017337.References
1. Krishnamurthy U, Neelavalli J, Mody S, et al. MR imaging of the fetal brain at 1.5T and 3.0T field strengths: comparing specific absorption rate (SAR) and image quality. J Perinat Med. 2015;43(2):209-220.
2. Victoria T, Johnson AM, Edgar JC, Zarnow DM, Vossough A, Jaramillo D. Comparison Between 1.5-T and 3-T MRI for Fetal Imaging: Is There an Advantage to Imaging With a Higher Field Strength? AJR Am J Roentgenol. 2016;206(1):195-201.
3. Soher BJ, Dale BM, Merkle EM. A review of MR physics: 3T versus 1.5T. Magn Reson Imaging Clin N Am. 2007;15(3):277-290.
4. Victoria T, Jaramillo D, Roberts TPL, et al. Fetal magnetic resonance imaging: jumping from 1.5 to 3 tesla (preliminary experience). Pediatr Radiol. 2014;44(4):376-386.
5. Weisstanner C, Gruber GM, Brugger PC, et al. Fetal MRI at 3T—ready for routine use? Br J Radiol. 2016;90(1069).
6. Wu D, Shamsi S, Chen J, Kainz W. Evaluations of Specific Absorption Rate and Temperature Increase Within Pregnant Female Models in Magnetic Resonance Imaging Birdcage Coils. IEEE Trans Microw Theory Tech. 2006;54(12):4472-4478.
7. Hand JW, Li Y, Thomas EL, Rutherford MA, Hajnal JV. Prediction of specific absorption rate in mother and fetus associated with MRI examinations during pregnancy. Magn Reson Med. 2006;55(4):883-893.
8. Pediaditis M, Leitgeb N, Cech R. RF-EMF exposure of fetus and mother during magnetic resonance imaging. Phys Med Biol. 2008;53(24):7187-7195.
9. Hand JW, Li Y, Hajnal JV. Numerical study of RF exposure and the resulting temperature rise in the foetus during a magnetic resonance procedure. Phys Med Biol. 2010;55(4):913-930.
10. Murbach M, Neufeld E, Samaras T, et al. Pregnant women models analyzed for RF exposure and temperature increase in 3T RF shimmed birdcages. Magn Reson Med. 2017;77(5):2048-2056.
11. Yetisir F, Abaci Turk E, Guerin B, et al. Safety and imaging performance of two-channel RF shimming for fetal MRI at 3T. Magn Reson Med. 2021;86(5):2810-2821.
12. Malik SJ, Hand JW, Hajnal JV. The effect of variable amniotic fluid conductivity and fetal tissues properties on B1+ and local SAR for fetal imaging at 3T. In: Proceedings of the 25th Annual Meeting of ISMRM. 2017, p5578.
13. Abaci Turk E, Yetisir F, Adalsteinsson E, et al. Individual variation in simulated fetal SAR assessed in multiple body models. Magn Reson Med. 2020;83(4):1418-1428.
14. Hasgall P, Gennaro F, Baumgartner C, et al. IT’IS Database for thermal and electromagnetic parameters of biological tissues. 2018;4.
15. Peyman A, Gabriel C. Dielectric properties of rat embryo and foetus as a function of gestation. Phys Med Biol. 2012;57(8):2103-2116.
16. International Electrotechnical Commission. IEC 60601-2-33: Medical electrical equipment-Particular requirements for the basic safety and essential performance of magnetic resonance equipment for medical diagnosis. Published 2015. Accessed April 22, 2021. https://webstore.iec.ch/publication/22705
Figures