0810
Arterio-venous transit and oxygen extraction fraction before and after blood transfusion in sickle cell disease1Vanderbilt University, Nashville, TN, United States, 2Pediatrics, Vanderbilt University Medical Center, Nashville, TN, United States, 3Neurology, Vanderbilt University Medical Center, Nashville, TN, United States, 4Radiology and Radiological Sciences, Vanderbilt University Medical Center, Nashville, TN, United States
Synopsis
Most persons with sickle cell disease (SCD) lack conventional stroke risk factors, yet nearly 50% have evidence of brain infarcts by age 30 years, indicating alternative etiologies for ischemia. We investigated whether accelerated red cell transit affects oxygen extraction and improves following transfusion-induced increases in hemoglobin. Findings suggest that evidence of accelerated capillary transit is present on arterial spin labeling (ASL) MRI, and reduces following transfusion-induced increases in hemoglobin. Furthermore, the relationship between dural ASL signal and brain oxygen extraction evolves following transfusion, suggesting that oxygen delivery is complexly dependent on blood oxygen content and capillary dynamics.
Introduction
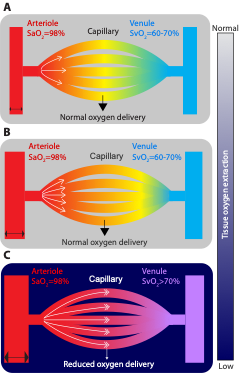
Persons with sickle cell disease (SCD) suffer from chronic hemolytic anemia, reduced blood oxygen content, and risk of silent and overt stroke 1. Most persons with SCD lack conventional stroke risk factors, yet nearly 50% have evidence of brain infarcts by age 30 years, indicating alternative etiologies for ischemia 2, 3. As blood oxygen content reduces due to anemia, cerebral blood flow (CBF) will increase to maintain an adequate oxygen delivery to tissue. Such hyperemia is expected to improve oxygen delivery, however oxygen delivery additionally depends on the capillary transit time. For individuals in whom red cells spend sufficiently less time to traverse the capillary bed, there will be less time for oxygen extraction (Figure 1). Therefore, oxygen delivery to tissue may not scale directly with CBF but may also depend on the time the red cell spends in the capillary bed itself 4, 5. We investigated whether accelerated red cell transit through capillaries, visible on arterial spin labeling (ASL) MRI, relates to reduced oxygen extraction fraction (OEF) and improves following transfusion-induced increases in hemoglobin.Materials and Methods
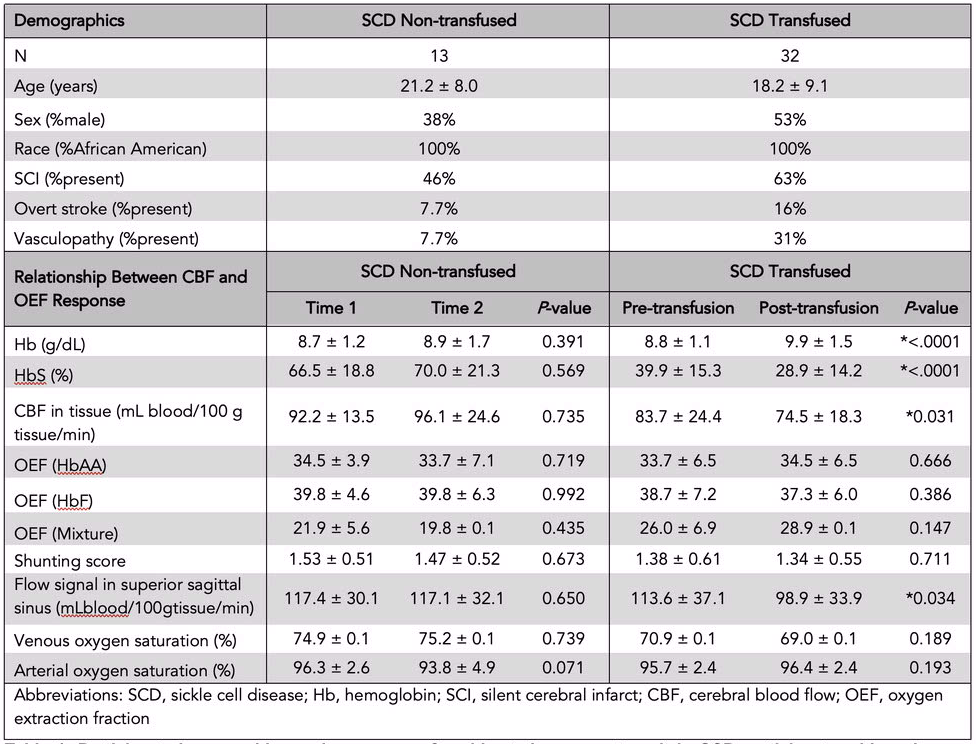
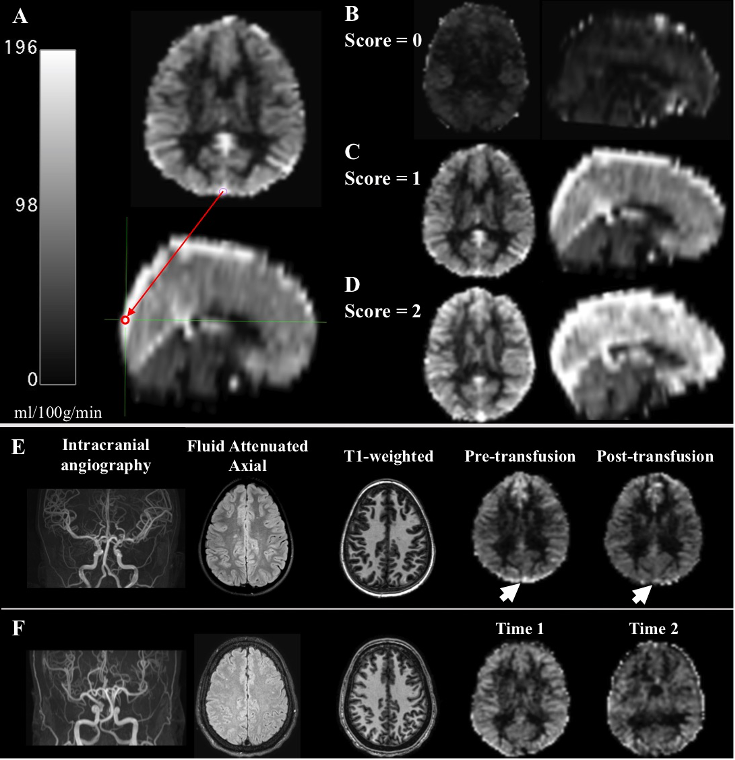
Demographics. Adult and pediatric participants with SCD (HbSS or HbSβ0 phenotype) provided informed consent. SCD participants scheduled for clinically-indicated blood transfusion were enrolled; a second cohort of SCD participants stable on hydroxyurea without blood transfusion were included and scanned at two points. Experiment. 3T MRI (Philips Healthcare) was performed within seven days prior to transfusion and repeated within seven days after transfusion. Hemoglobin levels and arterial oxygen saturation were measured on the day of the scan. Pseudocontinuous arterial spin labeling (pCASL) was used to evaluate gray matter CBF and dural venous signal intensity (spatial resolution=3x3x7 mm3; adult post-labeling delay=1900 ms; children post-labeling delay=1650 ms). T2-relaxation-under-spin-tagging (TRUST) data were acquired twice per session (spatial resolution=3.4x3.4x5 mm3, tCPMG=10 ms, effective echo time=0, 40, 80, and 160 ms) for OEF determination 6. Analysis. pCASL data were corrected for hematocrit and labeling efficiency. Dural signal was evaluated in the pCASL data in two ways: (i) using a previously reported categorical consensus (2-rater) scoring system 5 and (ii) using a continuous, quantitative measure of venous signal at a standardized location in the superior sagittal sinus at the location of the parieto-occipital sulcus. Venous blood water T2 was quantified in the superior sagittal sinus from TRUST and converted to venous oxygen saturation using models that have a hematocrit dependence and are calibrated over an anemic range: human hemoglobin-AA, human hemoglobin-F, and a model that merged SCD data from two different studies 7-9. Hypothesis testing. Paired statistics were calculated between pre-transfusion and post-transfusion and between time-1 and time-2 using paired t-tests for parametric data. A Wilcoxon test was applied to nonparametric data in the SCD transfused and SCD non-transfused participants to determine group differences between OEF and both CBF in tissue and flow signal (significance: two-sided p<0.05).Results
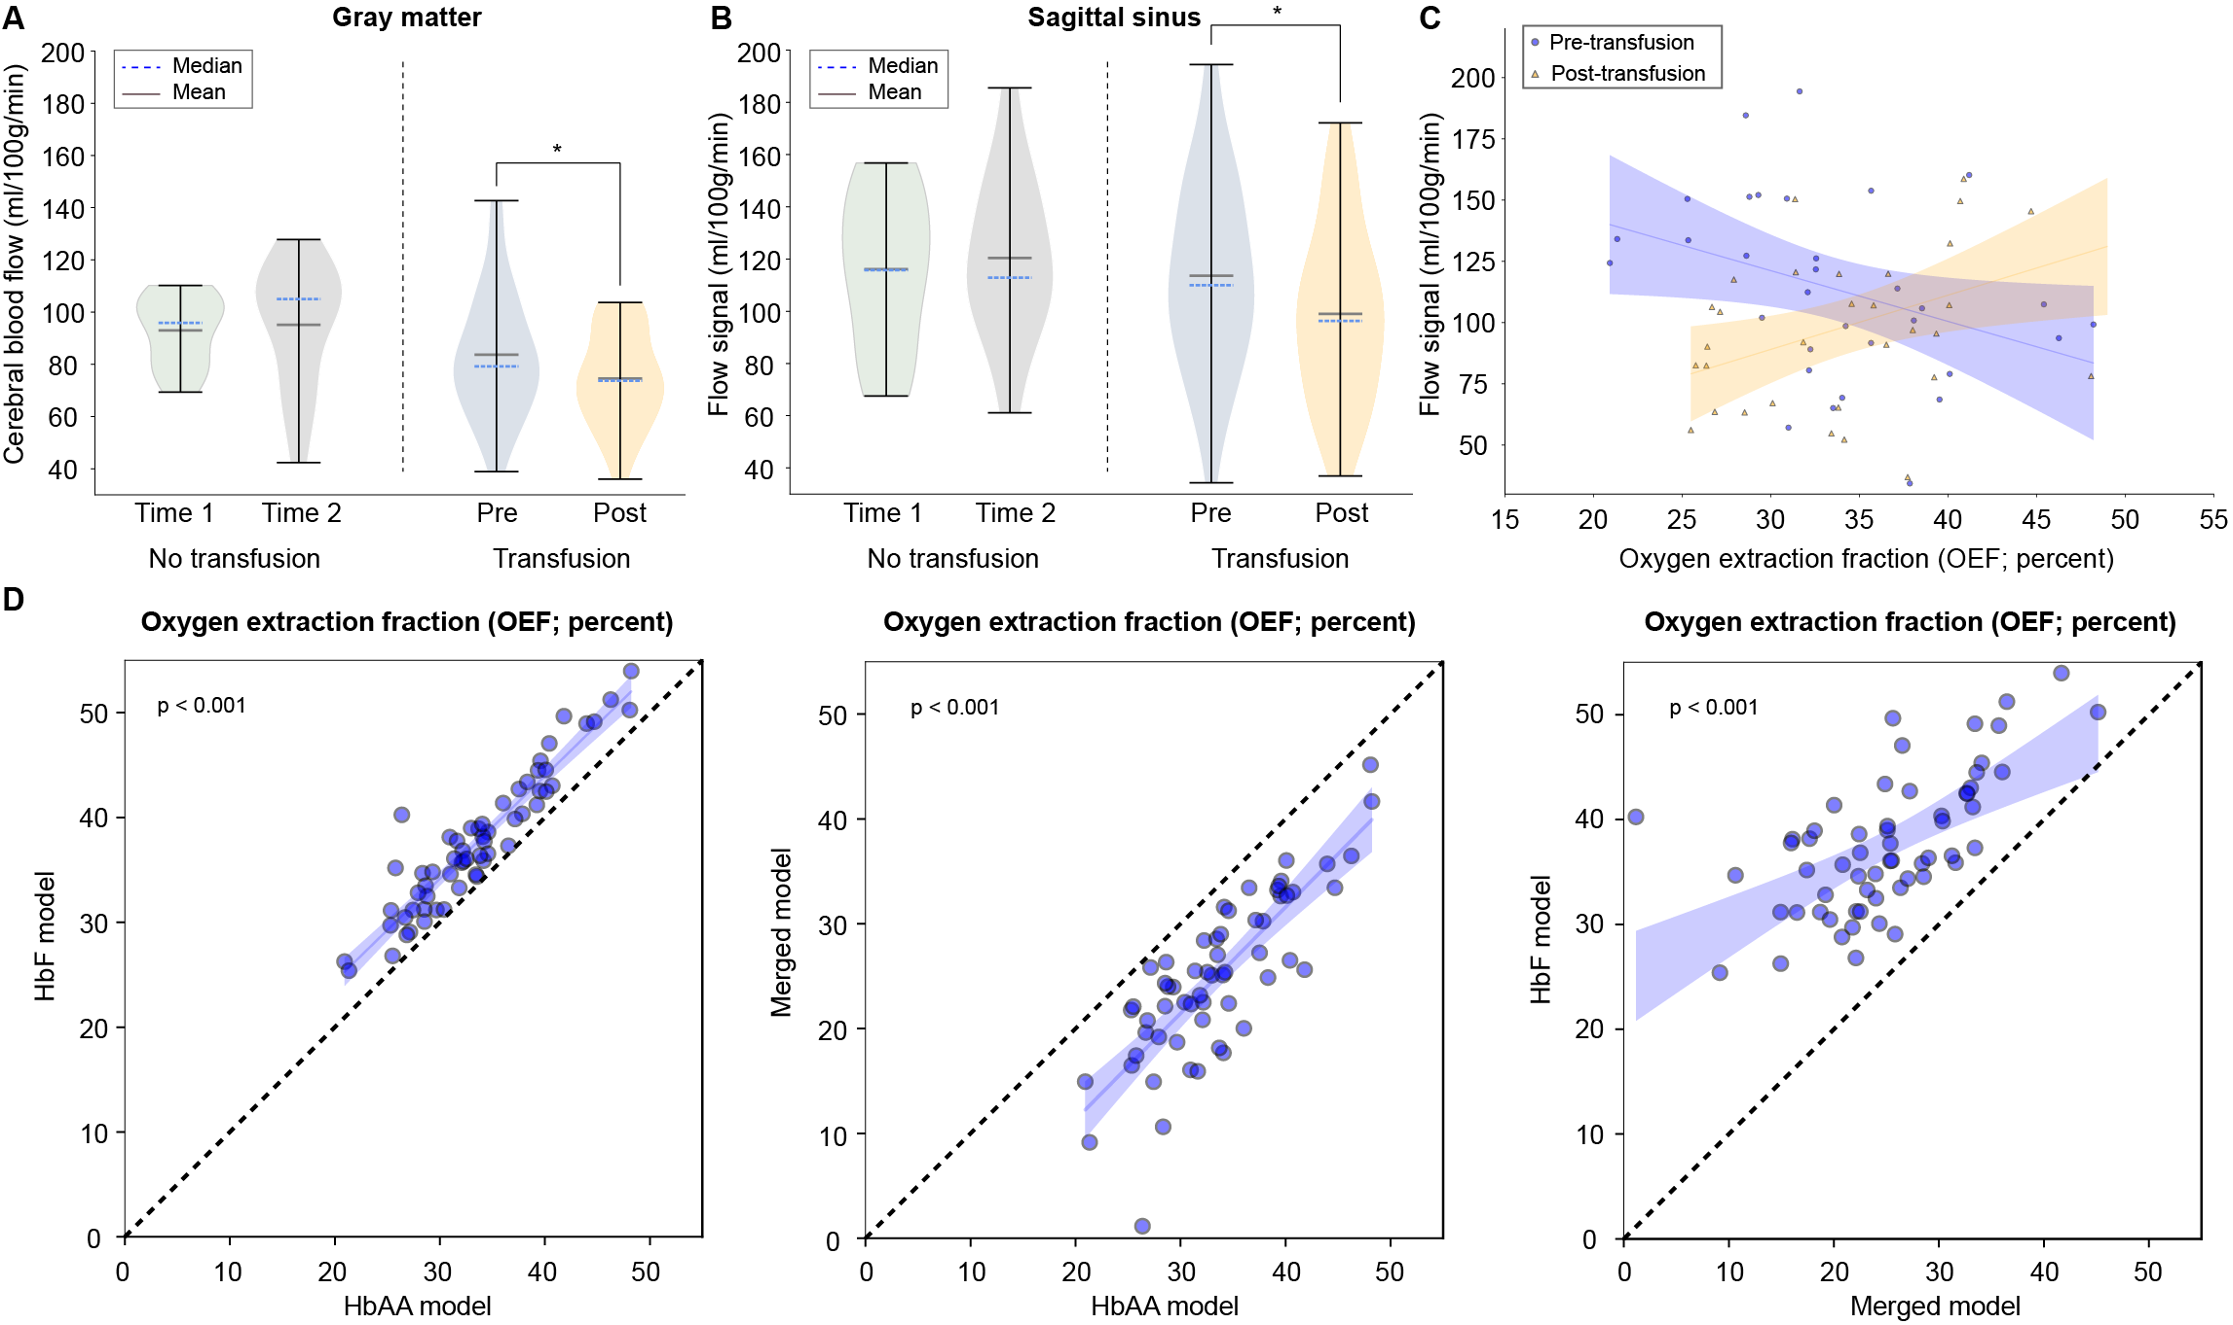
We enrolled 32 transfused SCD participants (age=18.2 ± 9.1 years, 53% male) and 13 non-transfused SCD participants (age=21.2 ± 8.0 years, 38% male) and (Table 1). Figure 2 shows three SCD participants, each with different categorical shunting scores according to previously published criteria. Using the categorical scoring system, no difference in mean shunting scores between time points was observed. However, for the more sensitive continuous measure, we observed no significant difference in mean flow signal between time-1 (117.4±30.1 ml/100g/min) and time-2 (117.1±32.1 ml/100g/min) of non-transfused participants (p=0.650), yet in transfused participants a significant decrease in mean flow signal was observed between pre-transfusion (113.6±37.1 ml/100g/min) and post-transfusion (98.9±33.9 ml/100g/min) (p=0.034) (Figure 3). We observed that with increasing mean dural sinus flow signal, consistent with increased capillary shunting, participants before transfusion had a reduced OEF (Wilcoxon test, p=0.011). This relationship between OEF and flow signal reversed post-transfusion when using the HbF or HbAA models (p<0.01), or became non-significant (p=0.905) when using the merged-mixture model.Discussion
We provide evidence that arterio-venous shunting, visualized as dural sinus hyperintensity on arterial spin labeling MRI, reduces following transfusion-induced increases in hemoglobin in adults and children with SCD. We extend other preliminary findings 10 to demonstrate this effect, and its relation to oxygen extraction, in a larger cohort of SCD participants before and after transfusion. Prior to transfusion, an inverse correspondence between dural sinus hyperintense signal and global OEF was observed; after transfusion, this relationship changed and was either null or positive, depending on calibration model used. Results provide evidence of such shunting contrast reducing following transfusion, and this corresponds with a change in the relationship between the dural sinus signal and OEF.Conclusion
This study utilizes novel multi-modal functional hemodynamic MRI to provide evidence that capillary transit time is associated with oxygen extraction efficiency in participants with SCD, and importantly that transfusion-induced increases in hemoglobin yield imaging contrast consisted with a lengthening of these capillary transit times.Acknowledgements
Funding provided by NIH/NHLBI 5K24HL147017, NIH/NINDS 5R01NS096127, and NIH/NINDS 5R01NS097763
References
1. DeBaun MR, Kirkham FJ. Central nervous system complications and management in sickle cell disease. Blood. 2016;127(7):829-38. Epub 2016/01/14. doi: 10.1182/blood-2015-09-618579. PubMed PMID: 26758917.
2. Jordan LC, DeBaun MR, Donahue MJ. Advances in neuroimaging to improve care in sickle cell disease. Lancet Neurol. 2021;20(5):398-408. Epub 2021/04/25. doi: 10.1016/S1474-4422(20)30490-7. PubMed PMID: 33894194.
3. Fields ME, Guilliams KP, Ragan DK, Binkley MM, Eldeniz C, Chen Y, Hulbert ML, McKinstry RC, Shimony JS, Vo KD, Doctor A, An H, Ford AL, Lee JM. Regional oxygen extraction predicts border zone vulnerability to stroke in sickle cell disease. Neurology. 2018;90(13):e1134-e42. Epub 2018/03/04. doi: 10.1212/WNL.0000000000005194. PubMed PMID: 29500287; PMCID: PMC5880632.
4. Jespersen SN, Ostergaard L. The roles of cerebral blood flow, capillary transit time heterogeneity, and oxygen tension in brain oxygenation and metabolism. J Cereb Blood Flow Metab. 2012;32(2):264-77. Epub 2011/11/03. doi: 10.1038/jcbfm.2011.153. PubMed PMID: 22044867; PMCID: PMC3272609.
5. Juttukonda MR, Donahue MJ, Waddle SL, Davis LT, Lee CA, Patel NJ, Pruthi S, Kassim AA, Jordan LC. Reduced oxygen extraction efficiency in sickle cell anemia patients with evidence of cerebral capillary shunting. J Cereb Blood Flow Metab. 2021;41(3):546-60. Epub 2020/04/14. doi: 10.1177/0271678X20913123. PubMed PMID: 32281458; PMCID: PMC7922746.
6. Lu H, Ge Y. Quantitative evaluation of oxygenation in venous vessels using T2-Relaxation-Under-Spin-Tagging MRI. Magn Reson Med. 2008;60(2):357-63. Epub 2008/07/31. doi: 10.1002/mrm.21627. PubMed PMID: 18666116; PMCID: PMC2587050.
7. Bush A, Borzage M, Detterich J, Kato RM, Meiselman HJ, Coates T, Wood JC. Empirical model of human blood transverse relaxation at 3 T improves MRI T2 oximetry. Magn Reson Med. 2017;77(6):2364-71. Epub 2016/07/08. doi: 10.1002/mrm.26311. PubMed PMID: 27385283; PMCID: PMC5218988.
8. Bush A, Vu C, Choi S, Borzage M, Miao X, Li W, Qin Q, Nederveen AJ, Coates TD, Wood JC. Calibration of T2 oximetry MRI for subjects with sickle cell disease. Magn Reson Med. 2021;86(2):1019-28. Epub 2021/03/16. doi: 10.1002/mrm.28757. PubMed PMID: 33719133; PMCID: PMC8076101.
9. Liu P, Chalak LF, Krishnamurthy LC, Mir I, Peng SL, Huang H, Lu H. T1 and T2 values of human neonatal blood at 3 Tesla: Dependence on hematocrit, oxygenation, and temperature. Magn Reson Med. 2016;75(4):1730-5. Epub 2015/05/20. doi: 10.1002/mrm.25775. PubMed PMID: 25981985; PMCID: PMC4651862.
10. DeBeer T, Jordan LC, Lee CA, Patel NJ, Pruthi S, Waddle SL, Griffin AD, DeBaun MR, Donahue MJ. Evidence of transfusion-induced reductions in cerebral capillary shunting in sickle cell disease. Am J Hematol. 2020;95(9):E228-E30. Epub 2020/05/12. doi: 10.1002/ajh.25863. PubMed PMID: 32390261; PMCID: PMC7652717.
Figures