0809
Model-based deconvolution for DSC-MRI: A comparison of accuracy, precision, and computational complexity of transit time distributions1Norwich Medical School, University of East Anglia, Norwich, United Kingdom, 2C.J. Gorter Centre for High Field MRI, Department of Radiology, Leiden University Medical Centre, Leiden, Netherlands
Synopsis
To identify the optimal model-based deconvolution process for DSC-MRI, four models of transit time distribution (TTD) were compared in terms of goodness and stability of fit, consistency of perfusion estimates, computational complexity, and robustness against noise. Although all models gave similar fits, the gamma function converged faster and more consistently to the global minimum, regardless of the initial guess. Moreover, it gave more accurate and precise perfusion estimates in the presence of noise. We conclude that the gamma function is the most suitable TTD model for perfusion analysis, and may prove useful in urgent clinical situations and multi-centre studies.
Introduction
Dynamic susceptibility-contrast magnetic resonance imaging (DSC-MRI)—the current standard for cerebral perfusion quantification—provides clinicians with crucial information for diagnosis, assessment, treatment planning, and monitoring of several cerebral pathologies, such as glioma1, ischemic stroke2, multiple sclerosis3, and Alzheimer’s disease4. The imaging technique involves acquiring a series of rapid T2 or T2*-weighted images during the first pass of a Gadolinium-based contrast agent (GBCA) bolus5. Model-dependent approaches for DSC-MRI analysis involve assuming a parametric transit time distribution (TTD), h, to characterise the passage of contrast agent through tissue microvasculature. Perfusion estimates are then obtained by fitting parametric models to the measured signal.Although several different functions for h have been proposed6-8, no study, to our knowledge, has compared them in terms of computational benefits and robustness against noise. In this study, we compare the relative utility of three already-published forms of h(t)—skewed-Gaussian6, gamma7, and gamma-variate8—as well as the newly proposed Weibull function, with the aim of identifying the most suitable TTD model for future clinical use.
Methods
DSC-MRI data were acquired at 1.5T (Siemens Vision/Symphony; Germany) with a gradient-echo echo-planar imaging sequence during the first pass of a 0.1 mmol/kg bolus of gadopentetate dimeglumine: TR/TE=1,000/47ms; acquisition time=60s; flip angle=30°; slice thickness=5mm; FOV=220×220mm; matrix=128×128. Signals were collected from normal appearing white matter (WM) in the frontal and parietal lobes and grey matter (GM) in the caudate nucleus of nine glioma patients.The arterial input function (AIF) was determined using a semi-automatic process9-11. Parametric signal equations for tissue microvasculature were derived from each TTD and then fitted to the measured signals using non-linear least squares fitting. Curve fits were run for 100 random guesses of the free parameters, which were uniformly distributed over their likely physiological ranges. The CBF and free parameters of h were determined from the fit with the lowest root-mean-square error (RMSE). The mean transit time (MTT) was calculated from the first moment of h and the cerebral blood volume (CBV) was calculated using the central volume principle12.
TTDs were compared in terms of multiple metrics. For each TTD, the goodness of fit of the estimated signals to the measured signal was evaluated using RMSE. The fit stability was quantified as the proportion of total fits converging to the global minimum. The consistency of perfusion estimates and computational complexity were evaluated by comparison to literature values and measurement of total time elapsed during curve-fitting, respectively.
Finally, the noise sensitivity of each parameter was quantified in terms of bias and dispersion via Monte-Carlo simulations for signal-to-noise ratios (SNRs) ranging from 10 to 100. We used high signal-to-noise ratio (SNR) in vivo data as ground truth, which are more representative of real physiological processes than simulated ground truths. To rank the models in terms of their accuracy and precision, the sum of the magnitude of relative bias and dispersion estimates was taken over all SNR values, for all combinations of parameter and tissue type.
Results
Figure 1 (a-d) gives typical fits of estimated signal to measured GM signal, along with the corresponding TTDs (e-h). Tables 1 and 2 give the means and standard deviations of performance metrics and perfusion parameters, respectively. Figures 2 and 3 show the relative bias and dispersion, respectively, in perfusion estimates for a range of different SNRs.Curve fits—with all functions—were excellent, with similar RMSEs (p>0.008, repeated measures ANOVA). The CBF, MTT, and CBV were similar (p>0.008) and congruent with previously reported values. The gamma models showed a higher fit stability and lower computational time (p<0.008) than other models.
In terms of accuracy, out of the six possible combinations (two tissue types, three perfusion parameters), the gamma and skewed-Gaussian model performed the best in three. However, the skewed-Gaussian function gave the least precise estimates in all combinations, where gamma gave the most precise estimates in three combinations: GM-CBV, WM-CBF, and WM-MTT. Relative bias and dispersion decreased with the increase of SNR, as expected, and approached an asymptote at an SNR of 40-45, with minimal improvement beyond this point.
Discussion
The work shows gamma function as the most suitable model for TTD. The gamma function provided faster convergence with more stable fits. Therefore, it can accelerate the fitting and may be particularly useful for clinical cases that require rapid analysis and decision-making, such as acute stroke.When both accuracy and precision of the perfusion estimates are considered, the gamma function is the most robust against noise. So, parameter estimates obtained with the gamma TTD are likely to be more reproducible than those of the other models and may prove better-suited to multi-centre studies. Additionally, our bias and dispersion analysis show that a minimum SNR of 40 is required to produce accurate and precise perfusion estimates in general.
Conclusion
We have shown that the gamma distribution is superior to other plausible TTD functions. Although all four functions gave perfusion estimates similar to published studies, the gamma TTD gave estimates that were more robust against noise. Moreover, it offers significantly faster convergence with higher stability of fit. Therefore, it can substantially decrease the overall computation time and perform reliably under noisy conditions.Acknowledgements
No acknowledgement found.References
1. Essig M, Shiroishi MS, Nguyen TB, et al. Perfusion MRI: the five most frequently asked technical questions. AJR American journal of roentgenology. 2013;200(1):24-34.
2. Law M, Yang S, Wang H, et al. Glioma grading: sensitivity, specificity, and predictive values of perfusion MR imaging and proton MR spectroscopic imaging compared with conventional MR imaging. AJNR American journal of neuroradiology. 2003;24(10):1989-1998.
3. Zivadinov R, Bergsland N, Stosic M, et al. Use of perfusion- and diffusion-weighted imaging in differential diagnosis of acute and chronic ischemic stroke and multiple sclerosis. Neurol Res. 2008;30(8):816-826.
4. Mattia D, Babiloni F, Romigi A, et al. Quantitative EEG and dynamic susceptibility contrast MRI in Alzheimer's disease: a correlative study. Clin Neurophysiol. 2003;114(7):1210-1216.
5. Jahng GH, Li KL, Ostergaard L, Calamante F. Perfusion magnetic resonance imaging: a comprehensive update on principles and techniques. Korean journal of radiology. 2014;15(5):554-577.
6. Koh TS, Zeman V, Darko J, et al. The inclusion of capillary distribution in the adiabatic tissue homogeneity model of blood flow. Physics in medicine and biology. 2001;46(5):1519-1538.
7. Mouridsen K, Friston K, Hjort N, Gyldensted L, Ostergaard L, Kiebel S. Bayesian estimation of cerebral perfusion using a physiological model of microvasculature. NeuroImage. 2006;33(2):570-579.
8. Larsson HBW, Vestergaard MB, Lindberg U, Iversen HK, Cramer SP. Brain capillary transit time heterogeneity in healthy volunteers measured by dynamic contrast-enhanced T(1) -weighted perfusion MRI. J Magn Reson Imaging. 2017;45(6):1809-1820.
9. Mouridsen K, Christensen S, Gyldensted L, Ostergaard L. Automatic selection of arterial input function using cluster analysis. Magnetic resonance in medicine. 2006;55(3):524-531.
10. Peruzzo D, Bertoldo A, Zanderigo F, Cobelli C. Automatic selection of arterial input function on dynamic contrast-enhanced MR images. Computer methods and programs in biomedicine. 2011;104(3):e148-157.
11. Yin J, Yang J, Guo Q. Evaluating the feasibility of an agglomerative hierarchy clustering algorithm for the automatic detection of the arterial input function using DSC-MRI. PloS one. 2014;9(6):e100308.
12. Perl W, Lassen NA, Effros RM. Matrix proof of flow, volume and mean transit time theorems for regional and compartmental systems. Bulletin of mathematical biology. 1975;37(6):573-588.
13. Sourbron SP, Buckley DL. Classic models for dynamic contrast-enhanced MRI. NMR in biomedicine. 2013;26(8):1004-1027.
14. Bjornerud A, Emblem KE. A fully automated method for quantitative cerebral hemodynamic analysis using DSC-MRI. Journal of cerebral blood flow and metabolism : official journal of the International Society of Cerebral Blood Flow and Metabolism. 2010;30(5):1066-1078.
15. Larsson HB, Hansen AE, Berg HK, Rostrup E, Haraldseth O. Dynamic contrast-enhanced quantitative perfusion measurement of the brain using T1-weighted MRI at 3T. J Magn Reson Imaging. 2008;27(4):754-762.
16. Ostergaard L, Smith DF, Vestergaard-Poulsen P, et al. Absolute cerebral blood flow and blood volume measured by magnetic resonance imaging bolus tracking: comparison with positron emission tomography values. Journal of cerebral blood flow and metabolism : official journal of the International Society of Cerebral Blood Flow and Metabolism. 1998;18(4):425-432.
17. Hakyemez B, Erdogan C, Ercan I, Ergin N, Uysal S, Atahan S. High-grade and low-grade gliomas: differentiation by using perfusion MR imaging. Clin Radiol. 2005;60(4):493-502.
18. Ibaraki M, Ito H, Shimosegawa E, et al. Cerebral vascular mean transit time in healthy humans: A comparative study with PET and dynamic susceptibility contrast-enhanced MRI. Journal of cerebral blood flow and metabolism : official journal of the International Society of Cerebral Blood Flow and Metabolism. 2007;27:404-413.
19. Chou YC, Teng MM, Guo WY, Hsieh JC, Wu YT. Classification of hemodynamics from dynamic-susceptibility-contrast magnetic resonance (DSC-MR) brain images using noiseless independent factor analysis. Med Image Anal. 2007;11(3):242-253.
20. Helenius J, Perkiö J, Soinne L, et al. Cerebral hemodynamics in a healthy population measured by dynamic susceptibility contrast MR imaging. Acta Radiol. 2003;44(5):538-546.
21. Zhu XP, Li KL, Jackson A. Dynamic Contrast-Enhanced MRI in Cerebral Tumours. In: Jackson A, Buckley DL, Parker GJM, eds. Dynamic Contrast-Enhanced Magnetic Resonance Imaging in Oncology. Berlin, Heidelberg: Springer Berlin Heidelberg; 2005:117-143.
22. Sourbron S, Ingrisch M, Siefert A, Reiser M, Herrmann K. Quantification of cerebral blood flow, cerebral blood volume, and blood-brain-barrier leakage with DCE-MRI. Magnetic resonance in medicine. 2009;62(1):205-217.
23. Rausch M, Scheffler K, Rudin M, Radü EW. Analysis of input functions from different arterial branches with gamma variate functions and cluster analysis for quantitative blood volume measurements. Magnetic Resonance Imaging. 2000;18(10):1235-1243.
Figures
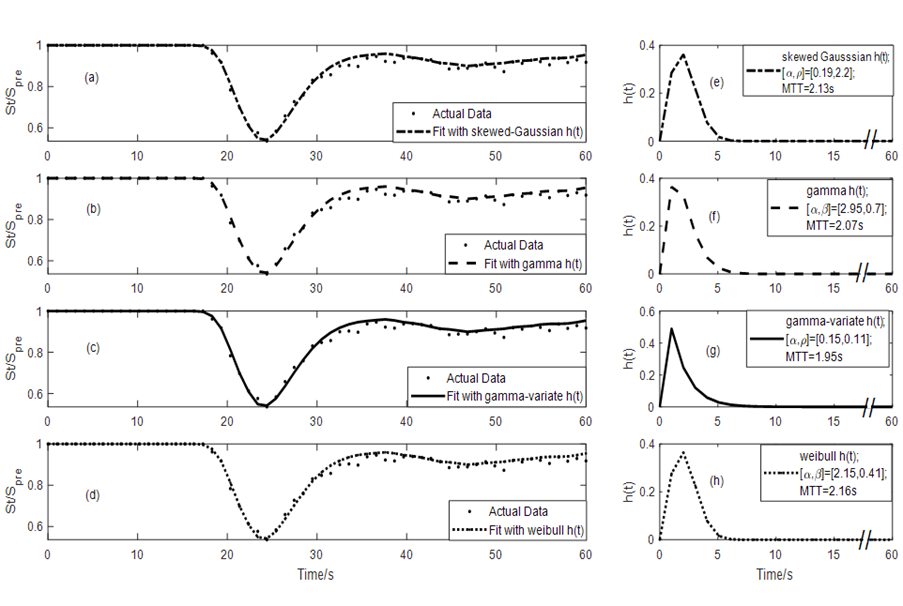
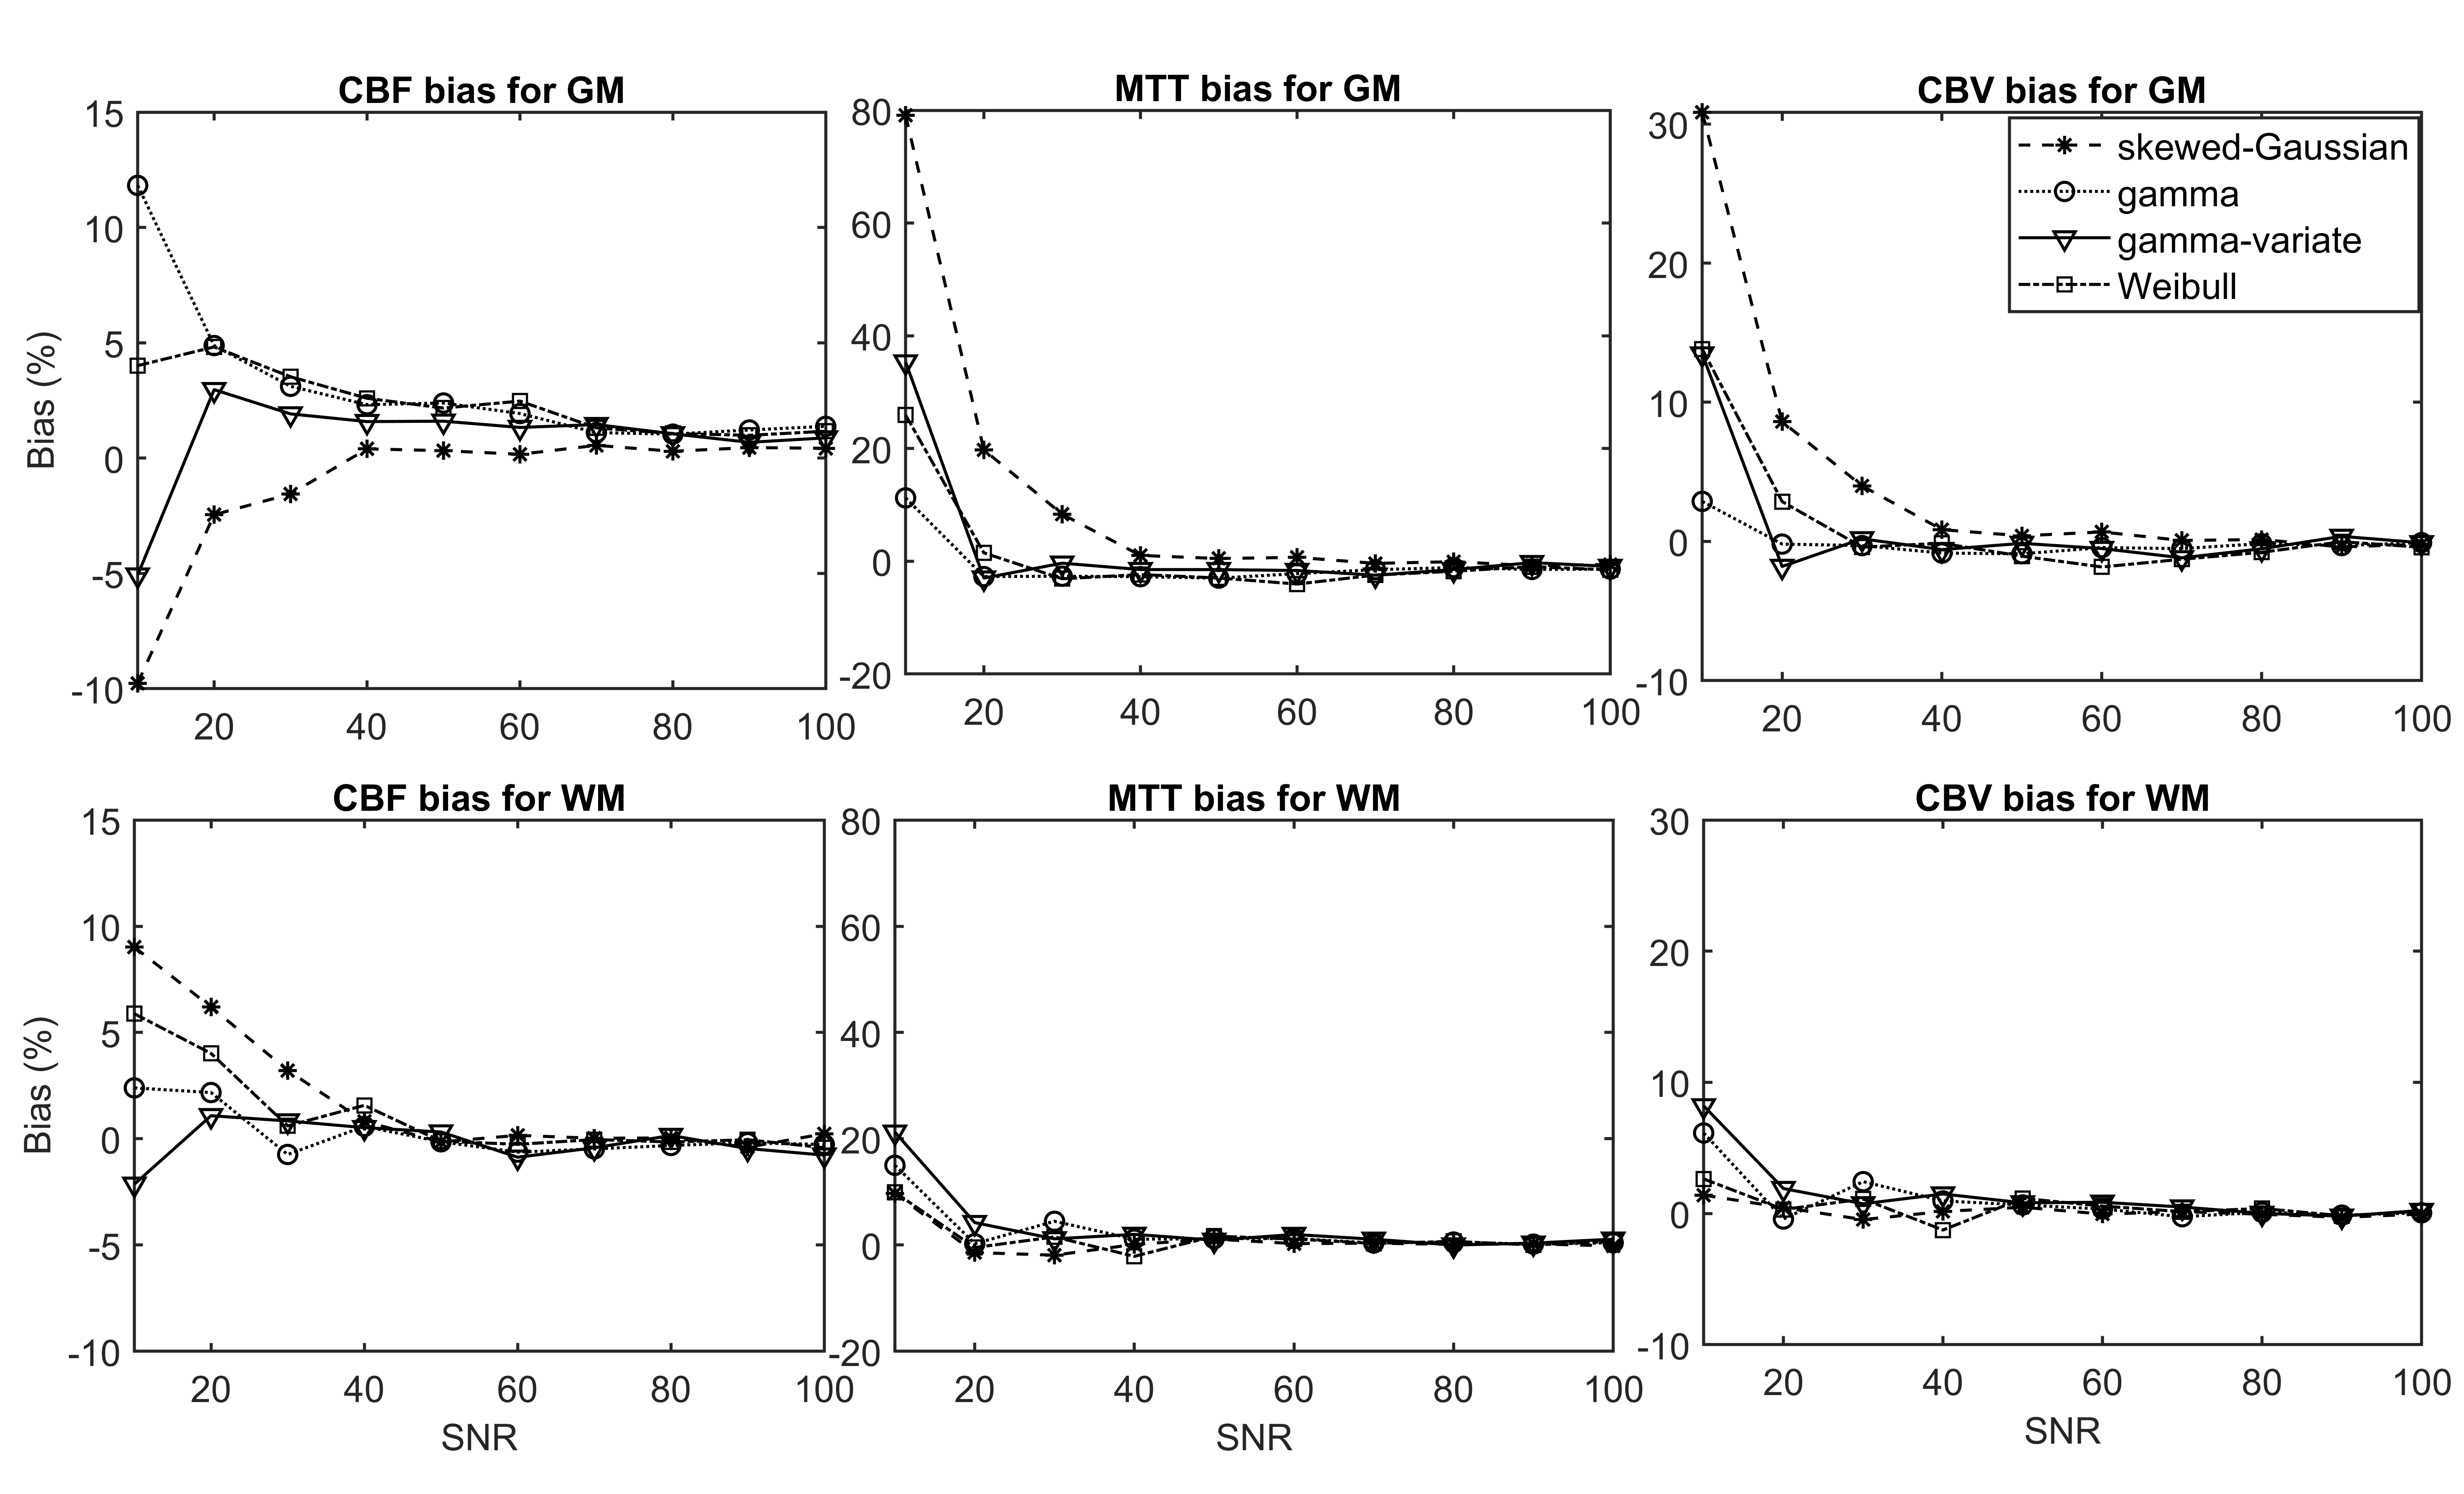
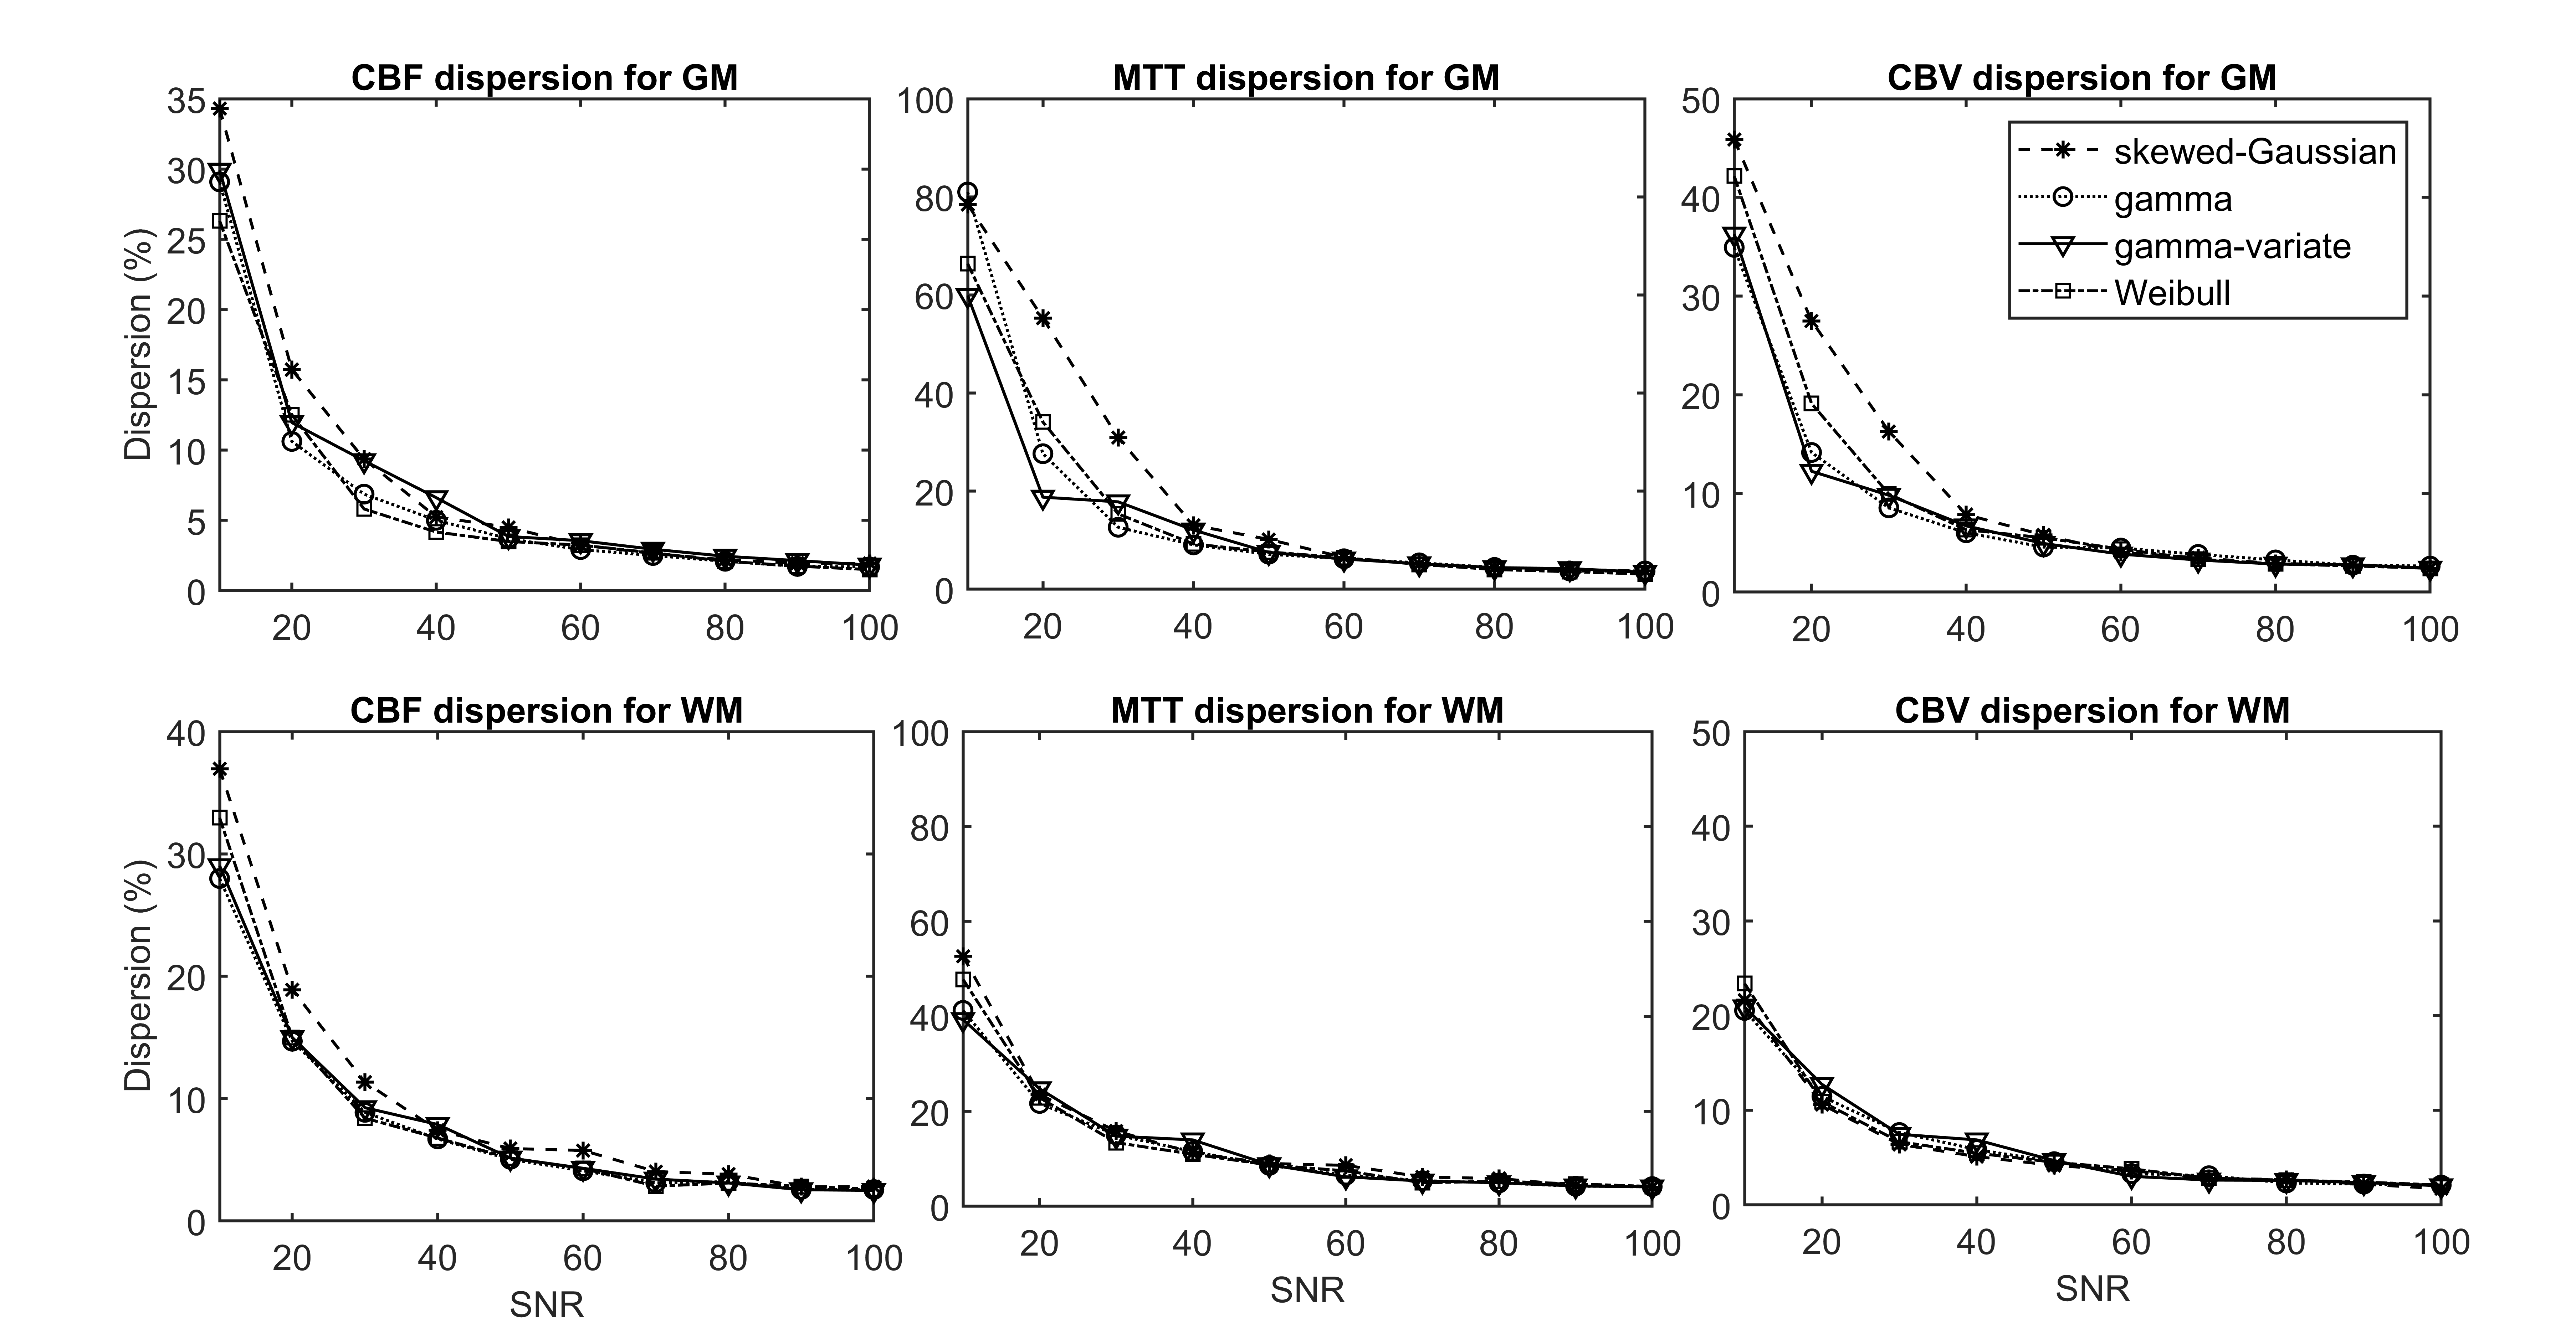
Figure 3: Relative dispersion in perfusion estimates for all four models of transit time distribution (TTD) as a function of signal-to-noise ratio (SNR). All models show similar trends in dispersion: the spread of the parameter estimates decreases with increasing SNR. The gamma and gamma-variate functions tend to perform better for noisy grey matter (GM) signals. Abbreviations: CBF, cerebral blood flow; CBV, cerebral blood volume; MTT, mean transit time.

Table 1: Mean (Standard deviation) of root-mean-square error (RMSE), success rate (percentage of successful fits), and computation time (Tcomp) obtained with each transit time distribution (TTD) for grey matter (GM) and white matter (WM)

Table 2: Mean (Standard deviation) of parameter estimates obtained with each transit time distribution (TTD), h