0807
Investigating Cerebral Perfusion with High Resolution Hyperpolarized [1-13C]Pyruvate MRI1Radiology and Biomedical Imaging, University of California San Francisco, San Francisco, CA, United States, 2Bioengineering, University of California Berkeley, Berkeley, CA, United States, 3MR Research Center, Clinical Medicine, Aarhus University, Aarhus, Denmark
Synopsis
Acquiring high resolution 7.5 mm2 hyperpolarized [1-13C]pyruvate brain MRI allows for finer spatial delineation of brain structures and can be used to obtain cerebral perfusion parameters. In the healthy volunteers studied, pyruvate rCBV and rCBF were positively correlated to ASL perfusion values. Hyperpolarized pyruvate MRI can be used to assess cerebral metabolism and perfusion within the same study.
Introduction
Hyperpolarized [1-13C]pyruvate has been used to non-invasively image metabolism in preclinical1 and clinical research applications2, but the acquired resolution is typically coarse (15-25 mm2 for clinical applications) to maximize SNR for downstream metabolites. A multi-resolution acquisition3, with higher resolution for pyruvate and coarser resolutions for metabolic products, maintains SNR while taking advantage of the high injected pyruvate signal. Higher resolution dynamic pyruvate images provide finer spatial delineation of brain structures and were investigated in this study to provide cerebral perfusion parameters. Assessing both metabolism and perfusion within a single hyperpolarized MRI could be valuable for monitoring changes in disease progression. To assess the cerebral perfusion of hyperpolarized pyruvate, multi-resolution [1-13C]pyruvate studies were acquired in healthy human brains and the resulting pyruvate perfusion parameters were compared to proton ASL perfusion values.Methods
Hyperpolarized [1-13C]pyruvate data from two healthy subjects were acquired with a multi-resolution metabolite-selective EPI acquisition3. A volume transmit 13C coil was used for RF excitation with a 24 channel array for reception (RAPID Biomedical, Germany). Pyruvate, lactate and bicarbonate flip angles were 20/30/30 respectively, and the slice thickness was 15 mm. The in-plane spatial resolution for each metabolite was changed by independently scaling the encoding gradients, resulting in 7.5x7.5 mm2 resolution for pyruvate and 15x15 mm2 resolution for lactate and bicarbonate. Twenty time points were acquired with a 3 second temporal resolution for a total scan time of one minute. For anatomic reference and proton perfusion, 3D T1 IR-SPGR, T2 FSE, and 3D ASL datasets were acquired. The 3D pulsed continuous ASL parameters were TR = 4846 ms, TE = 10.5 ms, FOV = 256 mm, 2x2x4 mm3 resolution, BW = 125 kHz, and TI = 2025 ms. The EPI data was reconstructed and corrected using methods described in Gordon et al3 and denoised using patch-based higher-order singular value decomposition4.Hyperpolarized pyruvate perfusion parameters were obtained by analyzing the dynamic pyruvate images. Up to four voxels were automatically selected to fit an arterial input function5. Relative CBV (rCBV) was calculated by taking the integral of the dynamic pyruvate signal. Relative CBF (rCBF) and mean transit time (MTT) were calculated using block-circulant singular value decomposition and corrected for depolarization6. Kinetic rate values for each voxel were computed using an inputless two-site model to generate quantitative maps of pyruvate-to-lactate conversion (kPL)7. ASL perfusion maps were resampled to the pyruvate voxel size using tri-linear interpolation. White matter masks were segmented on T2 FSE images, the cortex was excluded using the automated anatomical atlas 3, and voxels with at least 10% white matter were included in the correlation analysis to exclude large cerebral blood vessels8. Pearson correlation coefficients were calculated for proton ASL and the 13C-derived metrics kPL, pyruvate rCBV, rCBF, and MTT.
Results and Discussion
Hyperpolarized [1-13C]pyruvate dynamic images from a representative brain study are shown in Figure 1. Pyruvate first arrived in the cerebral arteries, then by the next 3 second frame pyruvate signal was observed in the superior sagittal and transverse dural venous sinuses. Approximately 15 seconds after arrival, the arterial pyruvate signal disappeared while the venous pyruvate signal remained visible towards the end of the acquisition. Figure 2 shows dynamic pyruvate signals from artery, white matter, and gray matter voxels along with the fitted arterial input function. The pyruvate signal was highest in the artery and the gray matter showed higher pyruvate signal than in white matter. The peak signal times for each voxel were also staggered similarly, with the artery signal peaking first, followed by gray and then white matter signals. These perfusion characteristics were similar to the ASL perfusion maps and [1-13C]pyruvate rCBF in Figure 3, which showed higher perfusion in the gray matter than in the white matter. The pyruvate rCBF maps also showed high flow values in the middle cerebral arteries and superior sagittal sinus.To compare perfusion parameters quantitatively, correlation plots and correlation coefficients for voxels with at least 10% white matter are shown in Figures 4 and 5 for the two subjects. ASL was positively correlated with pyruvate rCBV and rCBF for both subjects (correlation coefficients >=0.35, p-values <10-4). These positive correlations indicate some relationship between the two perfusion measures, but the low coefficient values may be due to pyruvate metabolism or receiver coil profiles. To a lesser extent, kPL was negatively correlated with pyruvate rCBV, rCBF and MTT for both subjects, indicating that the calculated pyruvate to lactate conversion rates were lower in voxels with fast-arriving, higher concentrations of pyruvate (correlation coefficients >=0.2, p-values <10-4). The average pyruvate MTTs were 5.6 and 7.7 seconds for the two subjects, which are near the range of normal values of cerebral MTT calculated from DSC-MRI9.
Conclusion
High resolution dynamic pyruvate images exhibit finer spatial delineation of brain structures and can be used to obtain cerebral perfusion parameters. Pyruvate rCBV and rCBF were positively correlated to proton ASL perfusion values, indicating a relationship between the two perfusion measures. While a small sample size (N=2), this hyperpolarized 13C study showed that acquiring pyruvate with finer resolution enables the assessment of both cerebral metabolism and perfusion within a single imaging study.Acknowledgements
This research was supported by NIH grants P01 CA118816, U01 EB026412, P41 EB013598, and the UCSF NICO project.References
1. Golman K, Thaning M. Real-time metabolic imaging. Proceedings of the National Academy of Sciences. 2006 Jul 25;103(30):11270-5.
2. Nelson SJ, Kurhanewicz J, Vigneron DB, Larson PE, Harzstark AL, Ferrone M, Van Criekinge M, Chang JW, Bok R, Park I, Reed G. Metabolic imaging of patients with prostate cancer using hyperpolarized [1-13C] pyruvate. Science translational medicine. 2013 Aug 14;5(198):198ra108-.
3. Gordon JW, Autry AW, Tang S, Graham JY, Bok RA, Zhu X, Villanueva‐Meyer JE, Li Y, Ohilger MA, Abraham MR, Xu D. A variable resolution approach for improved acquisition of hyperpolarized 13C metabolic MRI. Magnetic Resonance in Medicine. 2020 Dec;84(6):2943-52.
4. Kim Y, Chen H, Autry A, et al. Denoising of hyperpolarized 13C MR images of the human brain using patch-based higher-order singular value decomposition. Magnetic Resonance in Medicine. 2021 Nov;86(5):2497-2511.
5. Peruzzo D, Bertoldo A, Zanderigo F, et al. Automatic selection of arterial input function on dynamic contrast-enhanced MR images. Computational Methods Programs Biomedical 2011;104:e148-e157.
6. Johansson E, Mansson S, Wirestam R, et al. Cerebral perfusion assessment by bolus tracking using hyperpolarized 13C. Magnetic Resonance in Medicine. 2004;51:464-472.
7. Mammoli D, Gordon J, Autry A, Larson PE, Li Y, Chen HY, Chung B, Shin P, Van Criekinge M, Carvajal L, Slater JB. Kinetic modeling of hyperpolarized carbon-13 pyruvate metabolism in the human brain. IEEE transactions on medical imaging. 2019 Jul 2;39(2):320-7.
8. Rolls ET, Huang C, Lin C, Feng J, Joliot M. Automated anatomical labelling atlas 3. Neuroimage. 2020;206:116189.
9. Ibaraki M, Hiroshi I, Shimosegawa E, et al. Cerebral vascular mean transit time in healthy humans: a comparative study with PET and dynamic susceptibility contrast-enhanced MRI. Journal of Cerebral Blood Flow & Metabolism. 2007 Feb;27(2):404-13.
Figures
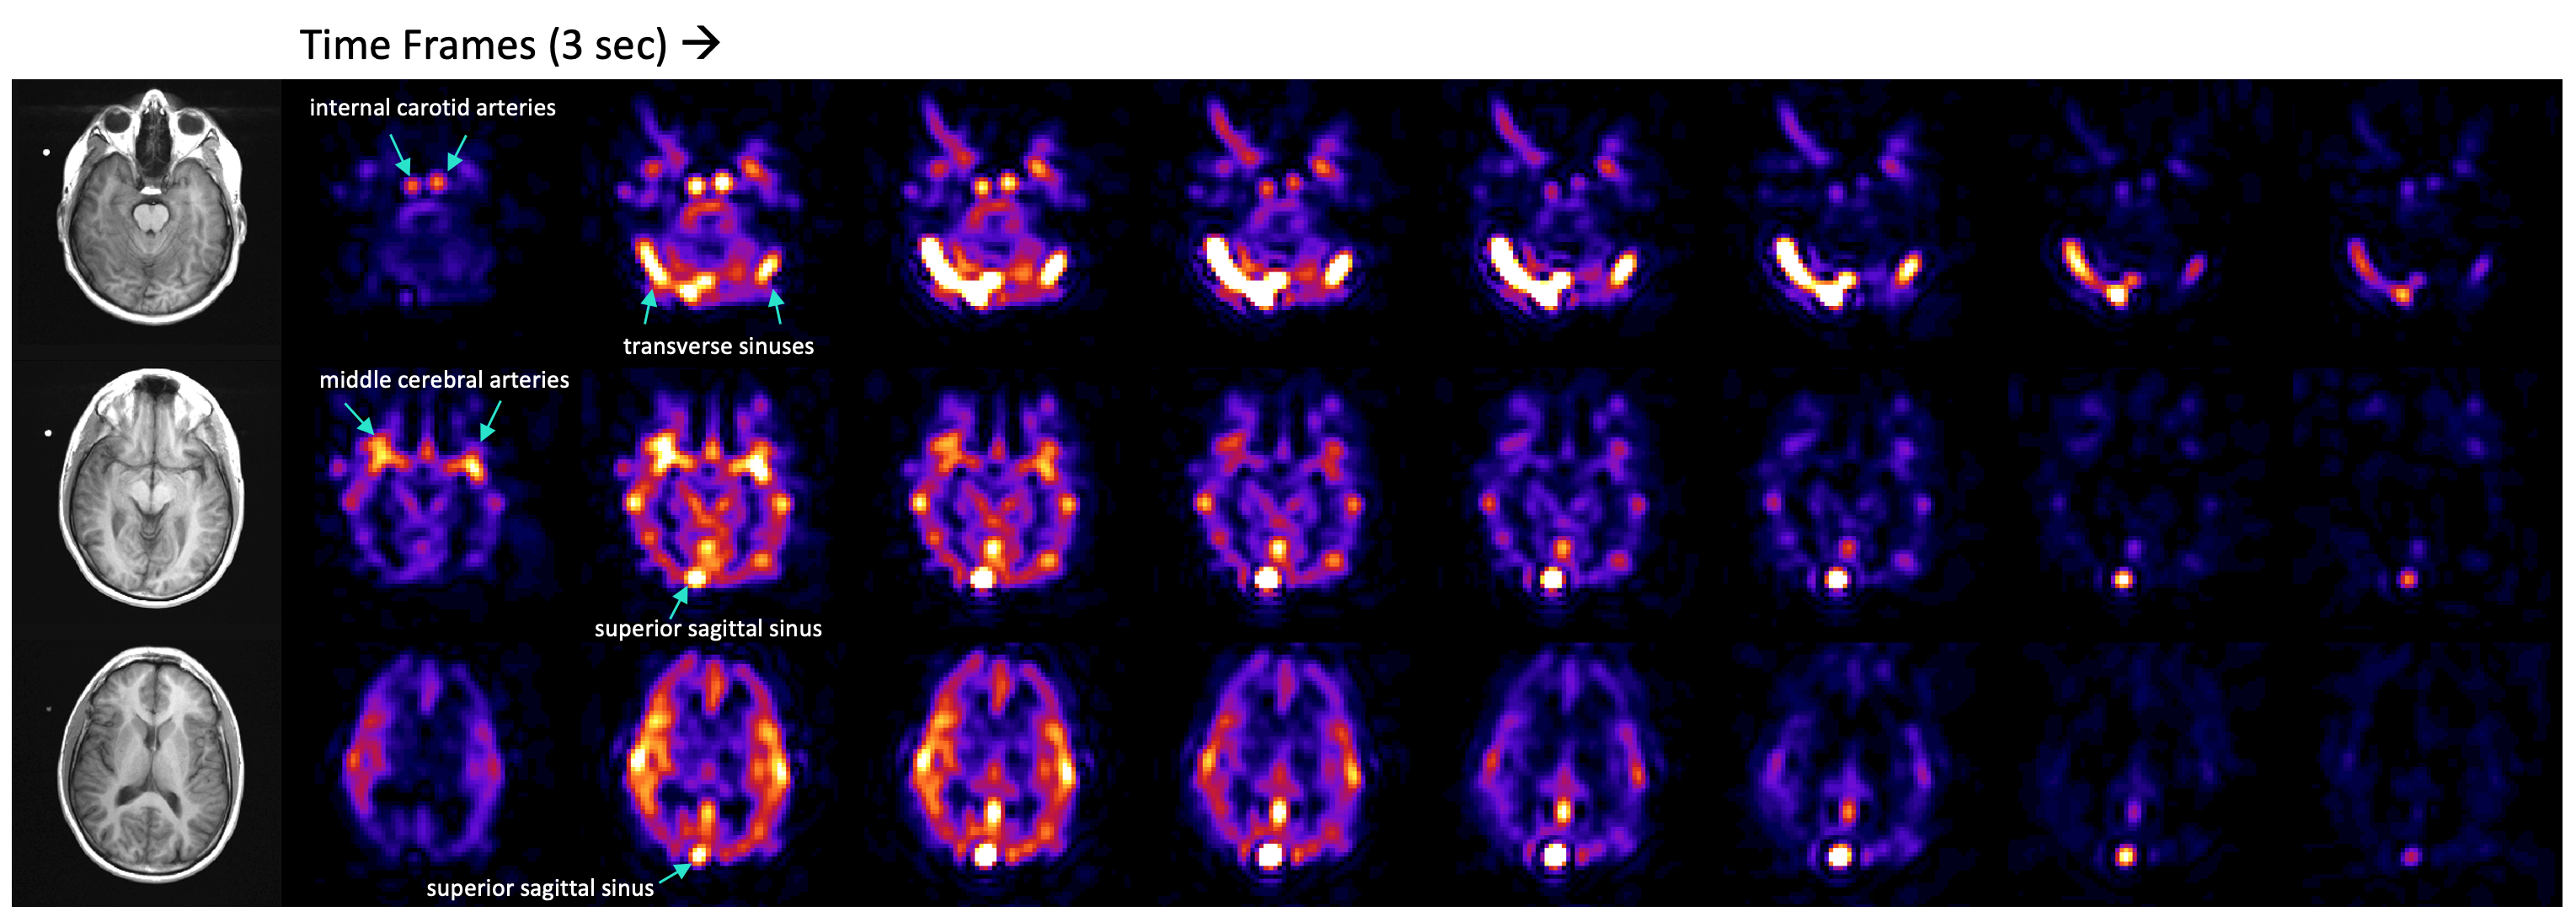
Figure 1. Hyperpolarized [1-13C]pyruvate dynamic images of pyruvate delivery in the brain with reference proton images. The blue arrows point out arrival of pyruvate in the anterior cerebral circulation and transit into the superior sagittal and transverse dural venous sinuses. The arterial pyruvate signal disappeared approximately 15 seconds after arrival, while the venous pyruvate signal remained high and visible towards the end of the acquisition. Images were zerofilled once for display.
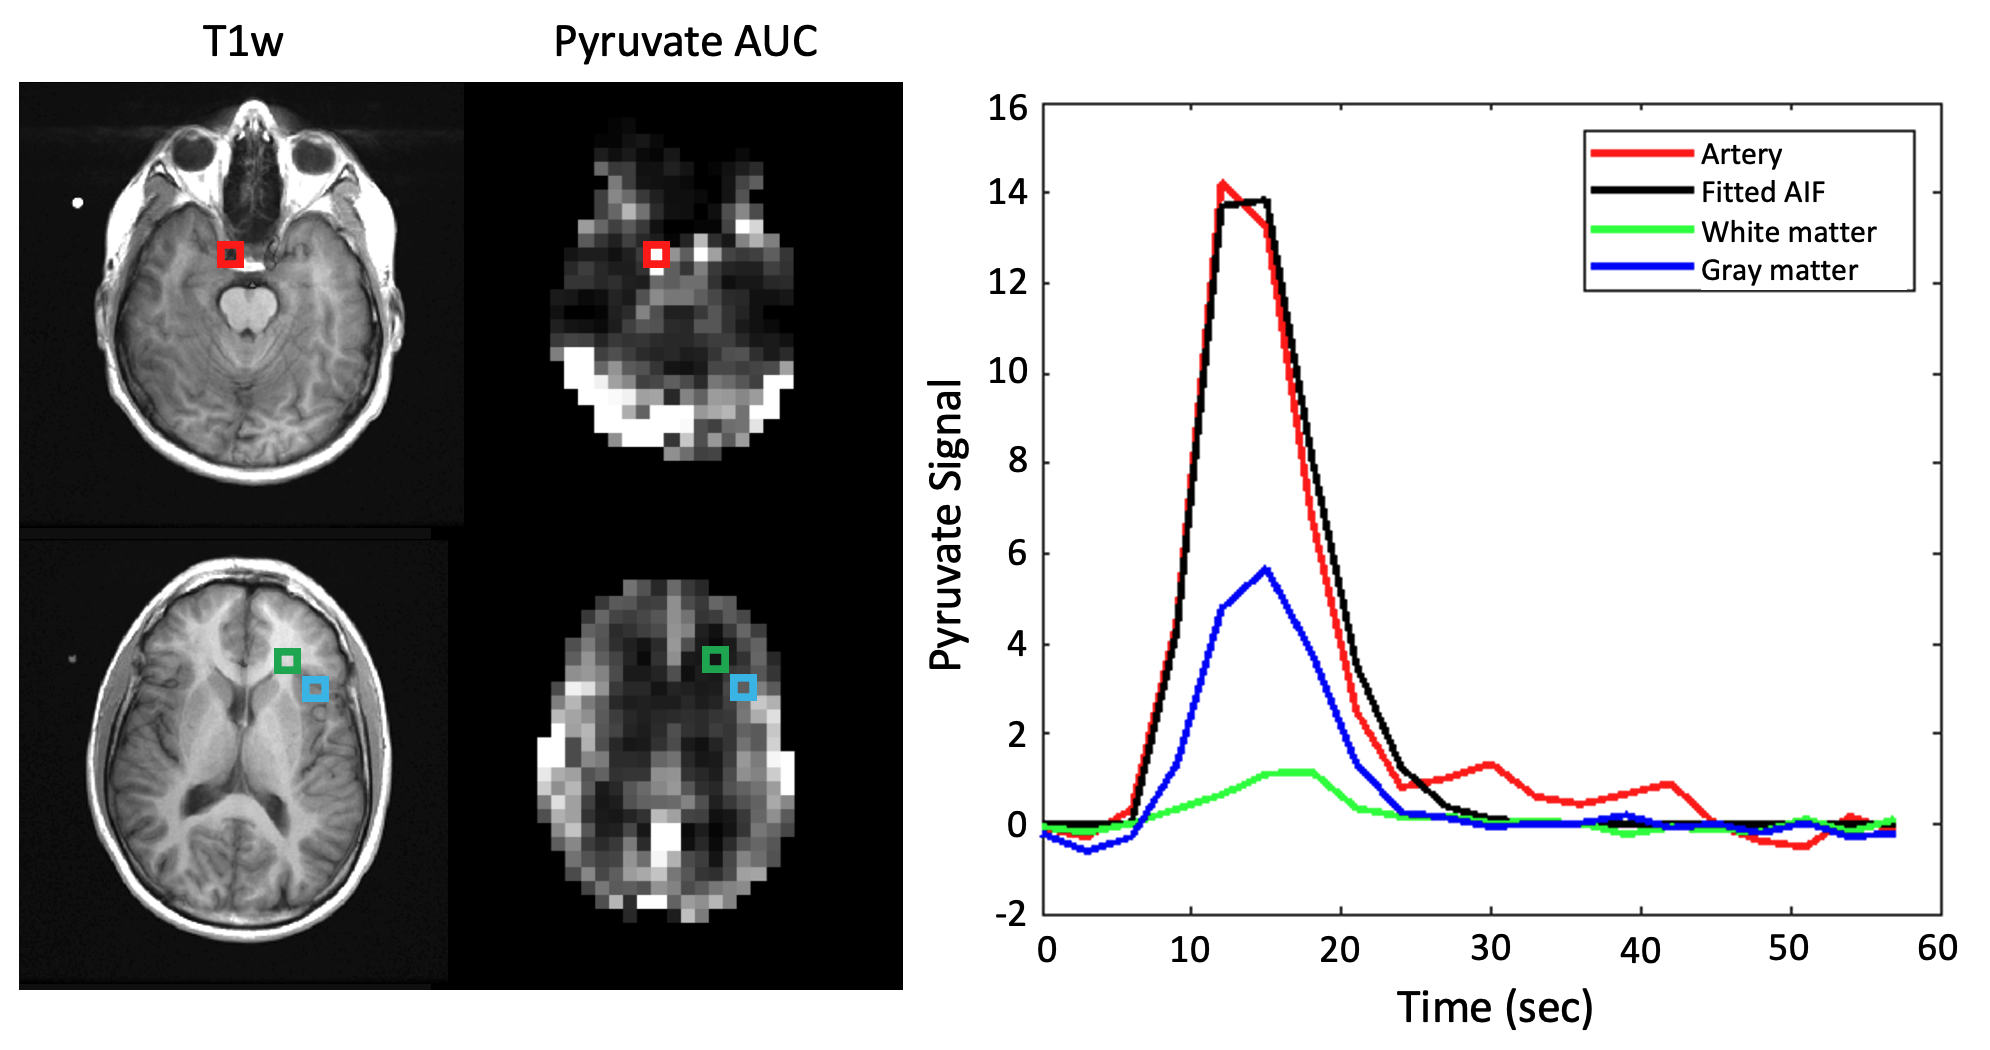
Figure 2. Dynamic [1-13C]pyruvate signals from artery, white matter, and gray matter voxels. A gamma variate function was fit to the pyruvate arterial signal to obtain the arterial input function. Voxel placement is shown on T1-weighted and pyruvate area under the curve images. The pyruvate signal was highest in the artery and the gray matter showed higher pyruvate signal than in the white matter. The peak signal times for each voxel were also staggered similarly, with the artery signal peaking first, then gray and white matter signals.
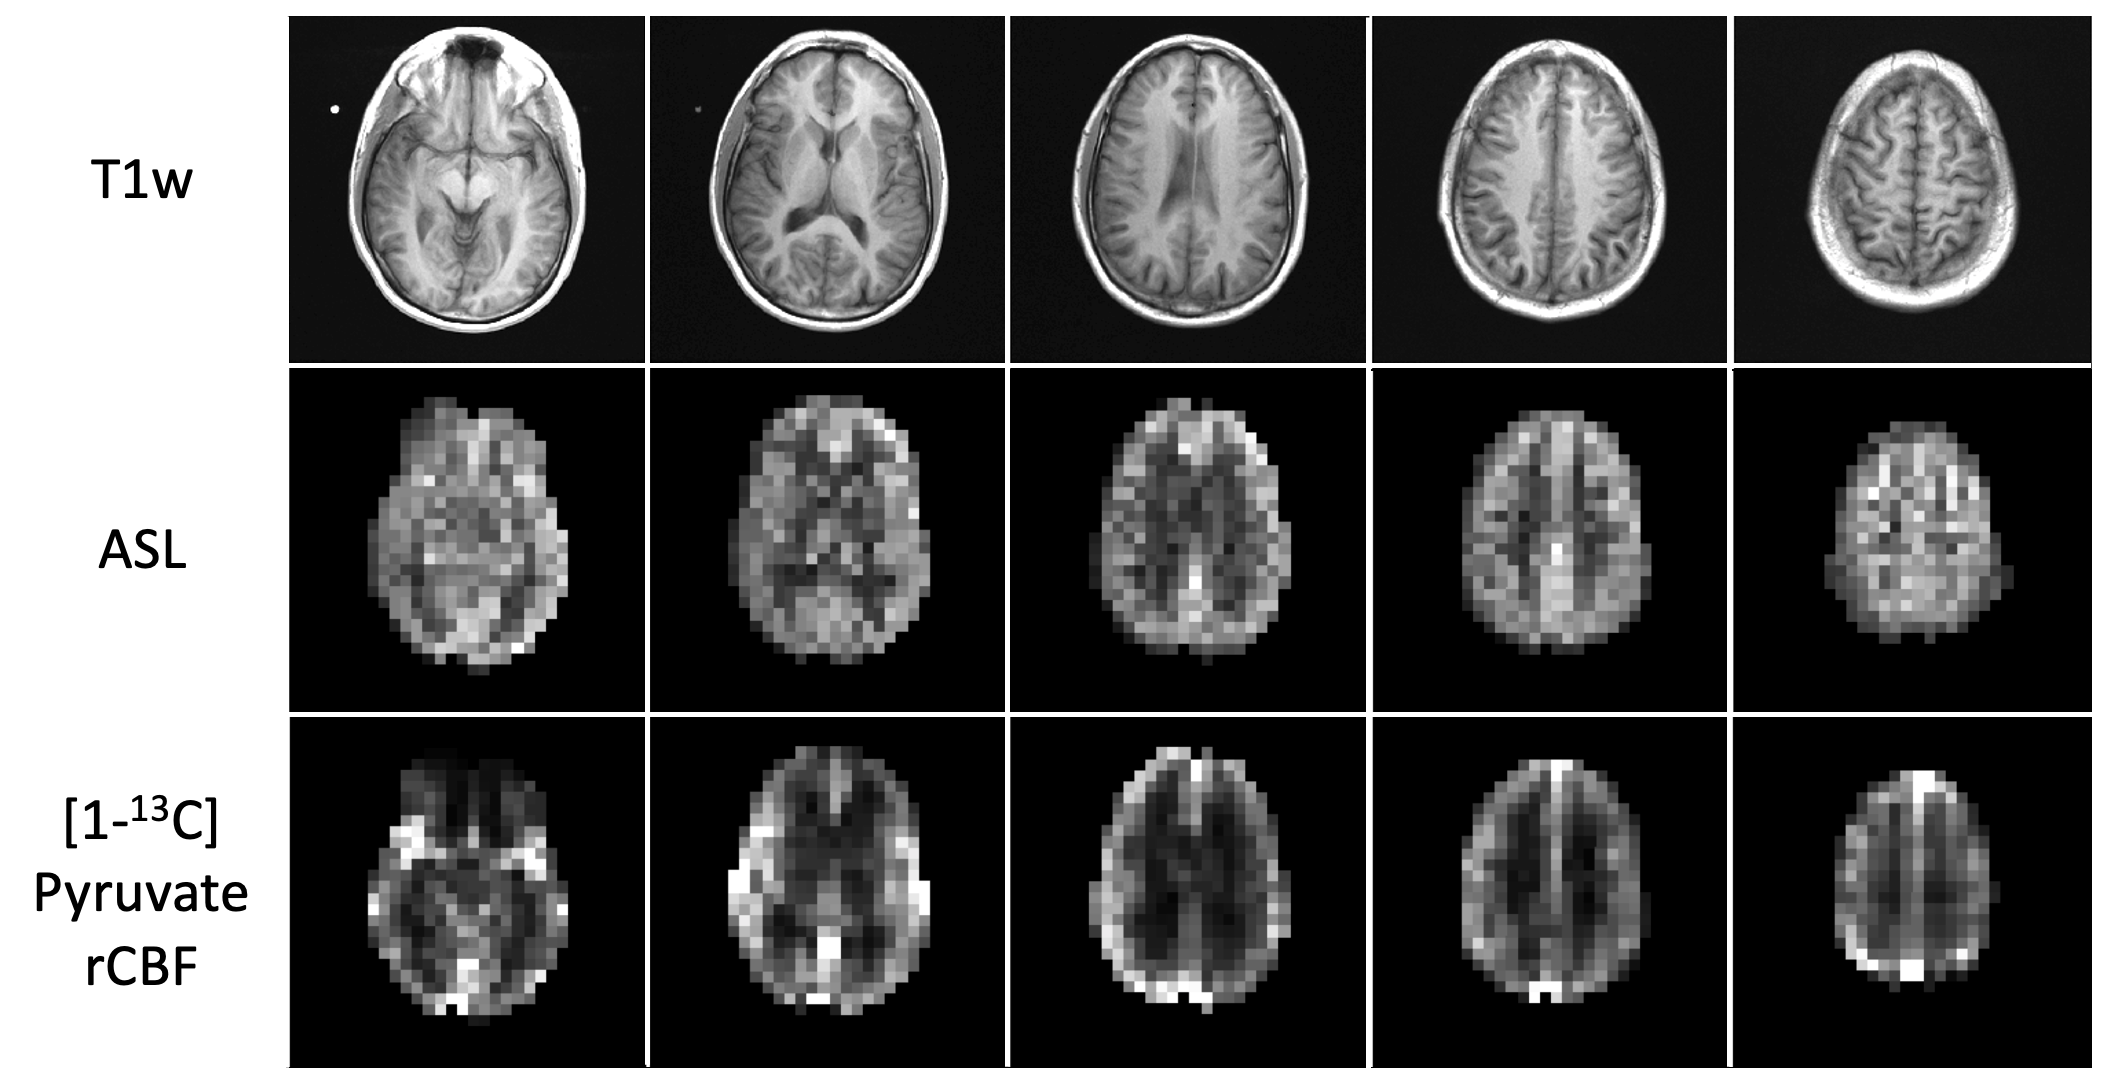
Figure 3. ASL perfusion maps resampled to 7.5 x 7.5 x 15 mm3 resolution and [1-13C]pyruvate rCBF in a normal human brain with T1-weighted anatomical reference MRI. Compared to the ASL maps, the pyruvate rCBF maps were dominated by high values in the middle cerebral arteries and superior sagittal sinus. Both the ASL and pyruvate rCBF maps demonstrated higher values in the gray matter than in the white matter.
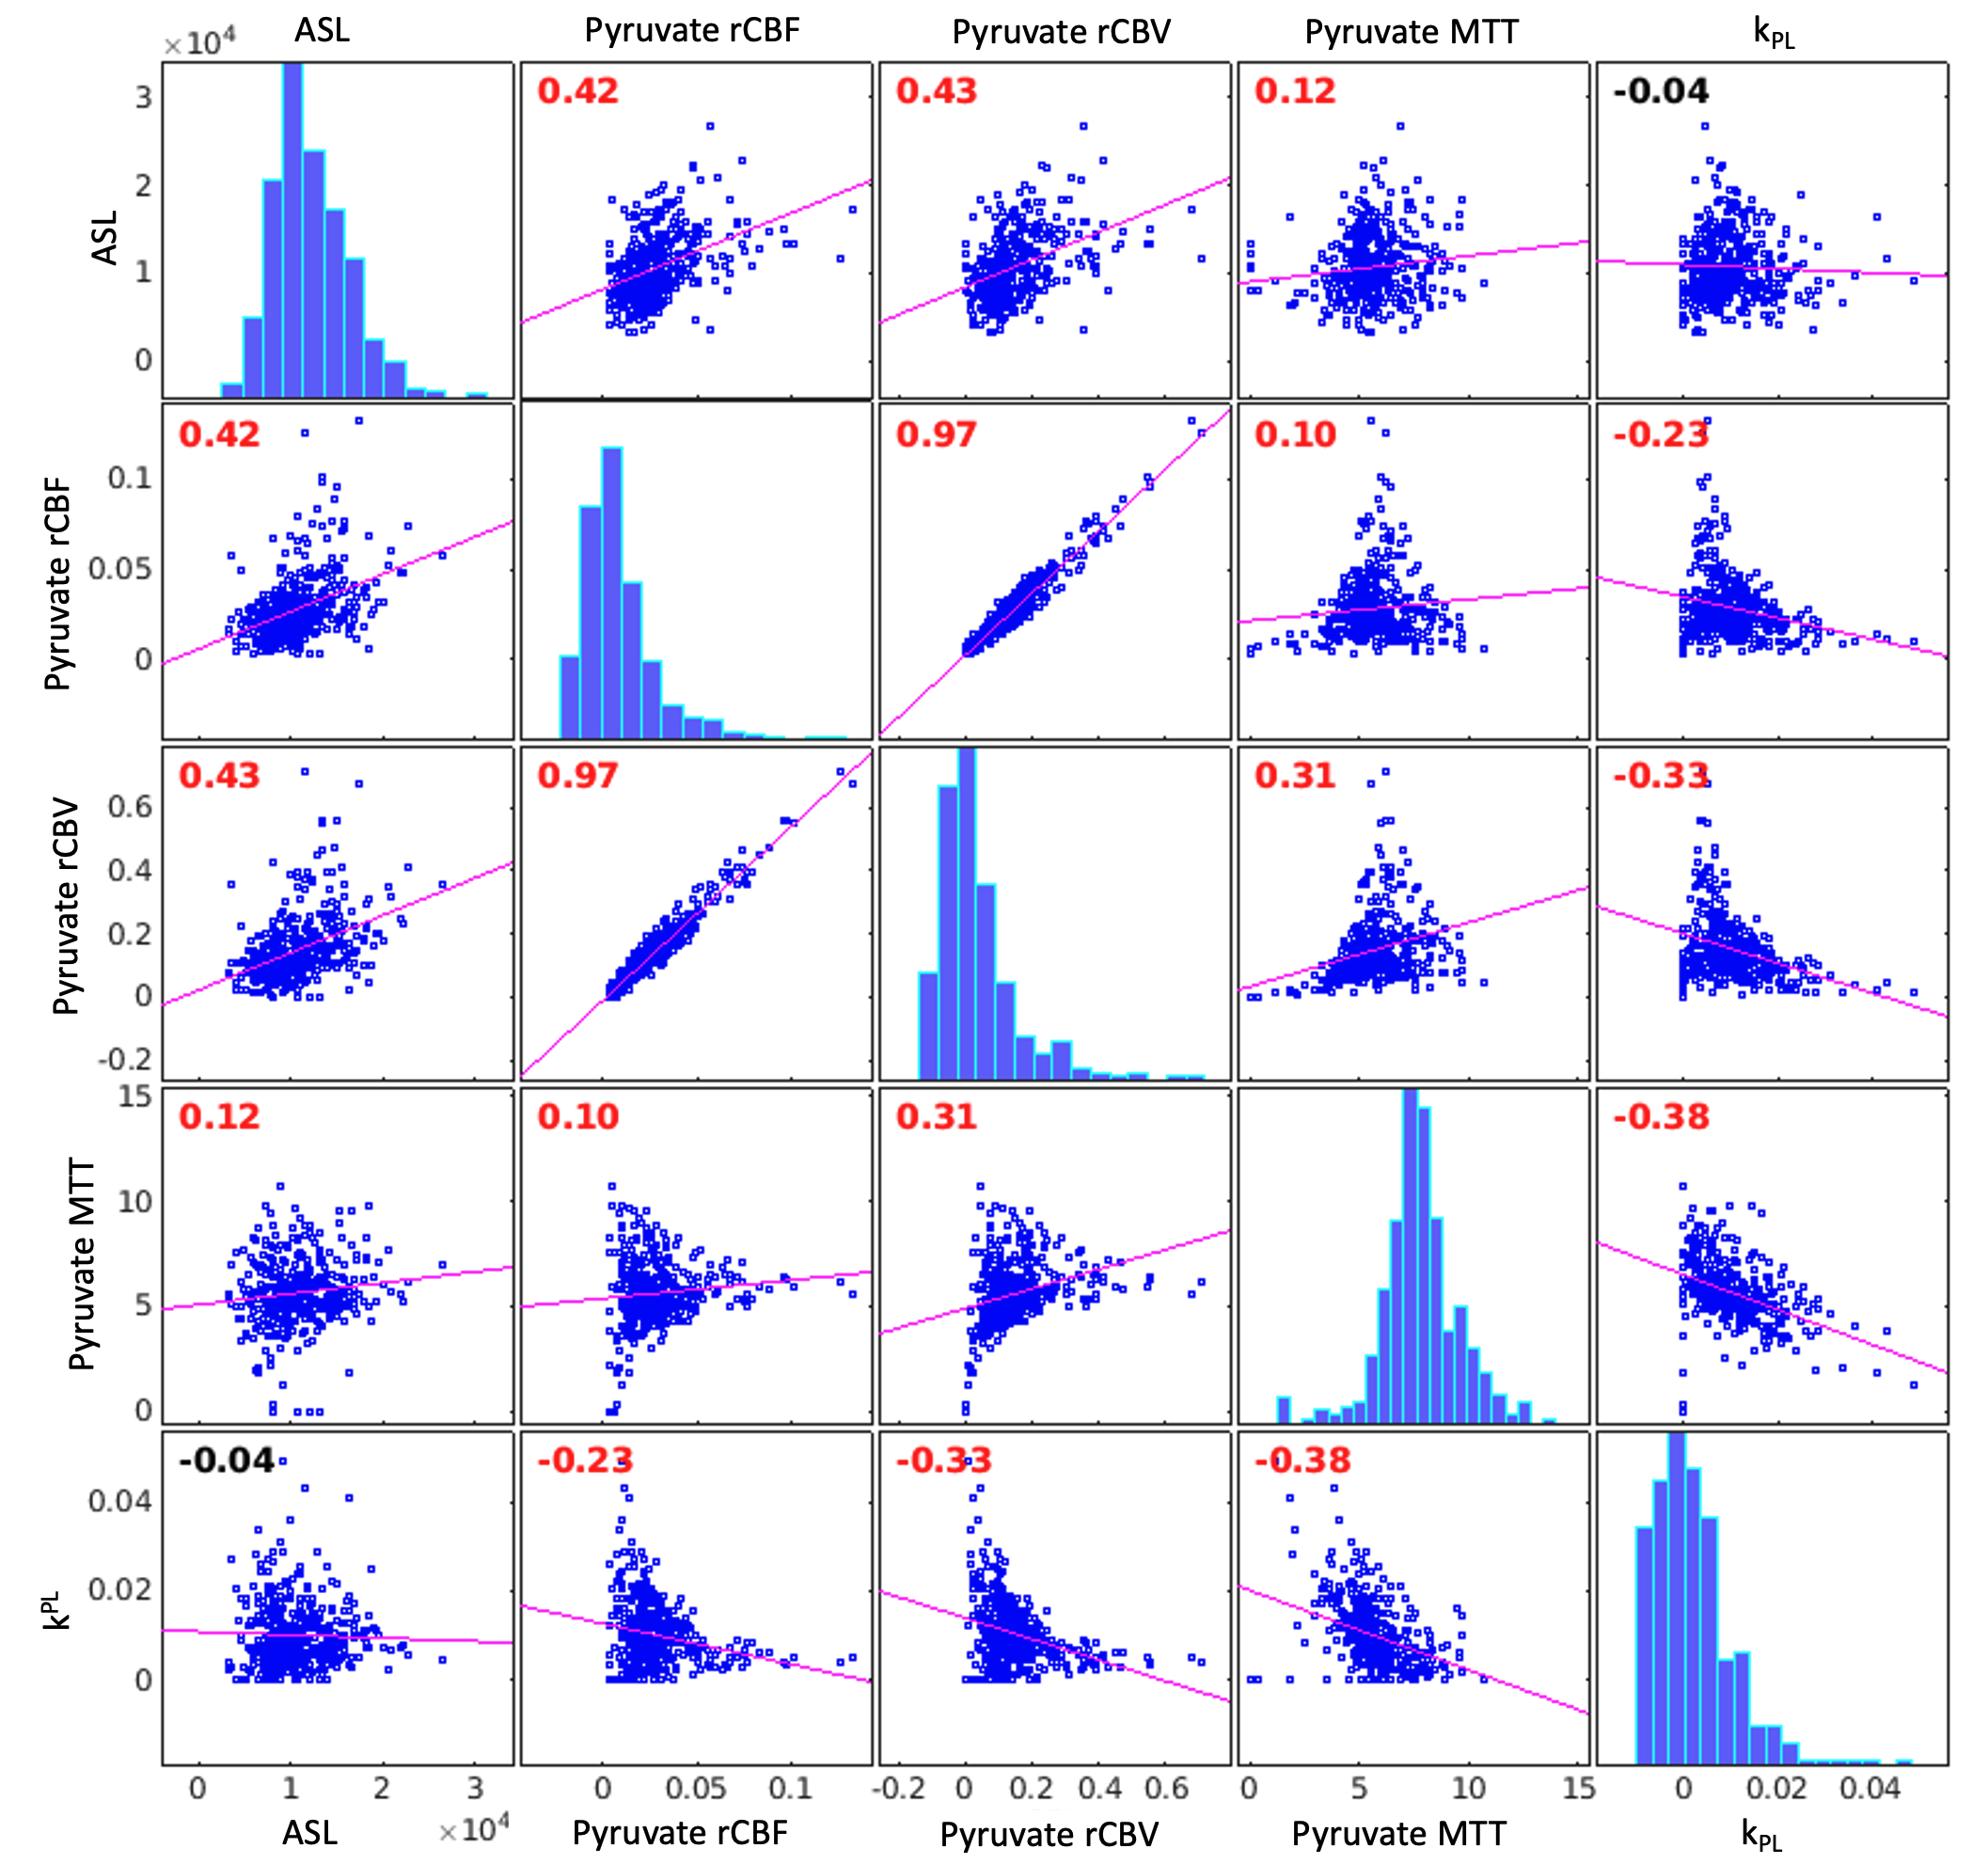
Figure 4. Subject 1 correlation plots and Pearson correlation coefficients for ASL, pyruvate rCBV, pyruvate rCBF, pyruvate MTT, and kPL. Correlation coefficients are labeled in red if significantly different from zero. ASL was positively correlated with pyruvate rCBV, rCBF and MTT, while kPL was negatively correlated with pyruvate rCBV, rCBF and MTT in this subject. The average pyruvate MTT was 5.6 seconds.
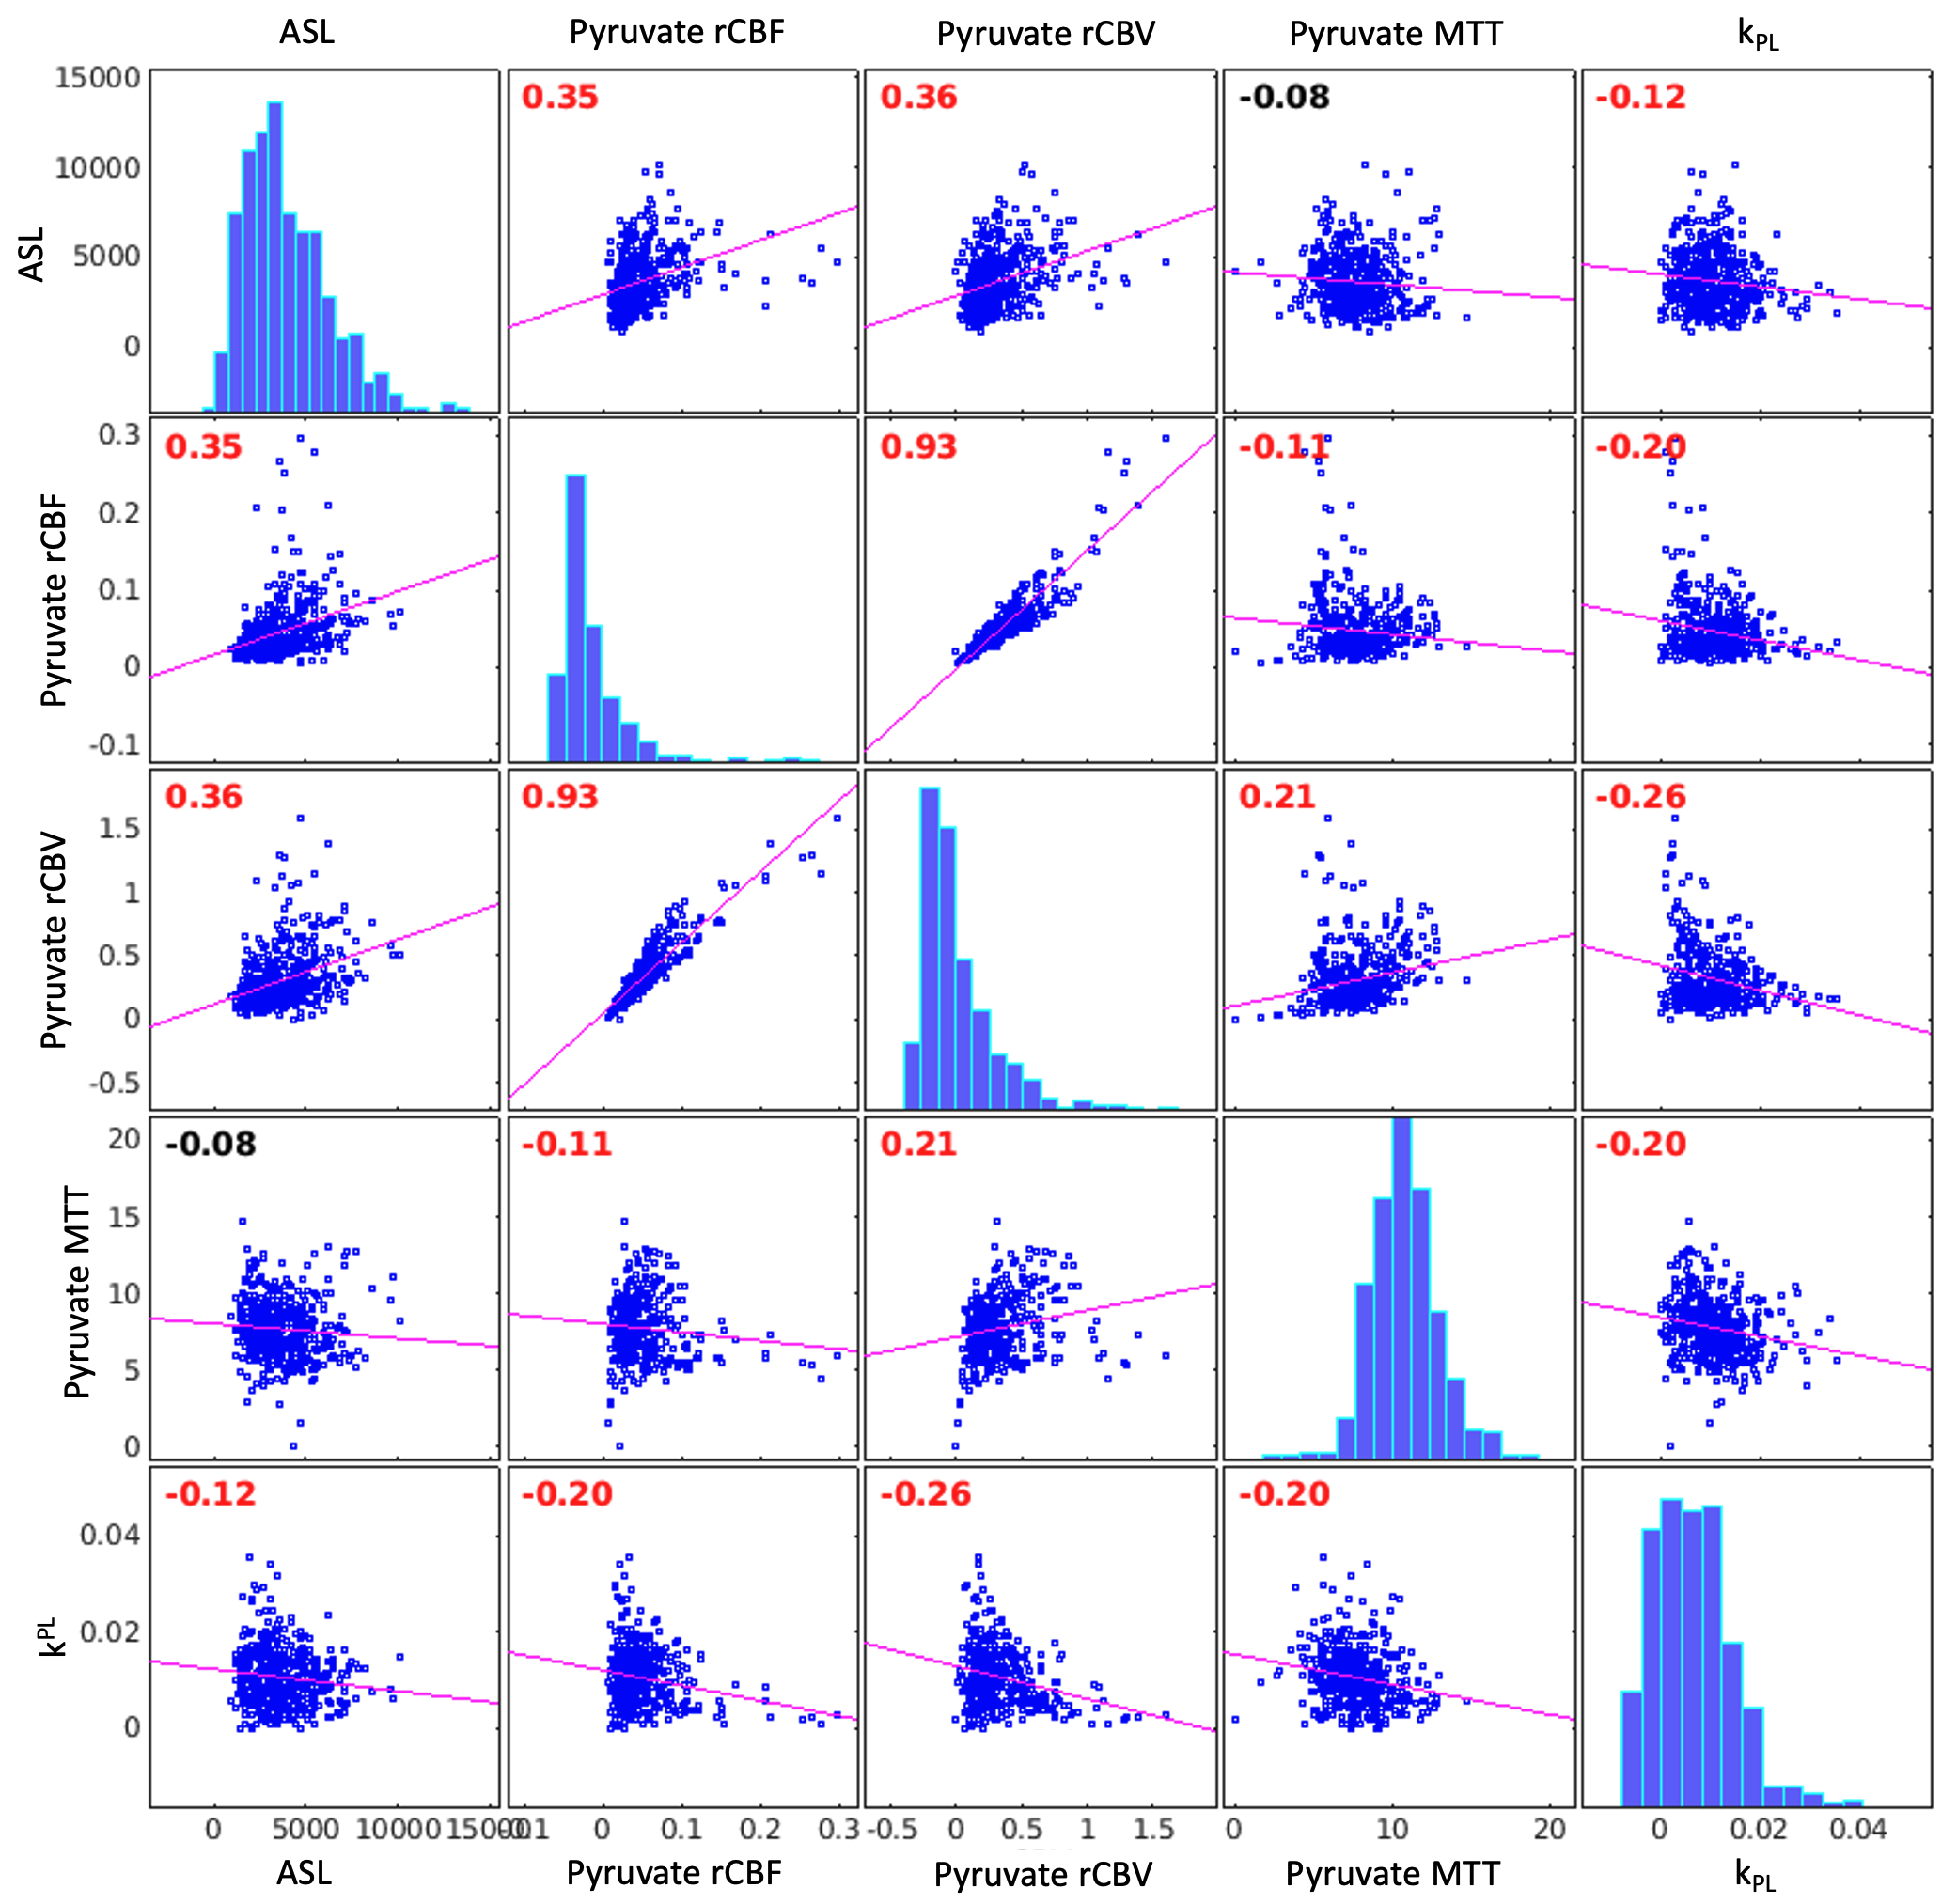
Figure 5. Subject 2 correlation plots and Pearson correlation coefficients for ASL, pyruvate rCBV, pyruvate rCBF, pyruvate MTT, and kPL. Correlation coefficients are labeled in red if significantly different from zero. ASL was positively correlated with pyruvate rCBV and rCBF, while kPL was negatively correlated with ASL, pyruvate rCBV, rCBF, and MTT in this subject. The average pyruvate MTT was 7.7 seconds.