0801
Dual-module velocity-selective arterial spin labeling (dm-VSASL) dramatically improves the temporal signal-to-noise ratio of VSASL1Bioengineering, University of California Riverside, Riverside, CA, United States, 2Center for Advanced Neuroimaging, UCR, Riverside, CA, United States
Synopsis
High temporal signal-to-noise ratio (tSNR) is desired for arterial spin labeling (ASL) methods. The tSNR of velocity-selective arterial spin labeling (VSASL) was limited in practice due to its sensitivity to error sources such as motion, eddy currents and diffusion effects. A novel VSASL strategy was invented to enable dual-module (dm-) VS saturation (VSS) and VS inversion (VSI) labeling for further improved SNR efficiency with VSASL. This study focused on the tSNR performance analysis and found the tSNR was doubled in gray matter using the new dm-VSASL. The explanation of such significant improvement was explored and validated by in vivo experiments.
Introduction
Velocity-selective arterial spin labeling (VSASL) 1 is insensitivity to inhomogeneous transit times 1, 2. It demonstrated great promise in clinical imaging of perfusion with long delays 3-6. Dual-module (dm-) VS saturation (dm-VSS) 2 and VS inversion (VSI) preparation 7 have been developed to improve the signal-to-noise ratio (SNR) efficiency of VSASL. However, the temporal SNR (tSNR) of VSASL methods was not satisfactory in practice. Though recent studies compared the tSNR of different VSASL methods without background suppression (BS) 8, 9, an investigation on the tSNR performance of VSASL with BG is of high interest to the community. A novel dual-module labeling strategy is introduced to enable dual-module labeling for both VSS and VSI with improved SNR efficiency (reported in another abstract), this work focuses on analyzing its tSNR performance with BS.Methods
The new dm-labeling strategy uses VS pulses that invert the stationary spins as the first VS module, and then switch the label/control condition in the second VS module to allow proper accumulation of ASL signal in the tissue. This results in a more balanced utility of VS gradients under the label/control conditions. We hypothesize that this should reduce noise and artefacts from sources such as motion, eddy currents (EC) and diffusion.Sinc-VSI 9 was used for dm-VSI labeling. For dm-VSS labeling, symmetric BIR-8 (sBIR8) pulse 10 was used with a phase of π added to the last segment to invert the stationary spins (VSSinv) 2. VSSinv was also used when its inversion effect can be used for BS.
Four healthy human subjects (1F, age 23-38) were studied on a 3T scanner (Siemens Prisma, Erlangen, Germany) under an IRB approval. In addition to the ASL scans described in the other abstract, two dm-VSASL scans were performed with different levels of BS, resulting in 8 ASL scans: 1) PASL: FAIR 11, 12 Q2Tips 13, TI1=0.8s, TI=2.4s, 2 BS pulses 1.4/0.42s before imaging; 2) VSSinv: TI=1.4s, 1 BS pulse 0.48s before imaging; 3) VSS+VSSinv: TI1/2=1.16/0.83s, 1 BS pulse 0.26s before imaging; 4) VSSinv+VSSinv (BS1): TI1/2=1.45/0.54s, 2 BS pulses 0.37/0.25s before imaging; 5) VSSinv+VSS (BS2): TI1/2=1.45/0.54s, 1 BS pulse 0.28s before imaging; 6) VSI: TI=1.4s, 1 BS pulse 0.48s before imaging; 7) VSI+VSI (BS1): TI1/2=1.45/0.54s, 2 BS pulses 0.37/0.25s before imaging; 8) VSI+VSI (BS2): TI1/2=1.45/0.54s, 2 BS pulses 0.47/0.14s before imaging.
Results
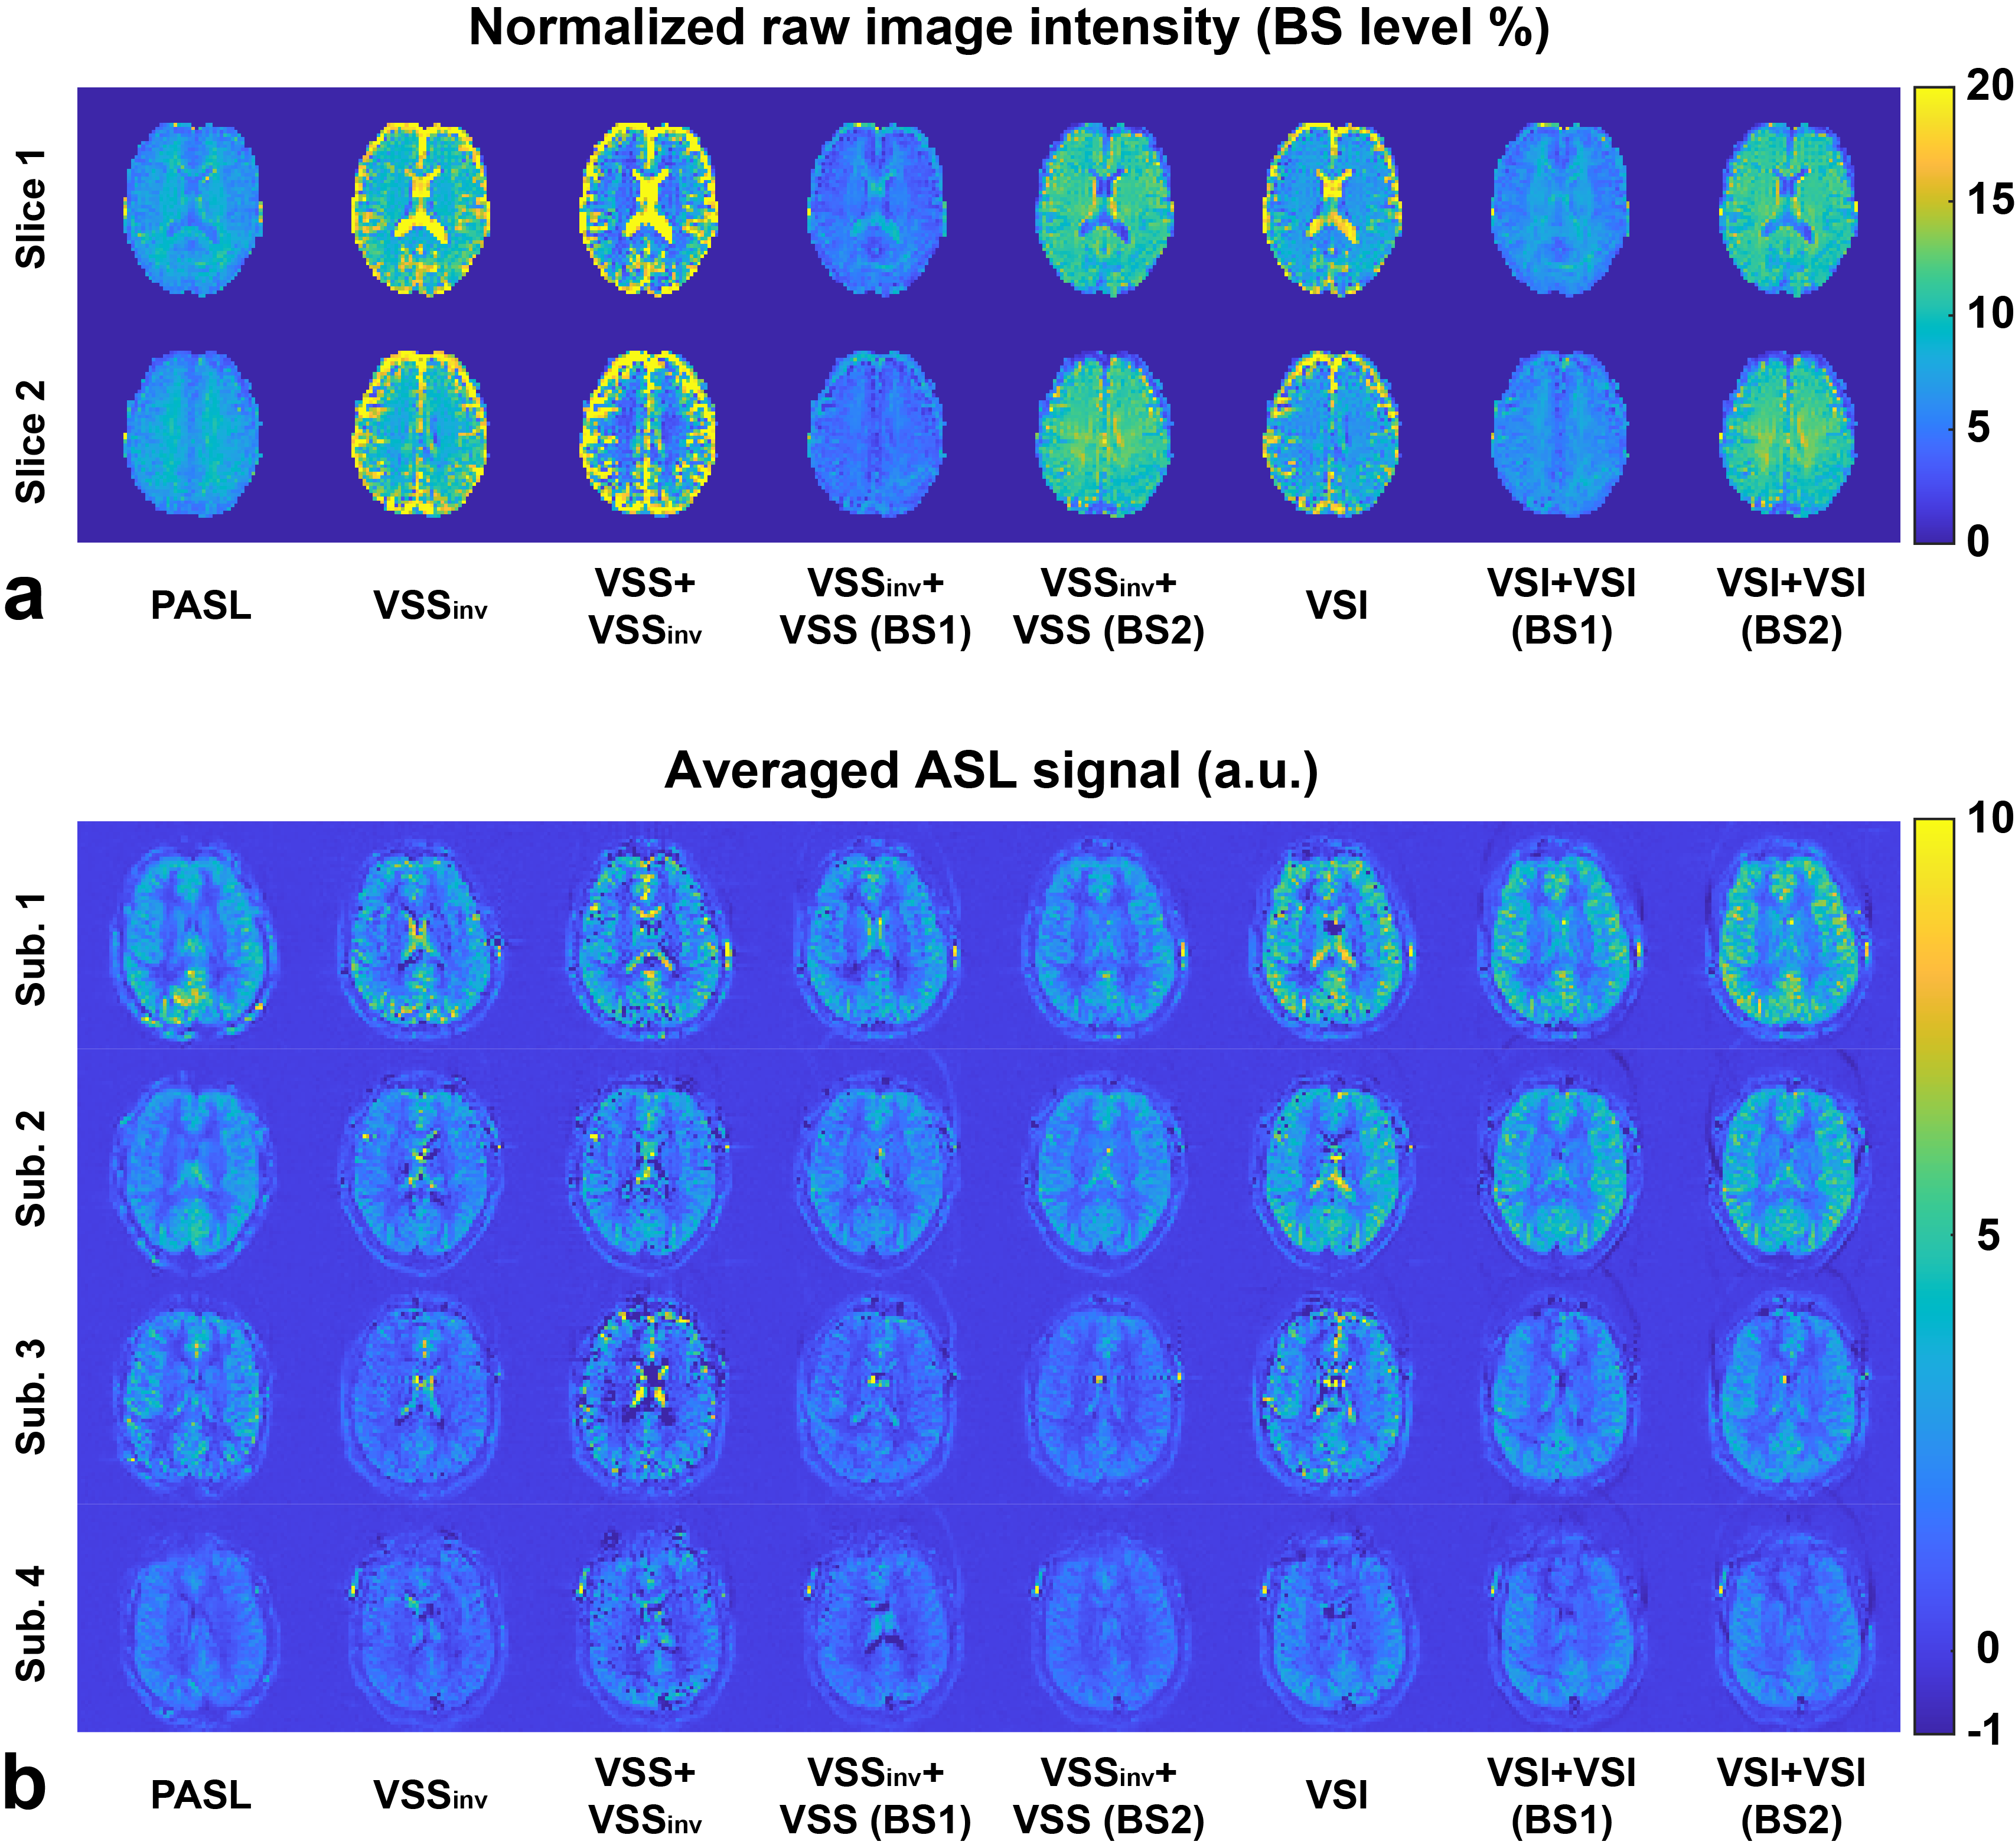
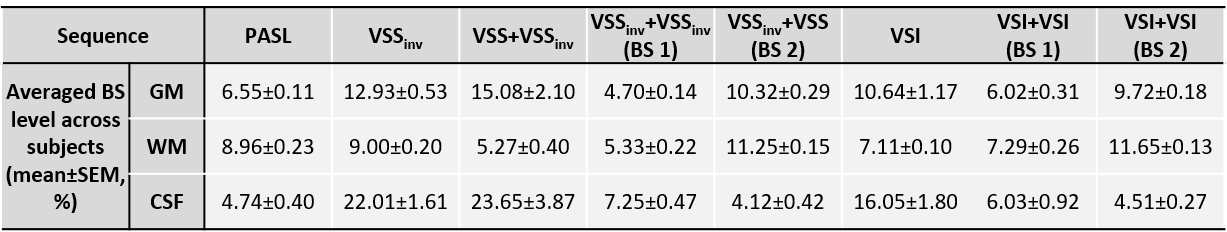
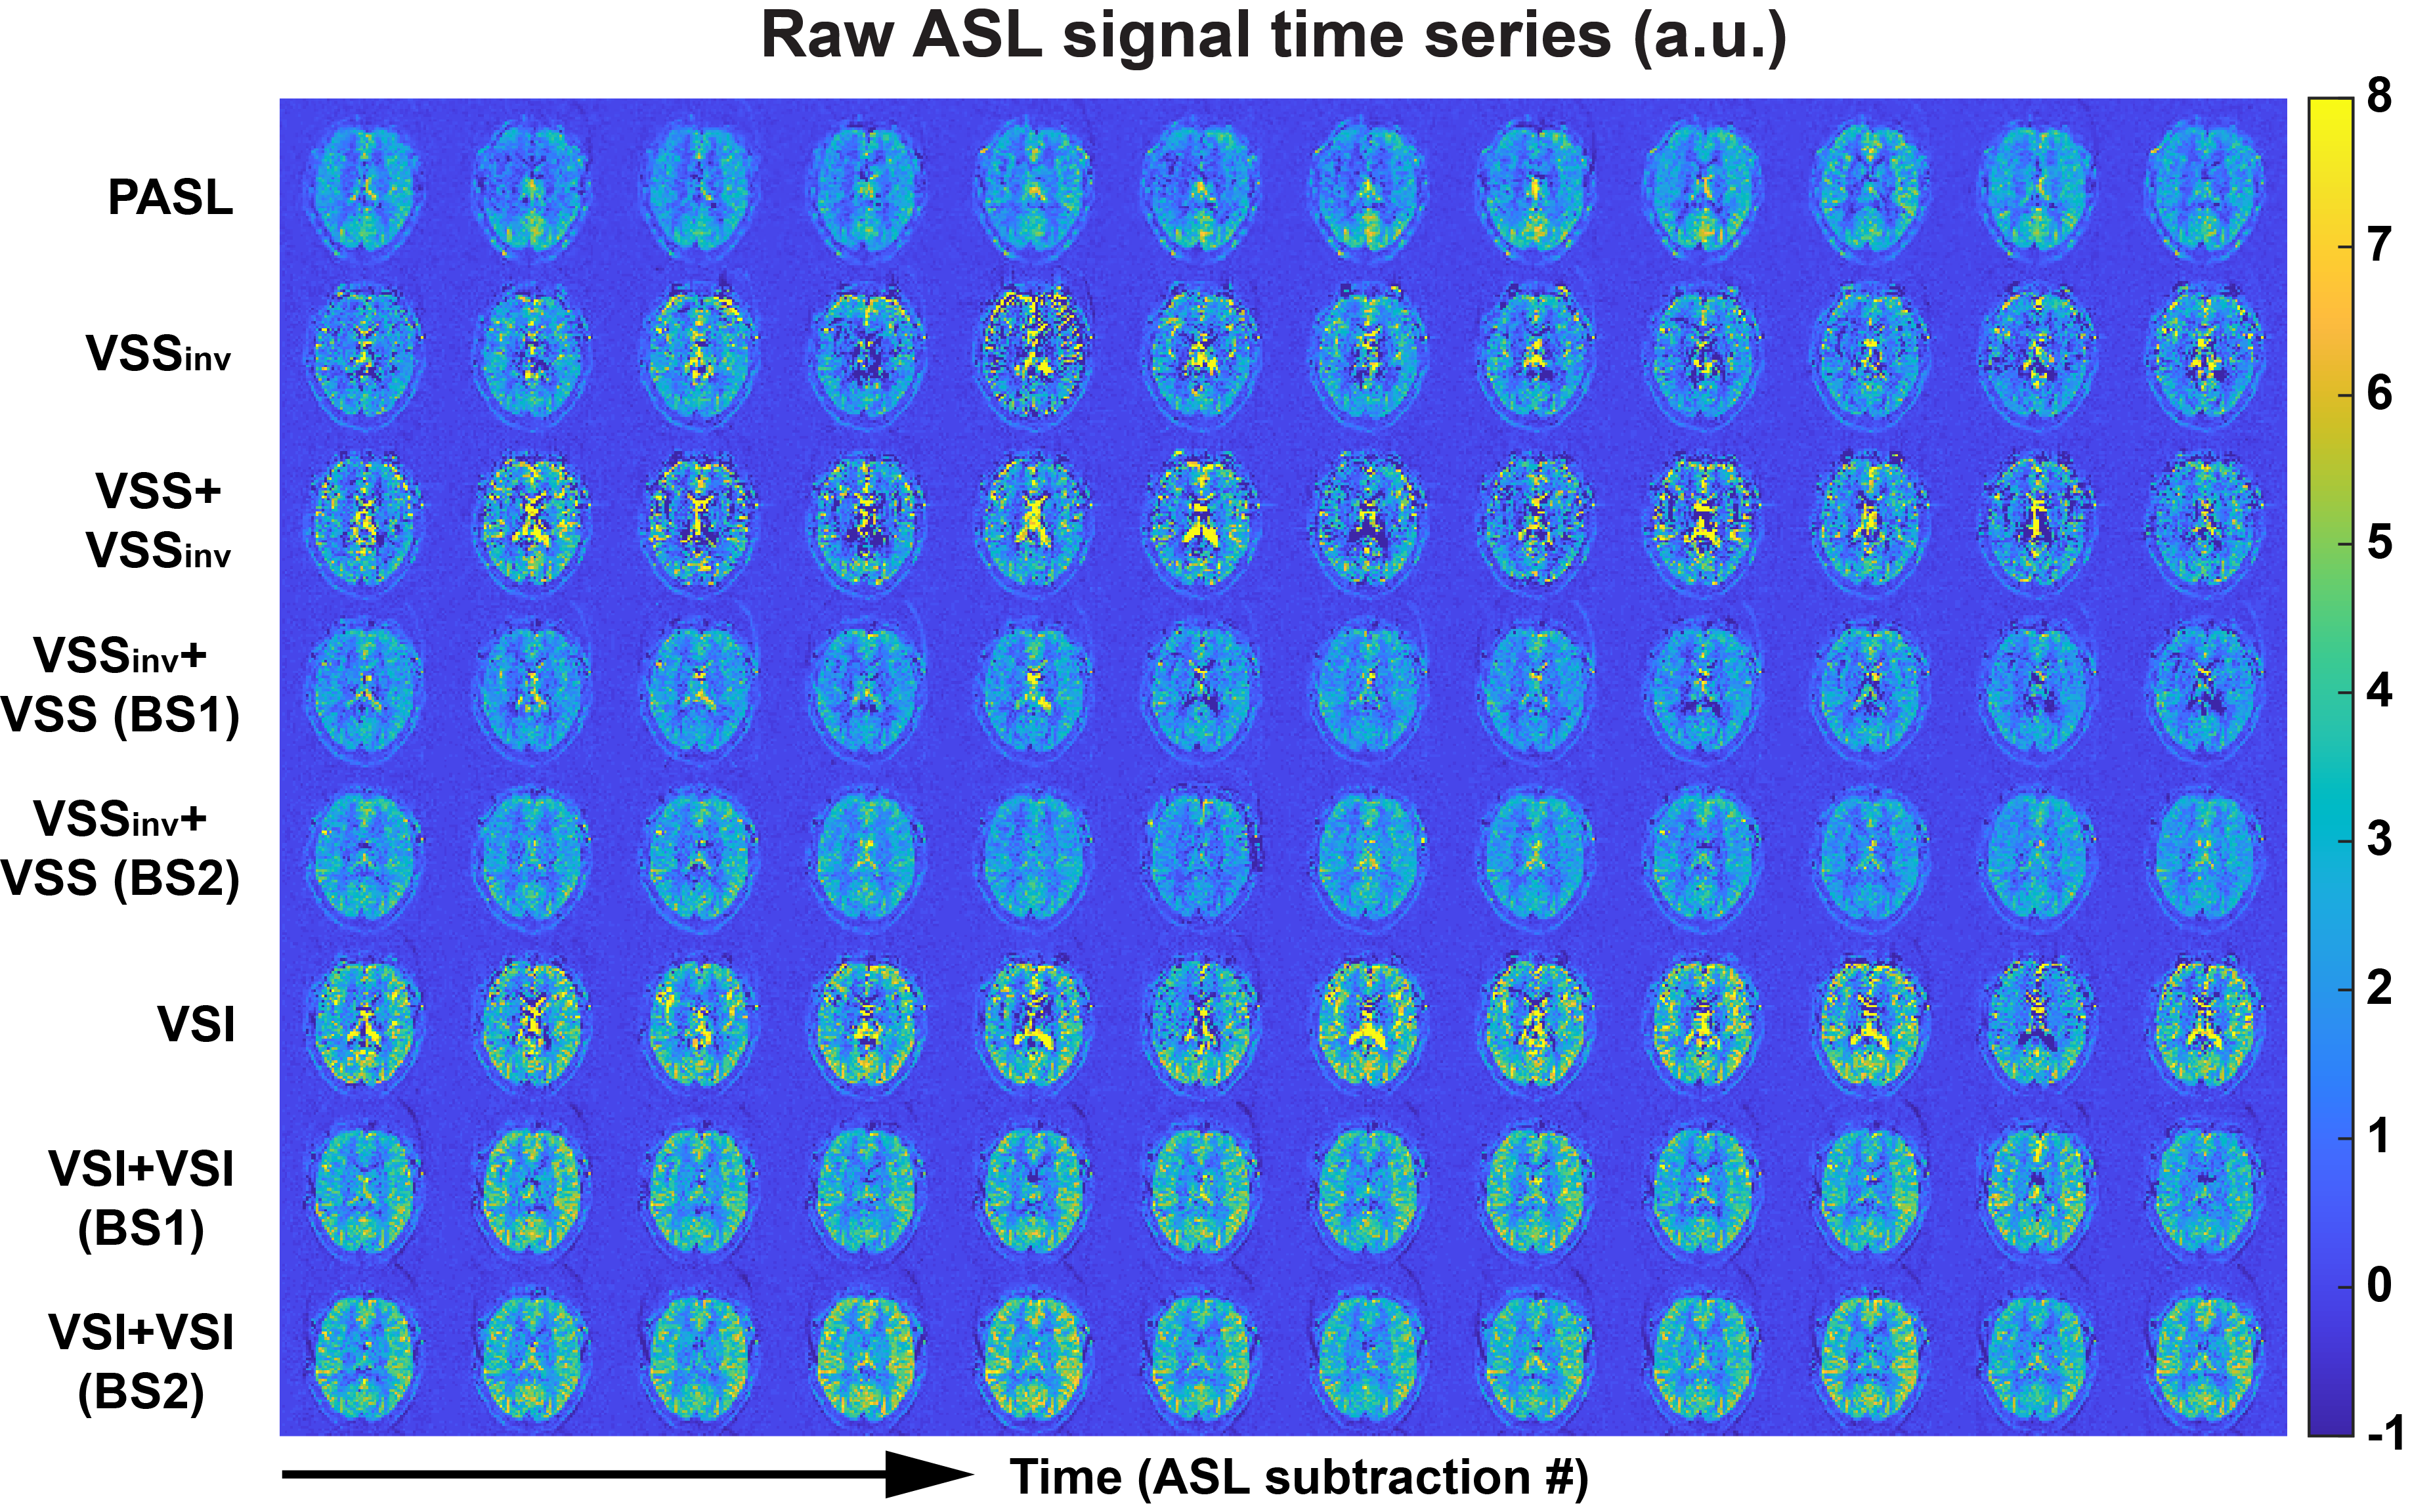
Examples of raw ASL images and averaged ASL signal maps are shown in Figure 1. BS levels in gray matter (GM), white matter (WM) and cerebrospinal fluid (CSF) regions of interest (ROIs) were averaged across subjects and are reported in Table 1. Different levels of BS were achieved consistently across subjects. Note that the CSF signals in VSSinv, VSS+VSSinv and VSI could not be sufficiently suppressed. The new dm-VSASL (VSSinv+VSSinv, VSSinv+VSS and VSI+VSI) achieved sufficient suppression across all brain tissues.Examples of the ASL signal time series from Subject 2 are shown in Figure 2. High signal fluctuations were observed in regions where CSF signals were not sufficiently suppressed in sm-VSAL and VSS+VSSinv. Though the fluctuations were mostly averaged out, there were erroneous ASL signals in voxels where CSF signals dominate, such as in the ventricles and around the sulci. In contrast, both the VSS- and VSI-based new dm-VSASL methods produced ASL signals with high temporal stability throughout the brain.
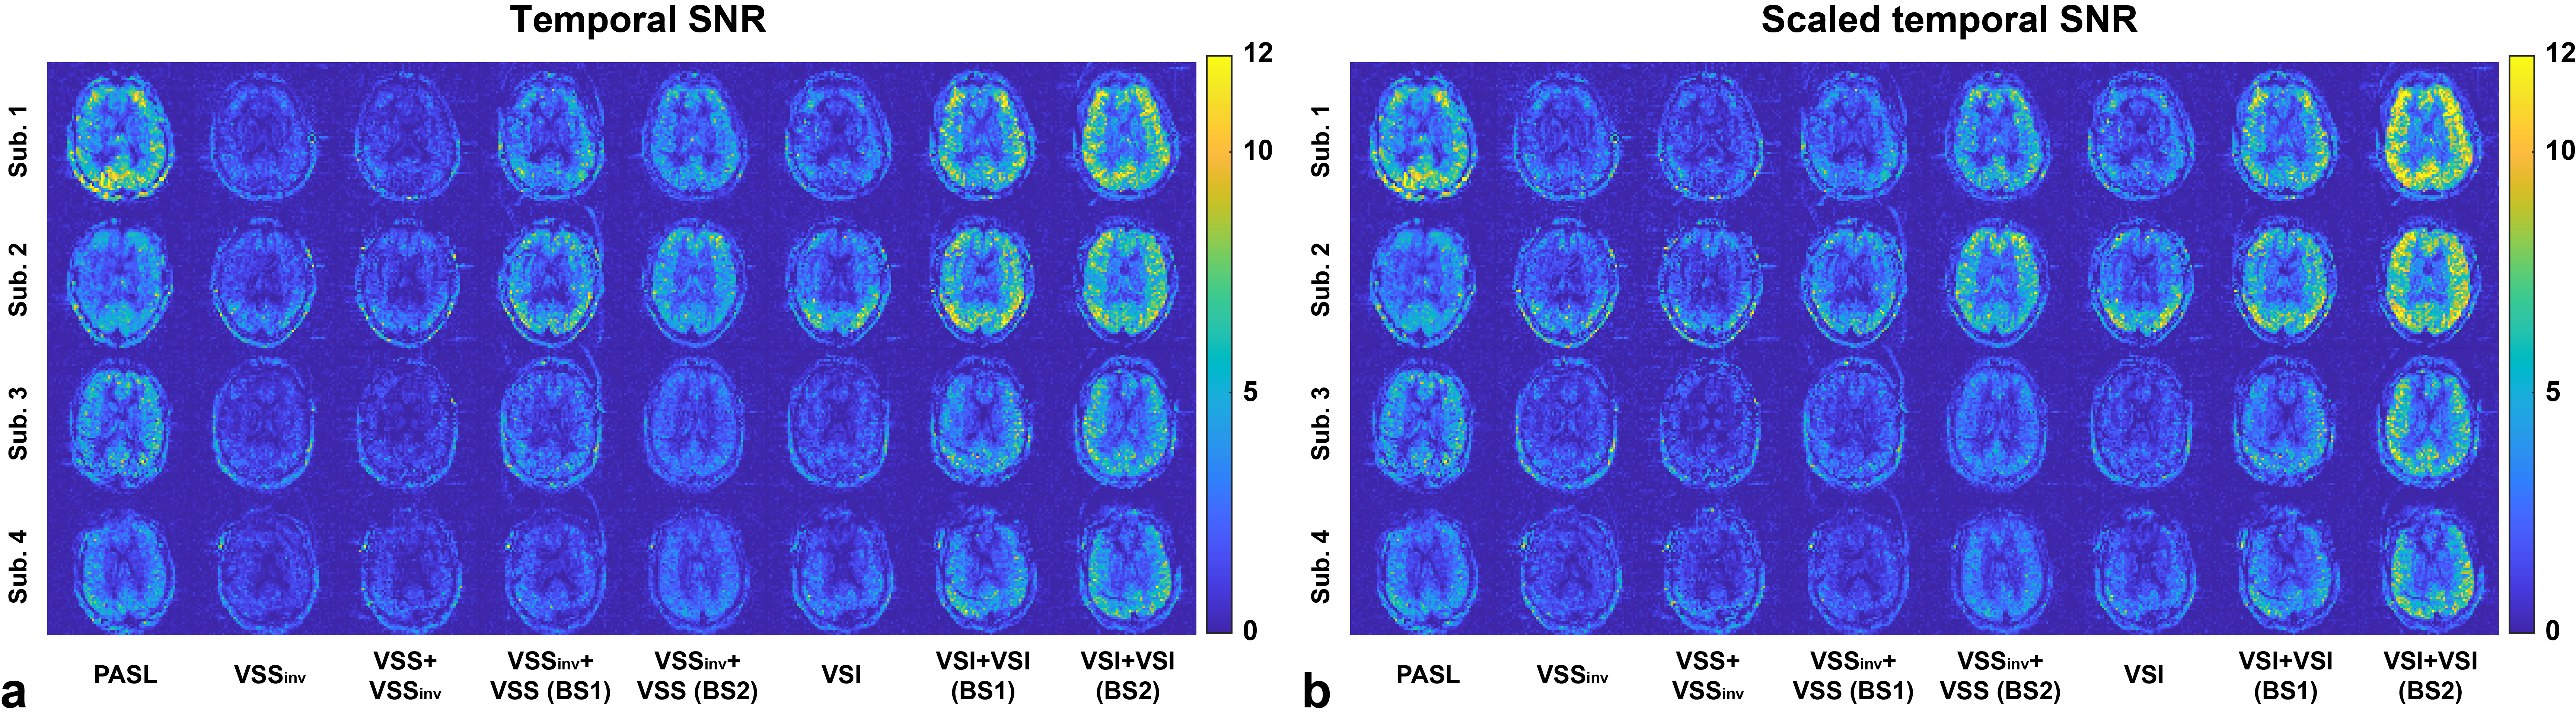
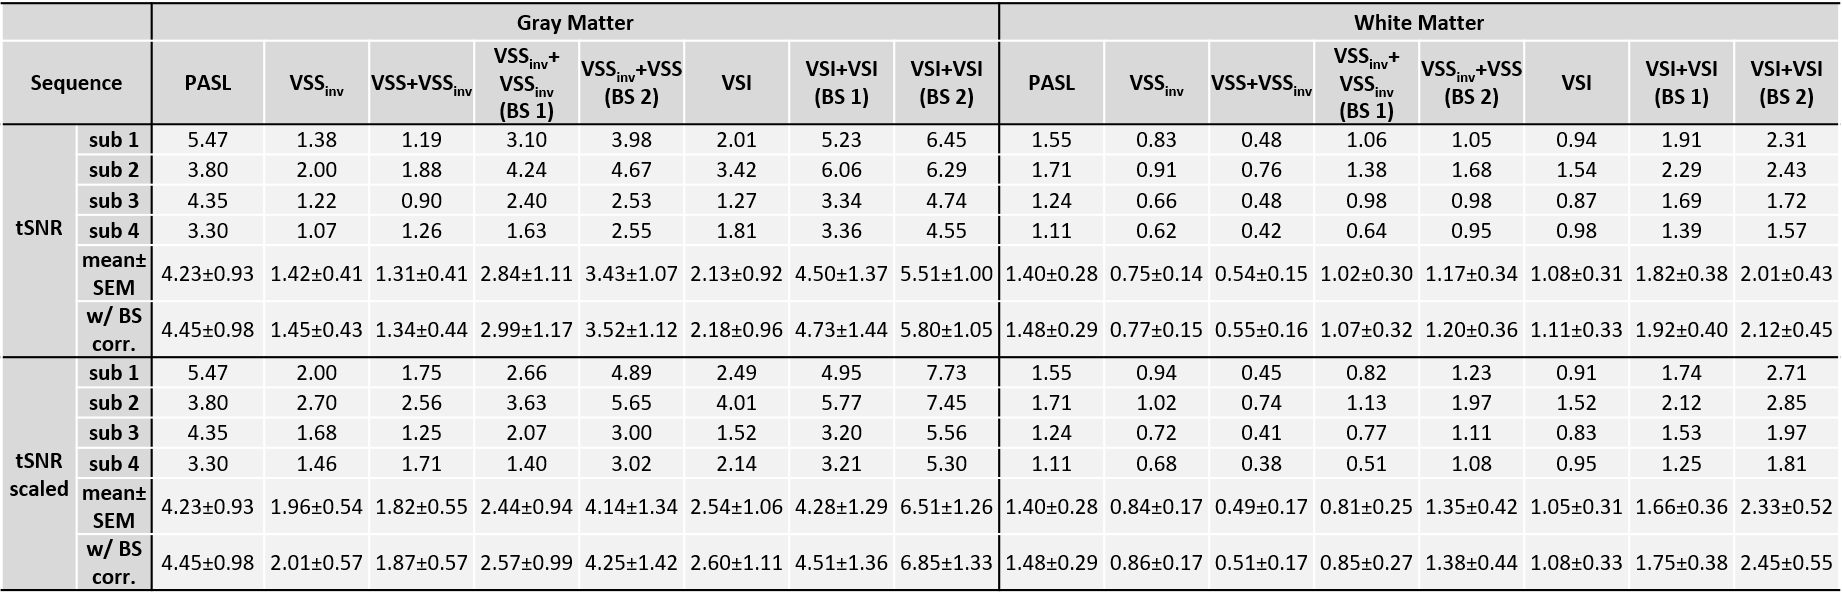
Raw tSNR maps and the scaled counterparts aiming to separate out the contribution from the efficacy of BS were calculated and are shown in Figure 3. Averaged tSNR values in GM and WM ROIs were summarized in Table 2. Compared to the single-module counterparts, VSSinv+VSS improved the tSNR by 142.2% (GM, p=0.011) and 55.2% (WM, p=0.044); and dm-VSI improved the tSNR by 165.6% (GM, p=0.003) and 90.5% (WM, p=0.010), at a more favorable BS level (BS2). After scaling, the improvements were 111.2% (GM, p=0.015) and 60.7% (WM, p=0.043) for VSSinv+VSS; and 163.1% (GM, p=0.003) and 127.4% (WM, p=0.007) for dm-VSI.
Discussion
Dm-VSASL with BS2 (higher GM/WM and lower CSF signals) had a better tSNR improvement than with BS1 (lower GM/WM and higher CSF signals), indicating that CSF generates higher noise than GM/WM, and its suppression should be prioritized with BS.The ASL signals in WM are less likely to be affected by noises from CSF. Consequently, the tSNR improvement in WM at similar BS levels, e.g., VSI+VSI (BS1) vs. VSI, indicated that the new dm-VSASL strategy likely reduced the noise from sources such as motion, diffusion and ECs, though further study is needed to validate this.
The new dm-VSASL strategy provides two major advantages: 1) the inversion effect from the first VS module enables more flexibility in BS optimization, especially for suppressing CSF signals, which is more difficult to suppress given the timing constraints in VSASL; 2) the label/control condition flipping in the second VS module creates a more balanced distribution of VS gradients and diffusion weighting in the label/control conditions, reducing artefacts from sources mentioned above.
Conclusion
Dm-VSASL significantly improves the tSNR of VSASL. Combined with the SNR advantage of VSI, dm-VSI should be an excellent tool for imaging baseline and functional changes of perfusion.Acknowledgements
The author thanks Dr. Jason Langley for data acquisition and Dr. Divya Bolar for sharing code for pulse sequence development.References
1. Wong EC, Cronin M, Wu W-C, Inglis B, Frank LR, Liu TT. Velocity-selective arterial spin labeling. Magn Reson Med. 2006;55(6):1334-41.
2. Guo J, Wong EC. Increased SNR efficiency in velocity selective arterial spin labeling using multiple velocity selective saturation modules (mm-VSASL). Magn Reson Med. 2015;74(3):694-705. 3. Qiu DQ, Straka M, Zun ZH, Bammer R, Moseley ME, Zaharchuk G. CBF measurements using multidelay pseudocontinuous and velocity-selective arterial spin labeling in patients with long arterial transit delays: Comparison with xenon CT CBF. J Magn Reson Imaging. 2012;36(1):110-9.
4. Guo J, Fan A, Lebel MR., Holdsworth S, shankaranarayanan A, G. Z, editors. Extreme ASL: challenges and solutions to improve perfusion imaging in patients with markedly prolonged arterial transit delays. ISMRM; 2017; Honolulu, HI, United States.
5. Bolar DS, Rosen BR, PW. S, editors. Comparison of velocity-selective and pulsed ASL perfusion MRI in patients with suspected cerebral cortical ischemia. ISMRM; 2018; Paris, France.
6. Bolar DS, Gagoski B, Orbach DB, Smith E, Adalsteinsson E, Rosen BR, et al. Comparison of CBF Measured with Combined Velocity-Selective Arterial Spin-Labeling and Pulsed Arterial Spin-Labeling to Blood Flow Patterns Assessed by Conventional Angiography in Pediatric Moyamoya. AJNR Am J Neuroradiol. 2019;40(11):1842-9.
7. Qin Q, van Zijl PC. Velocity-selective-inversion prepared arterial spin labeling. Magn Reson Med. 2016;76(4):1136-48.
8. Hernandez-Garcia L, Nielsen JF, Noll DC. Improved sensitivity and temporal resolution in perfusion FMRI using velocity selective inversion ASL. Magn Reson Med. 2019;81(2):1004-15.
9. Guo J, Das S, Hernandez-Garcia L. Comparison of velocity-selective arterial spin labeling schemes. Magn Reson Med. 2021;85(4):2027-39.
10. Guo J, Meakin JA, Jezzard P, Wong EC. An optimized design to reduce eddy current sensitivity in velocity-selective arterial spin labeling using symmetric BIR-8 pulses. Magn Reson Med. 2015;73(3):1085-94.
11. Kim SG. Quantification of relative cerebral blood flow change by flow-sensitive alternating inversion recovery (FAIR) technique: application to functional mapping. Magn Reson Med. 1995;34(3):293-301.
12. Kwong KK, Chesler DA, Weisskoff RM, Donahue KM, Davis TL, Ostergaard L, et al. MR perfusion studies with T1-weighted echo planar imaging. Magn Reson Med. 1995;34(6):878-87.
13. Luh WM, Wong EC, Bandettini PA, Hyde JS. QUIPSS II with thin-slice TI1 periodic saturation: a method for improving accuracy of quantitative perfusion imaging using pulsed arterial spin labeling. Magn Reson Med. 1999;41(6):1246-54.
Figures