0800
Clinical impact of automatic failure mode evaluation using self-calibrated phase contrast correction in phase contrast cardiac MRI1GE Healthcare, Munich, Germany, 2Department of Cardiology, Erasmus MC, University Medical Center Rotterdam, Rotterdam, Netherlands, 3Department of Radiology and Nuclear Medicine, Erasmus MC, University Medical Center Rotterdam, Rotterdam, Netherlands, 4Department of Imaging Physics, TU Delft, Delft, Netherlands, 5Department of Pediatric Cardiology, Erasmus MC, University Medical Center Rotterdam, Rotterdam, Netherlands
Synopsis
Phase contrast (PC) cardiac MRI is clinically used to quantify flow. The quantification accuracy is diminished by background phase errors. Stationary tissue-based background phase correction algorithms are commercially available, but their accuracy is still under evaluation. Here, we investigate if a self-calibrated phase contrast (SCPC) algorithm which includes automatic failure mode classification, can improve accuracy in a large single-vendor multi-scanner study including 346 PC scans. Our results show that SCPC improves flow quantification accuracy and can identify most PC scans which are unreliable regardless of stationary tissue correction or not.
Introduction
Phase offset errors in Phase Contrast (PC) MRI have significant clinical impact on flow quantification, e.g. in congenital heart disease and valvular regurgitation assessment. A recent retrospective study showed that stationary tissue background phase correction using polynomial fitting up to third order worsened accuracy compared to no correction on three GE Healthcare MR scanners1. In this study, we investigated whether the Self-Calibrated Phase Contrast (SCPC)2 algorithm, can improve the accuracy of flow quantification compared to solely no correction with respect to static phantom correction, taken here as gold standard.Methods
Acquisition: MRI was performed on three different clinical 1.5T MRI scanners from GE Healthcare (Milwaukee, Wisconsin, USA). Through plane retrospectively gated PC FastCINE at the aortic valve (Ao) and the pulmonary artery (PA) were acquired. Scanner specifications and PC sequence parameters can be found in Table 1.Algorithm: SCPC is a fully automatic non-linear (5 coefficients) stationary tissue correction algorithm2, which is designed to automatically detect failures of the algorithm and classified each PC scan (Figure 1) as:
- Class 1: Use SCPC corrected PC images for further analyses
- Class 2: Use non-corrected PC images for further analyses
- Class 3: Rescan is recommended (this will include suggested guidelines to the scanner operator) because 1) too low velocity to noise ratio (VNR) or 2) low percentage of static tissue in the field of view was found.
Analysis: PC net flow measurements of the Ao and PA were performed using Medis Qflow software (Medis, Leiden, The Netherlands), using the same contours for the SCPC corrected, static phantom corrected, and the non-corrected PC images. The automatic classification provided by SCPC was considered successful when:
- For Class 1: Net flow from the SCPC corrected images differed ≤10% from phantom corrected images
- For Class 2: Net flow from the non-corrected PC images differed ≤10% from phantom corrected images
- For Class 3: Net flow from SCPC corrected and non-corrected PC images differed >10% from phantom corrected images
Additionally, when the automatic classification by SCPC was unsuccessful, the incorrectly classified PC datasets were divided in four different types:
- Type 1: Class 1 but it should have been Class 2
- Type 2: Class 1 or Class 2 but it should have been Class 3
- Type 3: Class 2 but it should have been Class 1
- Type 4: Class 3 but it should have been Class 1 or Class 2
Accuracy is defined as difference in net flow ≤10% with respect to phantom corrected net flow1. For reference, the accuracy of SCPC is compared to solely non-corrected images (from Minderhoud et al1): 81% for all data; 88% for scanner 1; 52% for scanner 2; 95% for scanner 3; 82% for Ao; and 81% for PA.
Results
The accuracy of the automatic classification of SCPC is shown in Figures 2 and 3. The results show that SCPC provided correct PC images in 86% of the total, 5% better than using the non-corrected images. Most importantly SCPC was able to correctly identify 16 out of 23 (70%) Class 3 PC scans. Additionally, 5 out 7 incorrectly classified Class 3 scans were from scanner 3 where image quality was lower (Figure 1). Although, background phase errors were also very small1 in scanner 3. No differences were found per vessel. Per scanner, SCPC correction had the biggest impact for scanner 2, the scanner with larger background phase errors1. SCPC improved accuracy from 52% to 75%. Accuracy was found similar for scanner 1 comparing SCPC with no correction at all and it worsened by 4% for scanner 3 (mainly due to incorrect Class 3 PC scans).Discussion
Here, we extend the work from Minderhoud et al1 where it was shown that background phase errors worsened accuracy with respect to no correction by 7% or more. We show that applying SCPC jointly with an automatic failure mode evaluation improved accuracy with respect to no correction by 5%. SCPC was also able to automatically detect PC scans that are likely to result in incorrect flow measurements (Class 3) which is important information for the clinician. In these cases, rescan is advised. Further research is needed to explore if a rescan will improve accuracy in those cases. Additionally, extending the study to include more scanners of the same or different models will also be of interest. One limitation of this study is that static phantom correction is used as gold standard. It is known that this is not perfect because phase offsets can change with temperature or coil load3. However, we accounted for that and excluded 8 PC scans due to mismatch in the background phase between the static tissue and the static phantom1,4.Conclusion
Phase offset errors have a significant impact on PC MRI based flow quantification assessment and varied greatly between scanners. SCPC with automatic failure mode evaluation improved accuracy with respect to no correction and successfully identify PC scans that are likely to result in unreliable flow measurements.Acknowledgements
No acknowledgement found.References
[1] Minderhoud, S.C.S., van der Velde, N., Wentzel, J.J. et al. The clinical impact of phase offset errors and different correction methods in cardiovascular magnetic resonance phase contrast imaging: a multi-scanner study. J Cardiovasc Magn Reson 22, 68 (2020)
[2] Paul, E.A., Solana, A.B., Duong, J. et al. Evaluation of self-calibrated non-linear phase-contrast correction in pediatric and congenital cardiovascular magnetic resonance imaging. Pediatr Radiol 50, 656–663 (2020)
[3] Busch, J., Vannesjo, S. J., Barmet, C., Pruessmann, K. P., & Kozerke, S. Analysis of temperature dependence of background phase errors in phase-contrast cardiovascular magnetic resonance. J Cardiovasc Magn Reson 16(1), 97 (2014)
[4] Hofman, M.B., Rodenburg, M.J., Bloch, K.M. et al. In-vivo validation of interpolation-based phase offset correction in MR flow quantification: a multi-vendor, multi-center study. J Cardiovasc Magn Reson 18, O88 (2016)
Figures
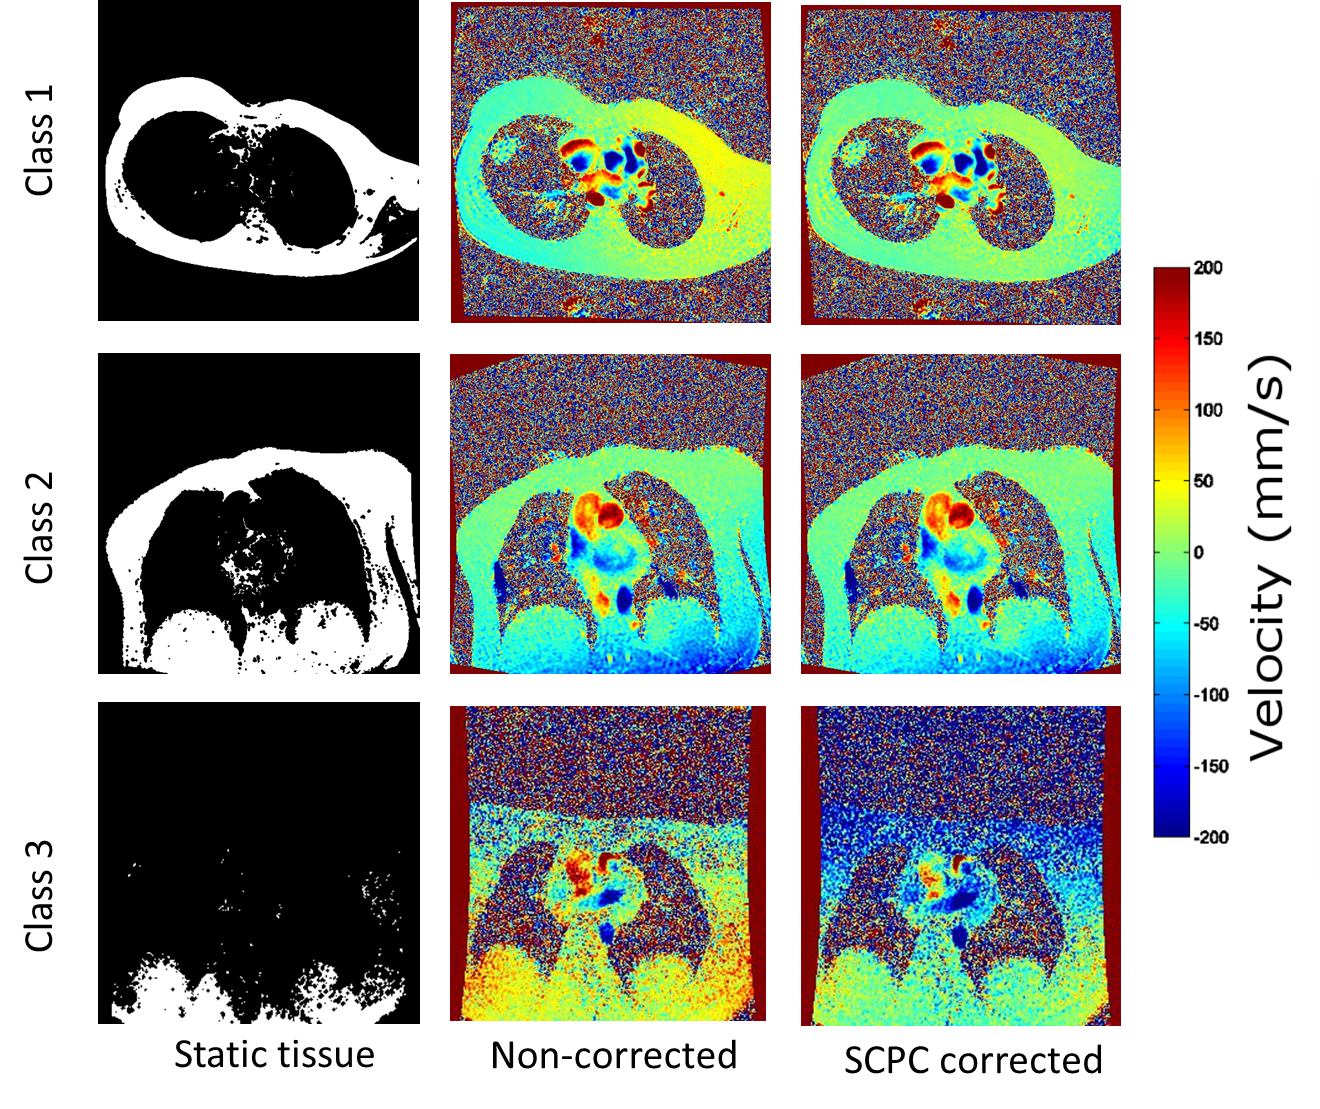
Figure 1: Exemplary cases of PC scans automatically classified by SCPC for Class 1 (Use SCPC corrected), Class 2 (Use non-corrected) and Class 3 (rescan) from top to bottom. From left to right: the first column contains a binary mask indicating the static tissue automatically detected, second column the mean velocity image over the cardiac cycle for the non-corrected PC velocity images and the third column the mean velocity image over the cardiac cycle after SCPC correction.
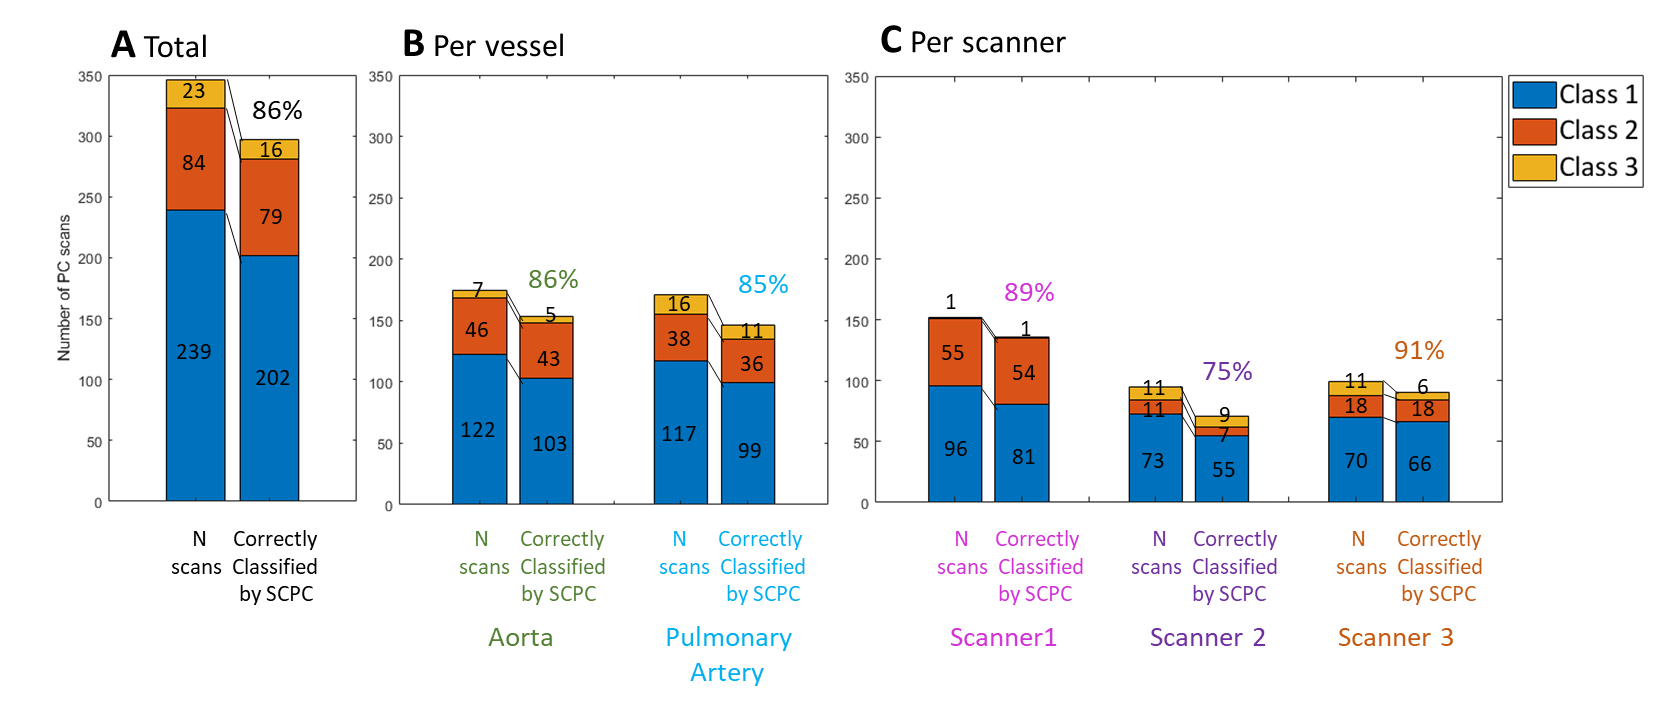
Figure 2: Evaluation of the accuracy of the SCPC automatic classification for all PC series (A) and further stratified per vessel (B) and per scanner (C). The bar graphs are showing the number of PC scans automatically classified by SCPC in Class 1, Class 2 and Class 3 on the left column, and the goodness of that classification on the right for each class. The percentage PC scans that were correctly classified by SCPC is depicted on top.
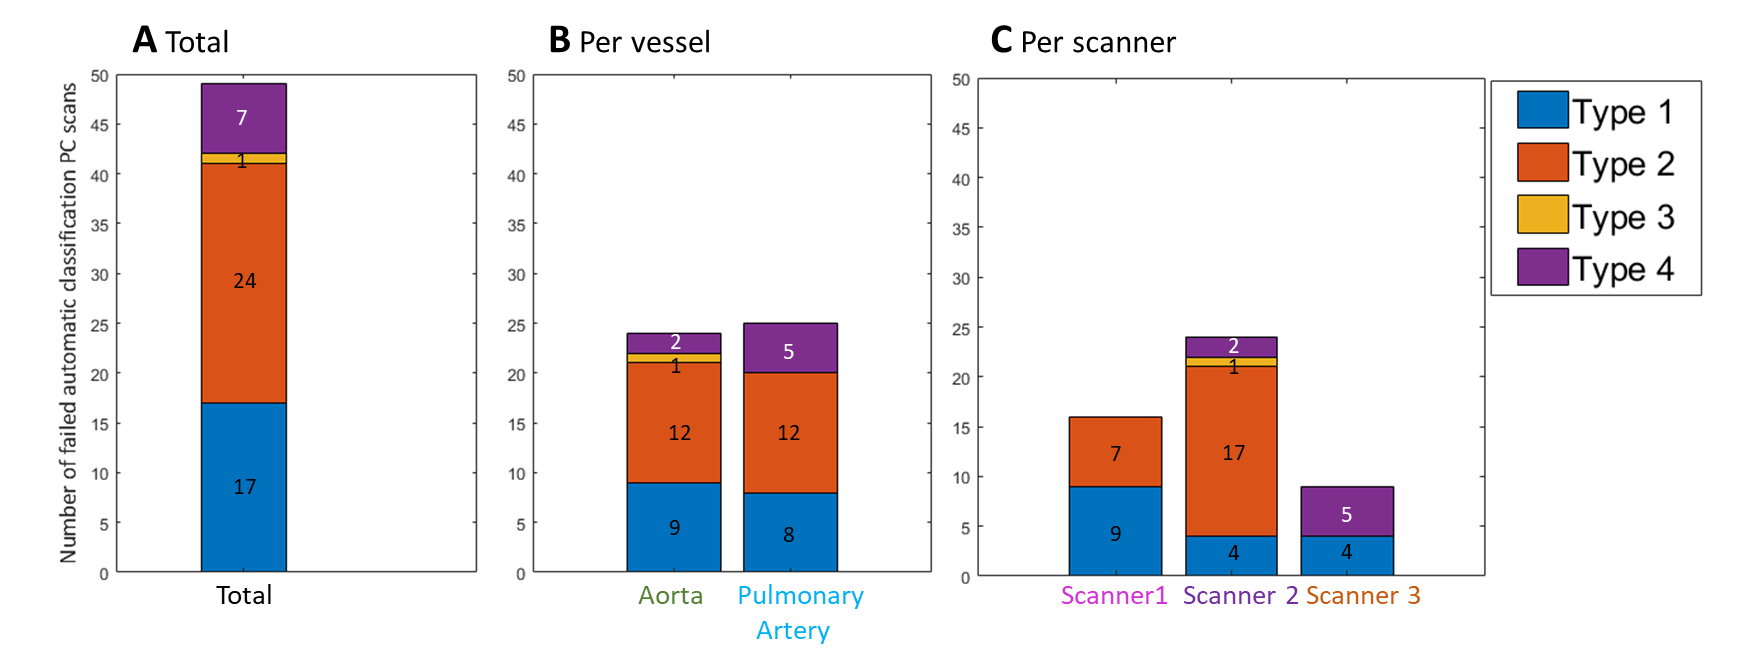
Figure 3: Evaluation of the type of failed automatic classification for the total PC scans(A), and further stratified per vessel (B) and per scanner (C).
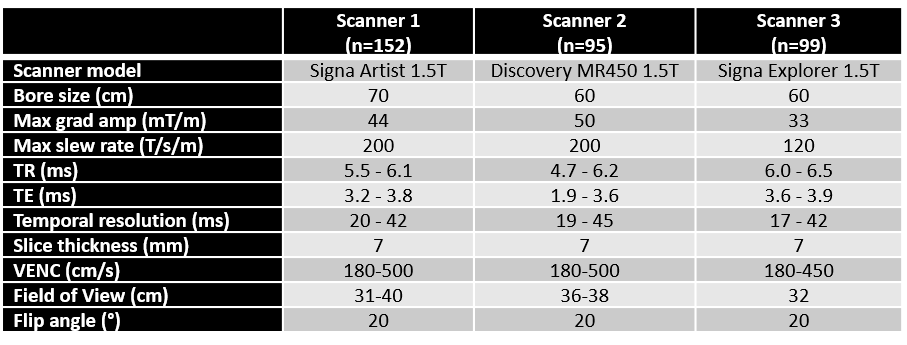
Table 1: Scanner specification and main PC sequence parameters ranges for the three 1.5T GE Healthcare MRI scanners.