0799
Identification of Subtle Alterations for Demarcation of Disease Transition in Murine Aortic Valve Stenosis by Multiparametric MRI1Heinrich Heine University, Düsseldorf, Germany
Synopsis
Aortic valve stenosis (AS) is one of the most frequent valve diseases in the elderly with relevant prognostic impact. Becausesufficient experimental models were lacking, we recently refined a murine model of gradable experimental AS closely mimicking disease progression in humans. Here, we aimed at developing a comprehensive MRI approach for simultaneous assessment of changes in valvular, myocardial as well as aortic function in mice. We demonstrate that in this murine model high resolution MRI is capable to reliably display transvalvular aortic flow profiles with concomitant quantification of structural and functional changes inaortic valve, left ventricle, and ascending aorta.
Background
Aortic valve stenosis (AS) is one of the most frequent valve diseases in the elderly with relevant prognostic impact. Because sufficient animal models were lacking, we recently refined a murine model of gradable experimental AS closely mimicking disease progression in humans[1]. Here, we aimed at developing a comprehensive MRI approach for simultaneous assessment of changes in valvular, myocardial as well as aortic morphology and function in mice.Methods
Experimental AS was induced by wire injury[1] in male 12-week-old C57Bl/6 mice which were subjected 4 weeks after surgery to high resolution MRI at a Bruker AVANCEIII 9.4T Wide Bore NMR spectrometer. Images were acquired utilizing a microimaging unit with actively shielded gradient sets (1.5 T/m) and a 25-mm quadrature resonator. Cine loops (16 frames, 58.5×58.5 µm2) were recorded using an ECG- and respiratory-gated segmented FISP sequence (TE=1.23 ms). Aortic strain was determined from the circumferential dimensions of the aorta in end-diastole and ‑systole by strain=0.5×½((C2s/C2d)-1). Aortic flow profiles were obtained from velocity maps acquired at the atrio-ventricular level using an ECG- and respiration-triggered slice-selective 2D FLASH sequence with a four-point Hadamard scheme for flow velocity encoding (12 frames). Cardiac tissue characterization was carried out by T1 and T2 mapping as described previously[2].Results and Discussion
As expected, in mice subjected to wire injury we observed an impaired valve opening and a more triangular orifice as compared to healthy controls and sham-operated animals. Besides detection of the restricted orifice area, long axis slices revealed an altered shape and thickening of the valve as consequence of the remodelling processes induced by the surgical procedure (Fig. 1). While control mice showed a bell-shaped flow profile in early systole, AS resulted not only in significantly enhanced peak flow velocity, but also in a fragmented pattern of the flow profile with isolated spikes of accelerated velocities across the valvular area and also areas with negative flow peaks (Fig. 2). Note, that due to the increased resistance for blood output through the reduced orifice, peak velocity is achieved later in mice with AS compared to controls.Aortic regurgitation (AR) might occur as consequence of the remodeling process after induction of AS or due to the surgical intervention itself. In MR cine loops, the emerging backward flow is reflected by black flow artifacts in early diastole immediately after valve closure (Fig. 3A+B+G). However, cine flow profiles allow a more quantitative evaluation of the degree of AR by determination of diastolic backward flow (Fig. 3C). Depending on the individual remodeling process after induction of AS, the resulting valve morphology led to asymmetric opening and regurgitation patterns. In an interesting example, functionally bicuspid AS was associated with AR exactly at the same position where valve opening was restricted (Fig. 3E+F+H+I). Here, we also observed an accelerated increase in peak velocity caused by enhanced slew rate due to pendular volume (Fig. 3C).
While an unrestricted valve opening led to a homogenous blood flow coaxial to the vessel wall, aortic valve stenosis resulted in turbulent flow above the valve as reflected by irregular black flow artifacts in the ascending aorta (Fig. 4B+E). As a consequence of the long-term occuring turbulent flow patterns, transversal strain of the aortic root was significantly enhanced, which was also associated with an increase in aortic wall thickness at the level of the aortic valve (Fig. 4 bottom).
To assess the impact of AS in the present model on the LV, short axis cine loops were acquired for analysis of morphological and functional parameters (Fig. 5A-D). Of note, global cardiac function in terms of EF and cardiac output was unaffected in AS mice. However, diastolic wall thickness was slightly but significantly bigger comparable to a mild hypertrophy of the left ventricular wall. In line with this, LV mass showed a trend to increase without reaching the level of significance (data not shown). The regional analysis of the LV indicated an increased fractional shortening in all sectors aside from the inferior wall but again without reaching significance (Fig. 5C). Finally, cardiac tissue characterization by T1 and T2 mapping suprisingly revealed reduced values for both parameters in AS (Fig 5E+F), which clearly argues against development of myocardial edema at this time, but reflect adaptations leading to a worse magnetic homogeneity of the LV myocardium. Indeed, electron microscopy indicated indicated that this was associated with a beginning disorganization of the cardiomyocyte ultrastructure, which is well known to cause faster proton dephasing and affects T1 and T2 in the same way. Thus, the uncommon simultaneous drop of cardiac T1 and T2 might be useful as a premature in vivo readout for morphological disorders in the heart, which could be even more sensitive than conventional parameters, such as ECV or LGE.
Conclusions
In summary, we demonstrate that in experimental AS high resolution MRI provides important additional information on structural and functional aspects of valve, aorta and LV. Besides expected alterations in aortic valve function and flow profiles, incipient remodeling of the aortic wall and myocardial tissue integrity get apparent. With this, we identified a premature transition point with still compensated cardiac function but beginning textural changes allowing interventional studies to explore early disease pathophysiology and novel therapeutic targets.Acknowledgements
We thank Kathrin Paul-Krahé, Steffi Becher, Julia Pauli, Annika Zimmermann, and Dr. Ann Kathrin Bergmann for excellent assistance in surgical procedures, histology, and electron microscopy, respectively.References
1. Niepmann et al. Clin Res Cardiol. 2019; 108(8), 847-856.
2. Haberkorn SM et al. Circ Cardiovasc Imaging 2017;10(8), pii: e006025.
Figures
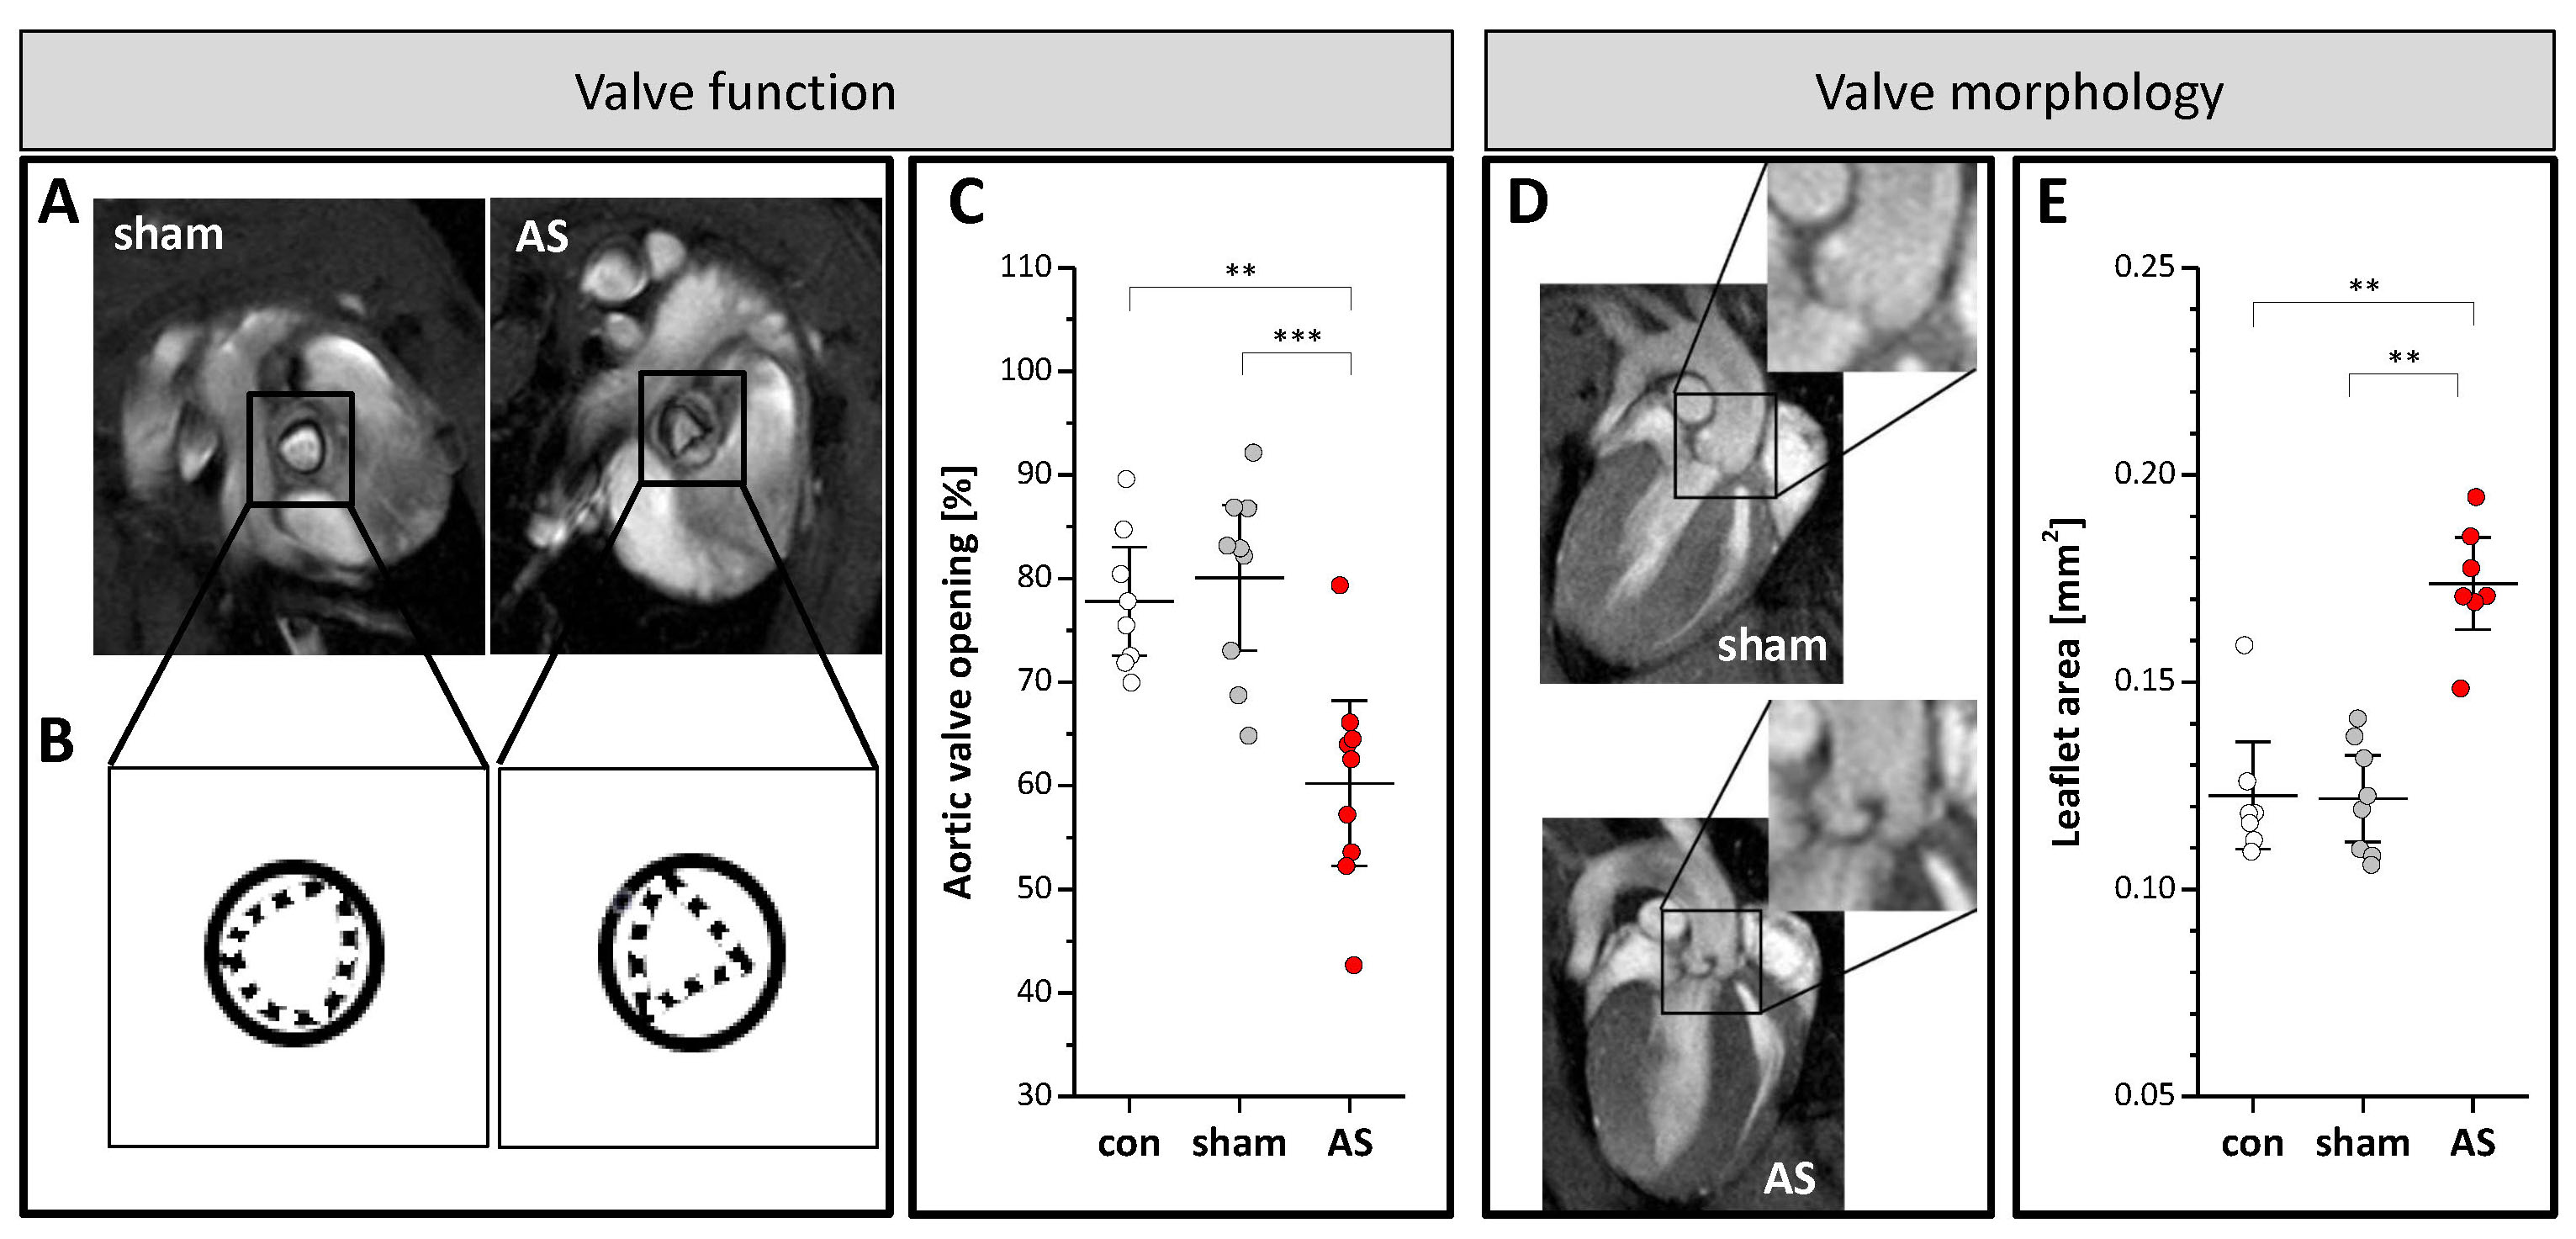
Figure 1: Valvular structure and function
(A+B) Valve opening in short axis views at the atrio-ventricular level in early systole in sham control (left) and AS (right) mice. (C) Opening of the aortic valve in untreated controls (con), sham-operated (sham), and AS mice expressed as percentage of maximal valve orifice in early systole to total inner aortic area in diastole. (D) Long axis views of AS (bottom) and sham (top) mice in early diastole revealing structural remodelling of the valve in AS. (E) Quantification of aortic leaflet area (see Supplementary Figure 5); n=9 each, ***P<0.001.
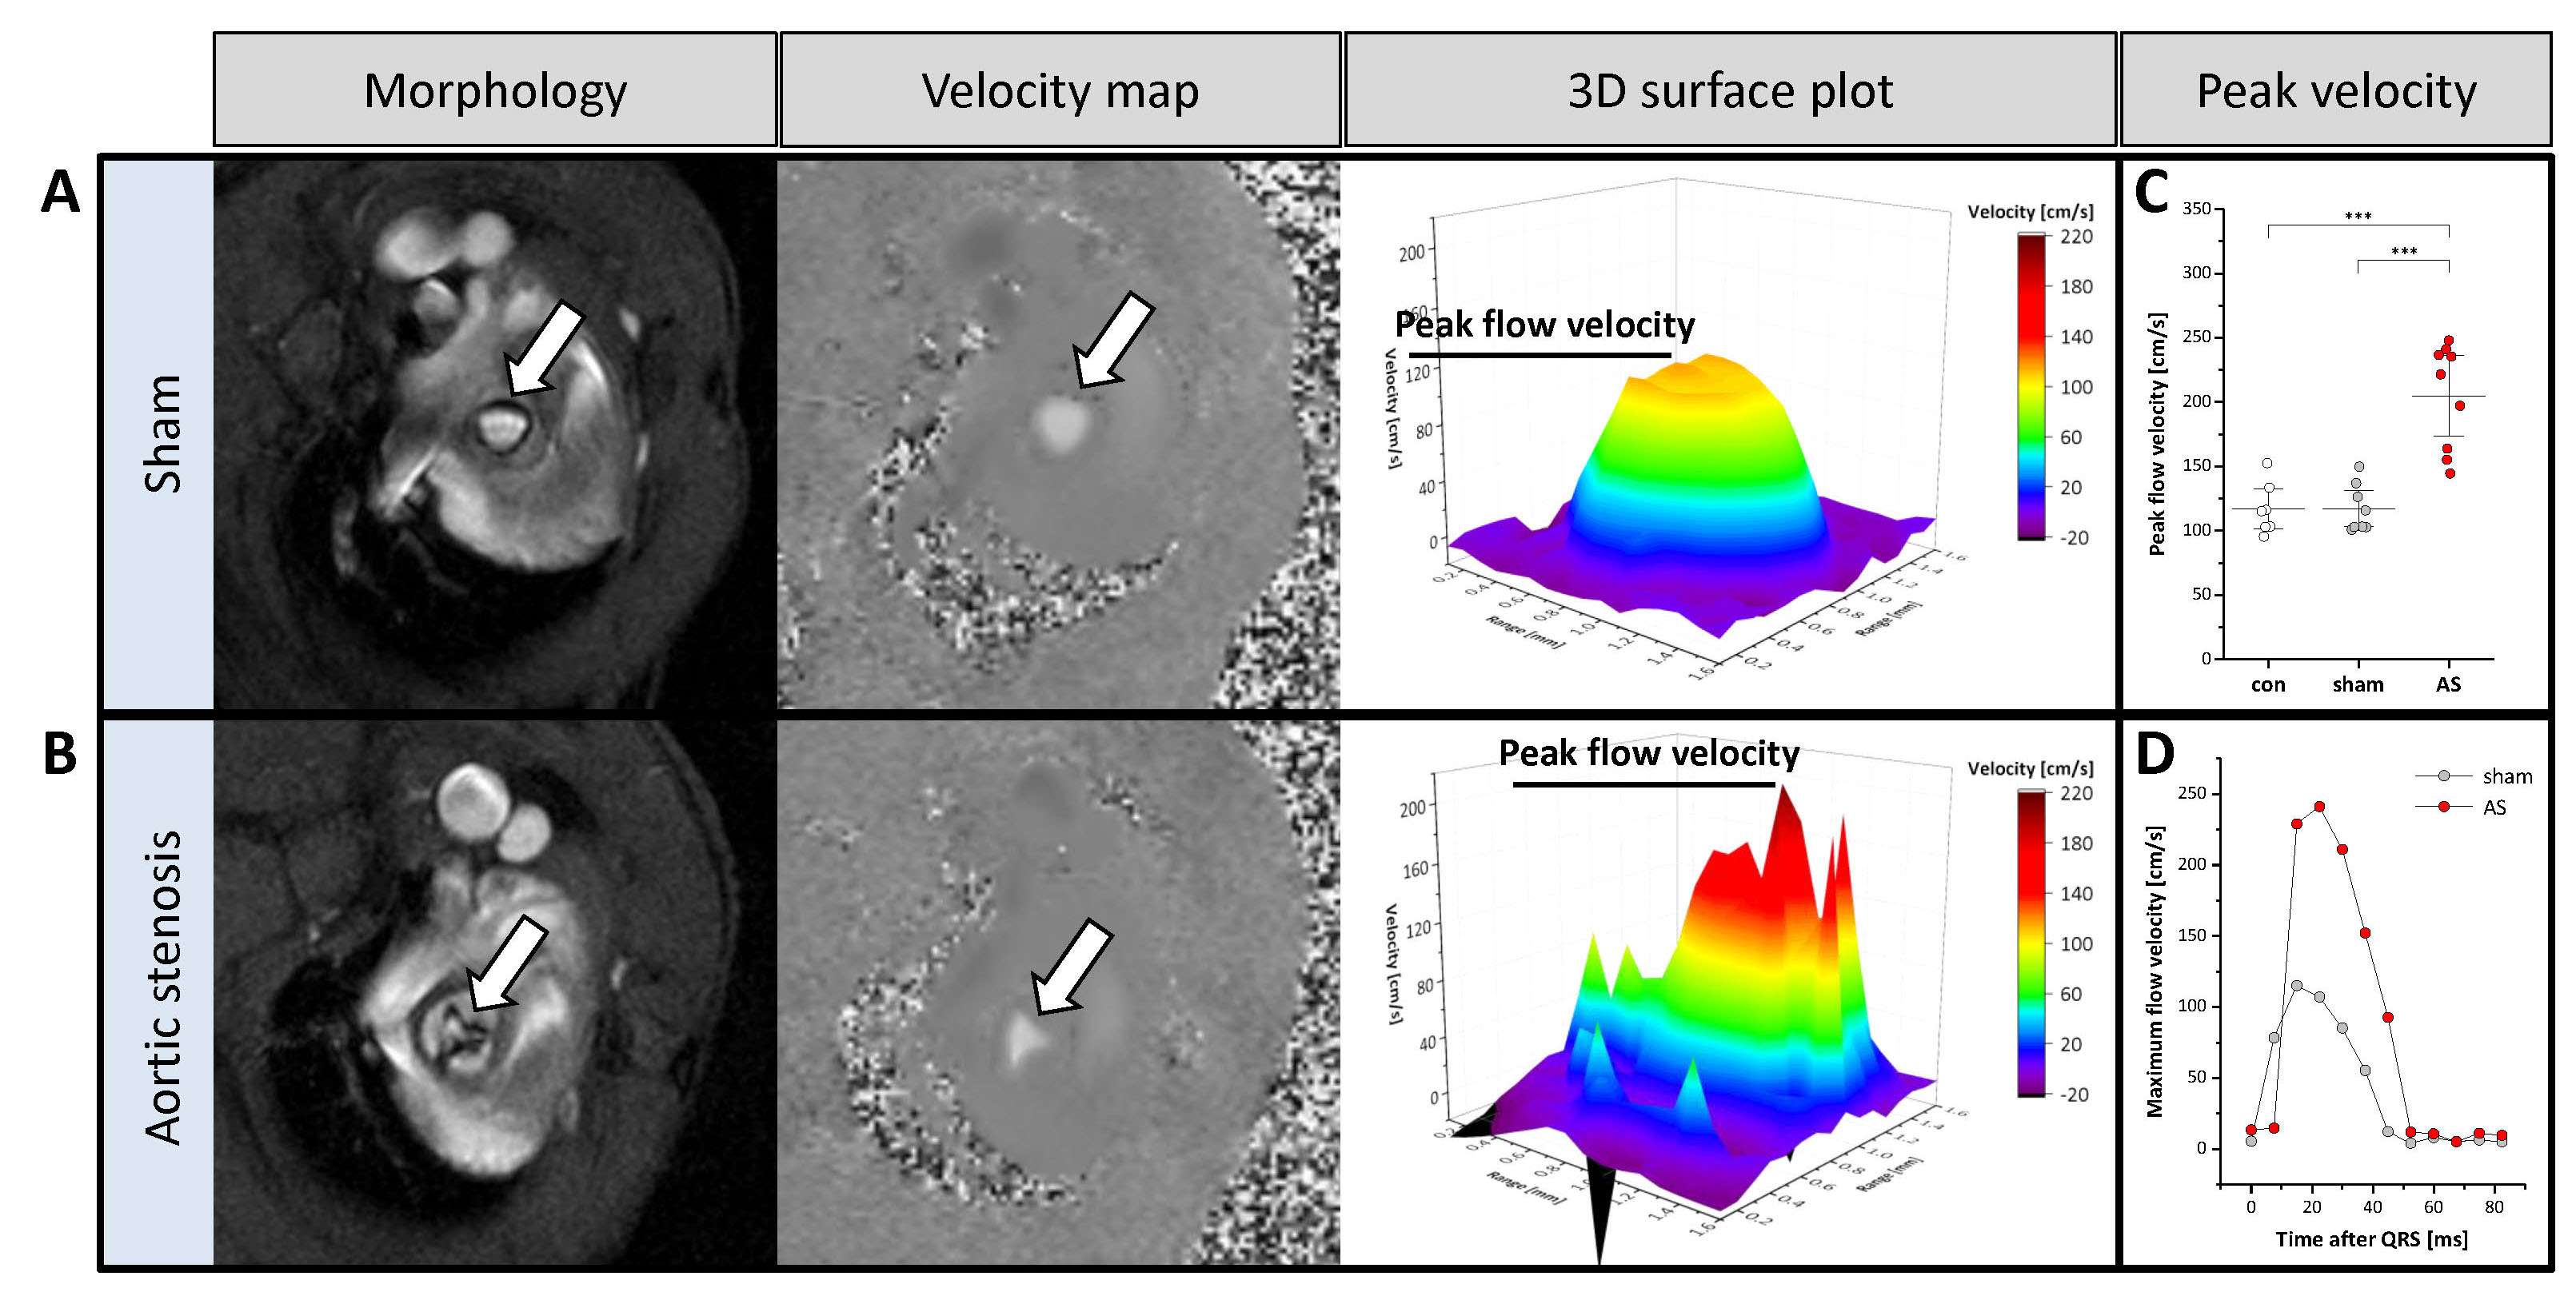
Figure 2: Aortic flow profiles
(A+B) Anatomical reference (left) and 2D velocity maps (middle) for assessment of blood flow at the level of the opened valve in sham controls (top) and AS (bottom). Velocity flow profiles were measured over the vessel cross section and are displayed as 3D surface plots in early systole (right). Peak velocity was higher in AS (C) and occurred later after valve opening as shown for two representative time courses of AS and sham-operated animals (D). Arrows indicate valve orifice; n=9 each, ***P<0.001.
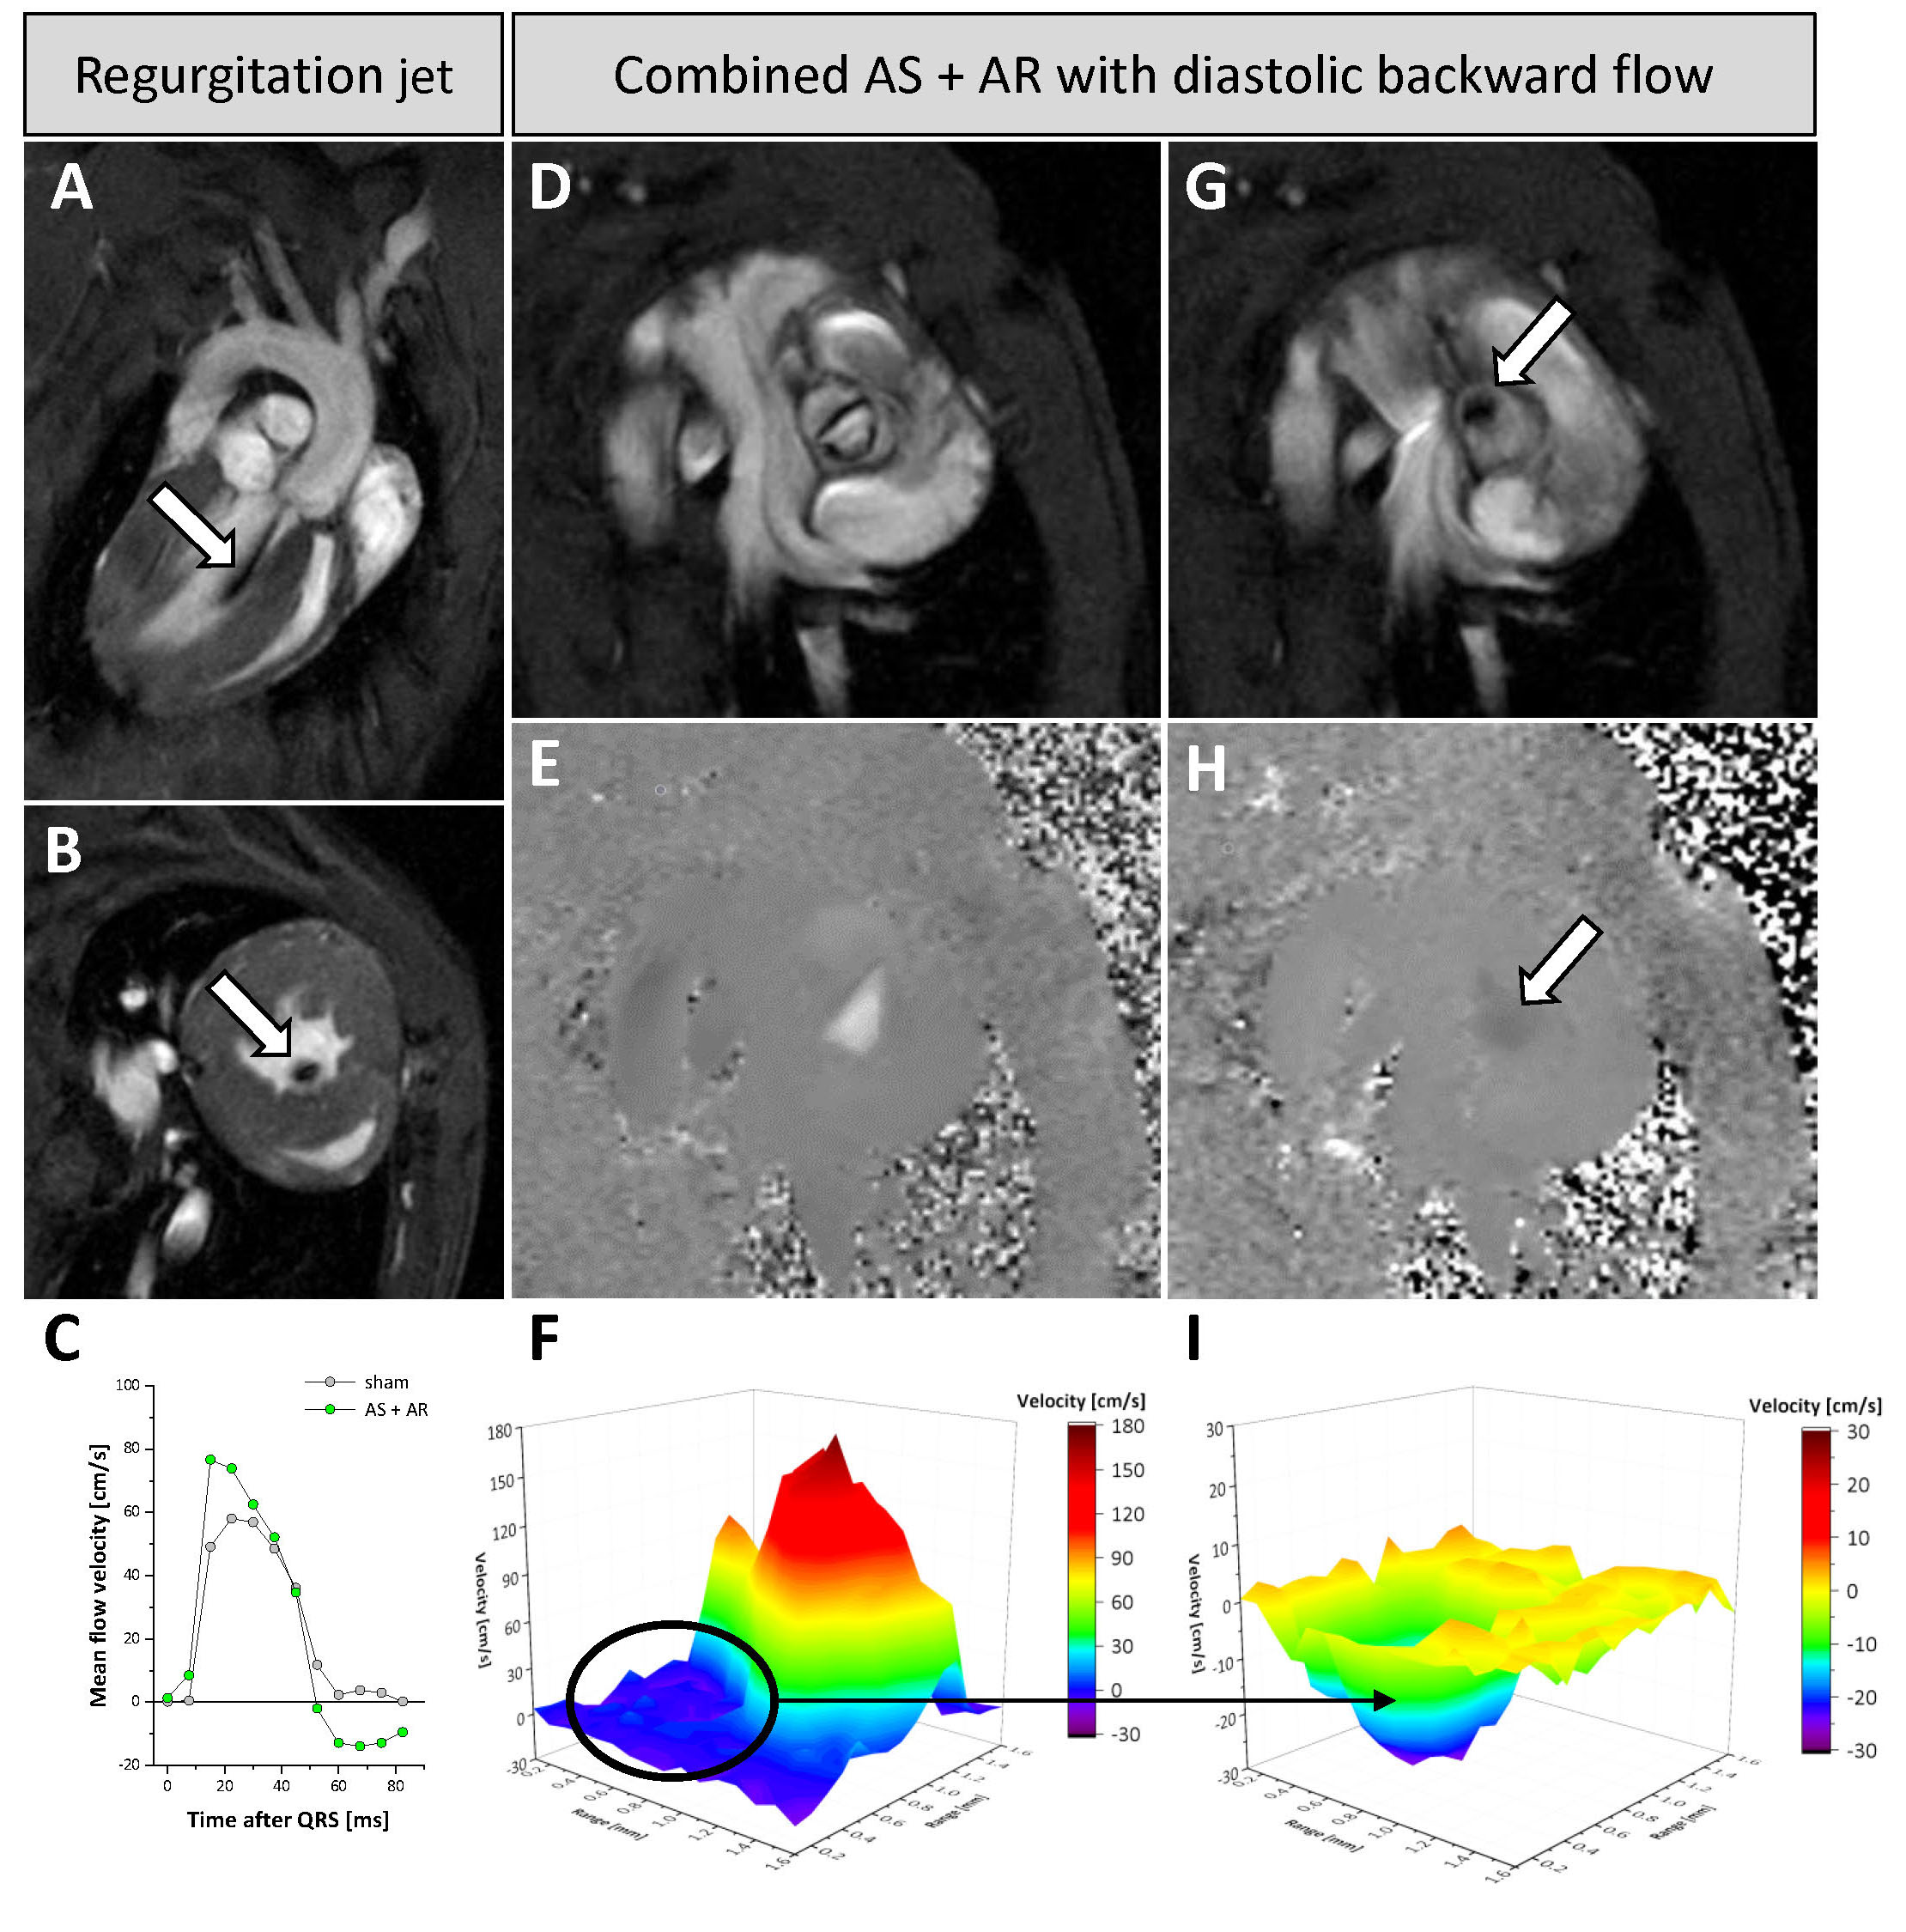
Figure 3: Aortic regurgitation combined with AS
Backward flow is reflected by black jets immediately after valve closure (arrows in (A+B+G)). Long (A) and short axis views at the mid ventricular (B) and valvular level (G) compared to the same view in systole (D). (E+H) Corresponding velocity maps to (D+G) show a slight dark backflow at the location of impaired valve opening (arrow in (H)). Negative backflow in combined AS+AR and an early rise due to pendular volume (C). Asymmetric 3D flow patterns over the stenotic valve in early systole (F) and diastolic backflow after valve flapping (I).
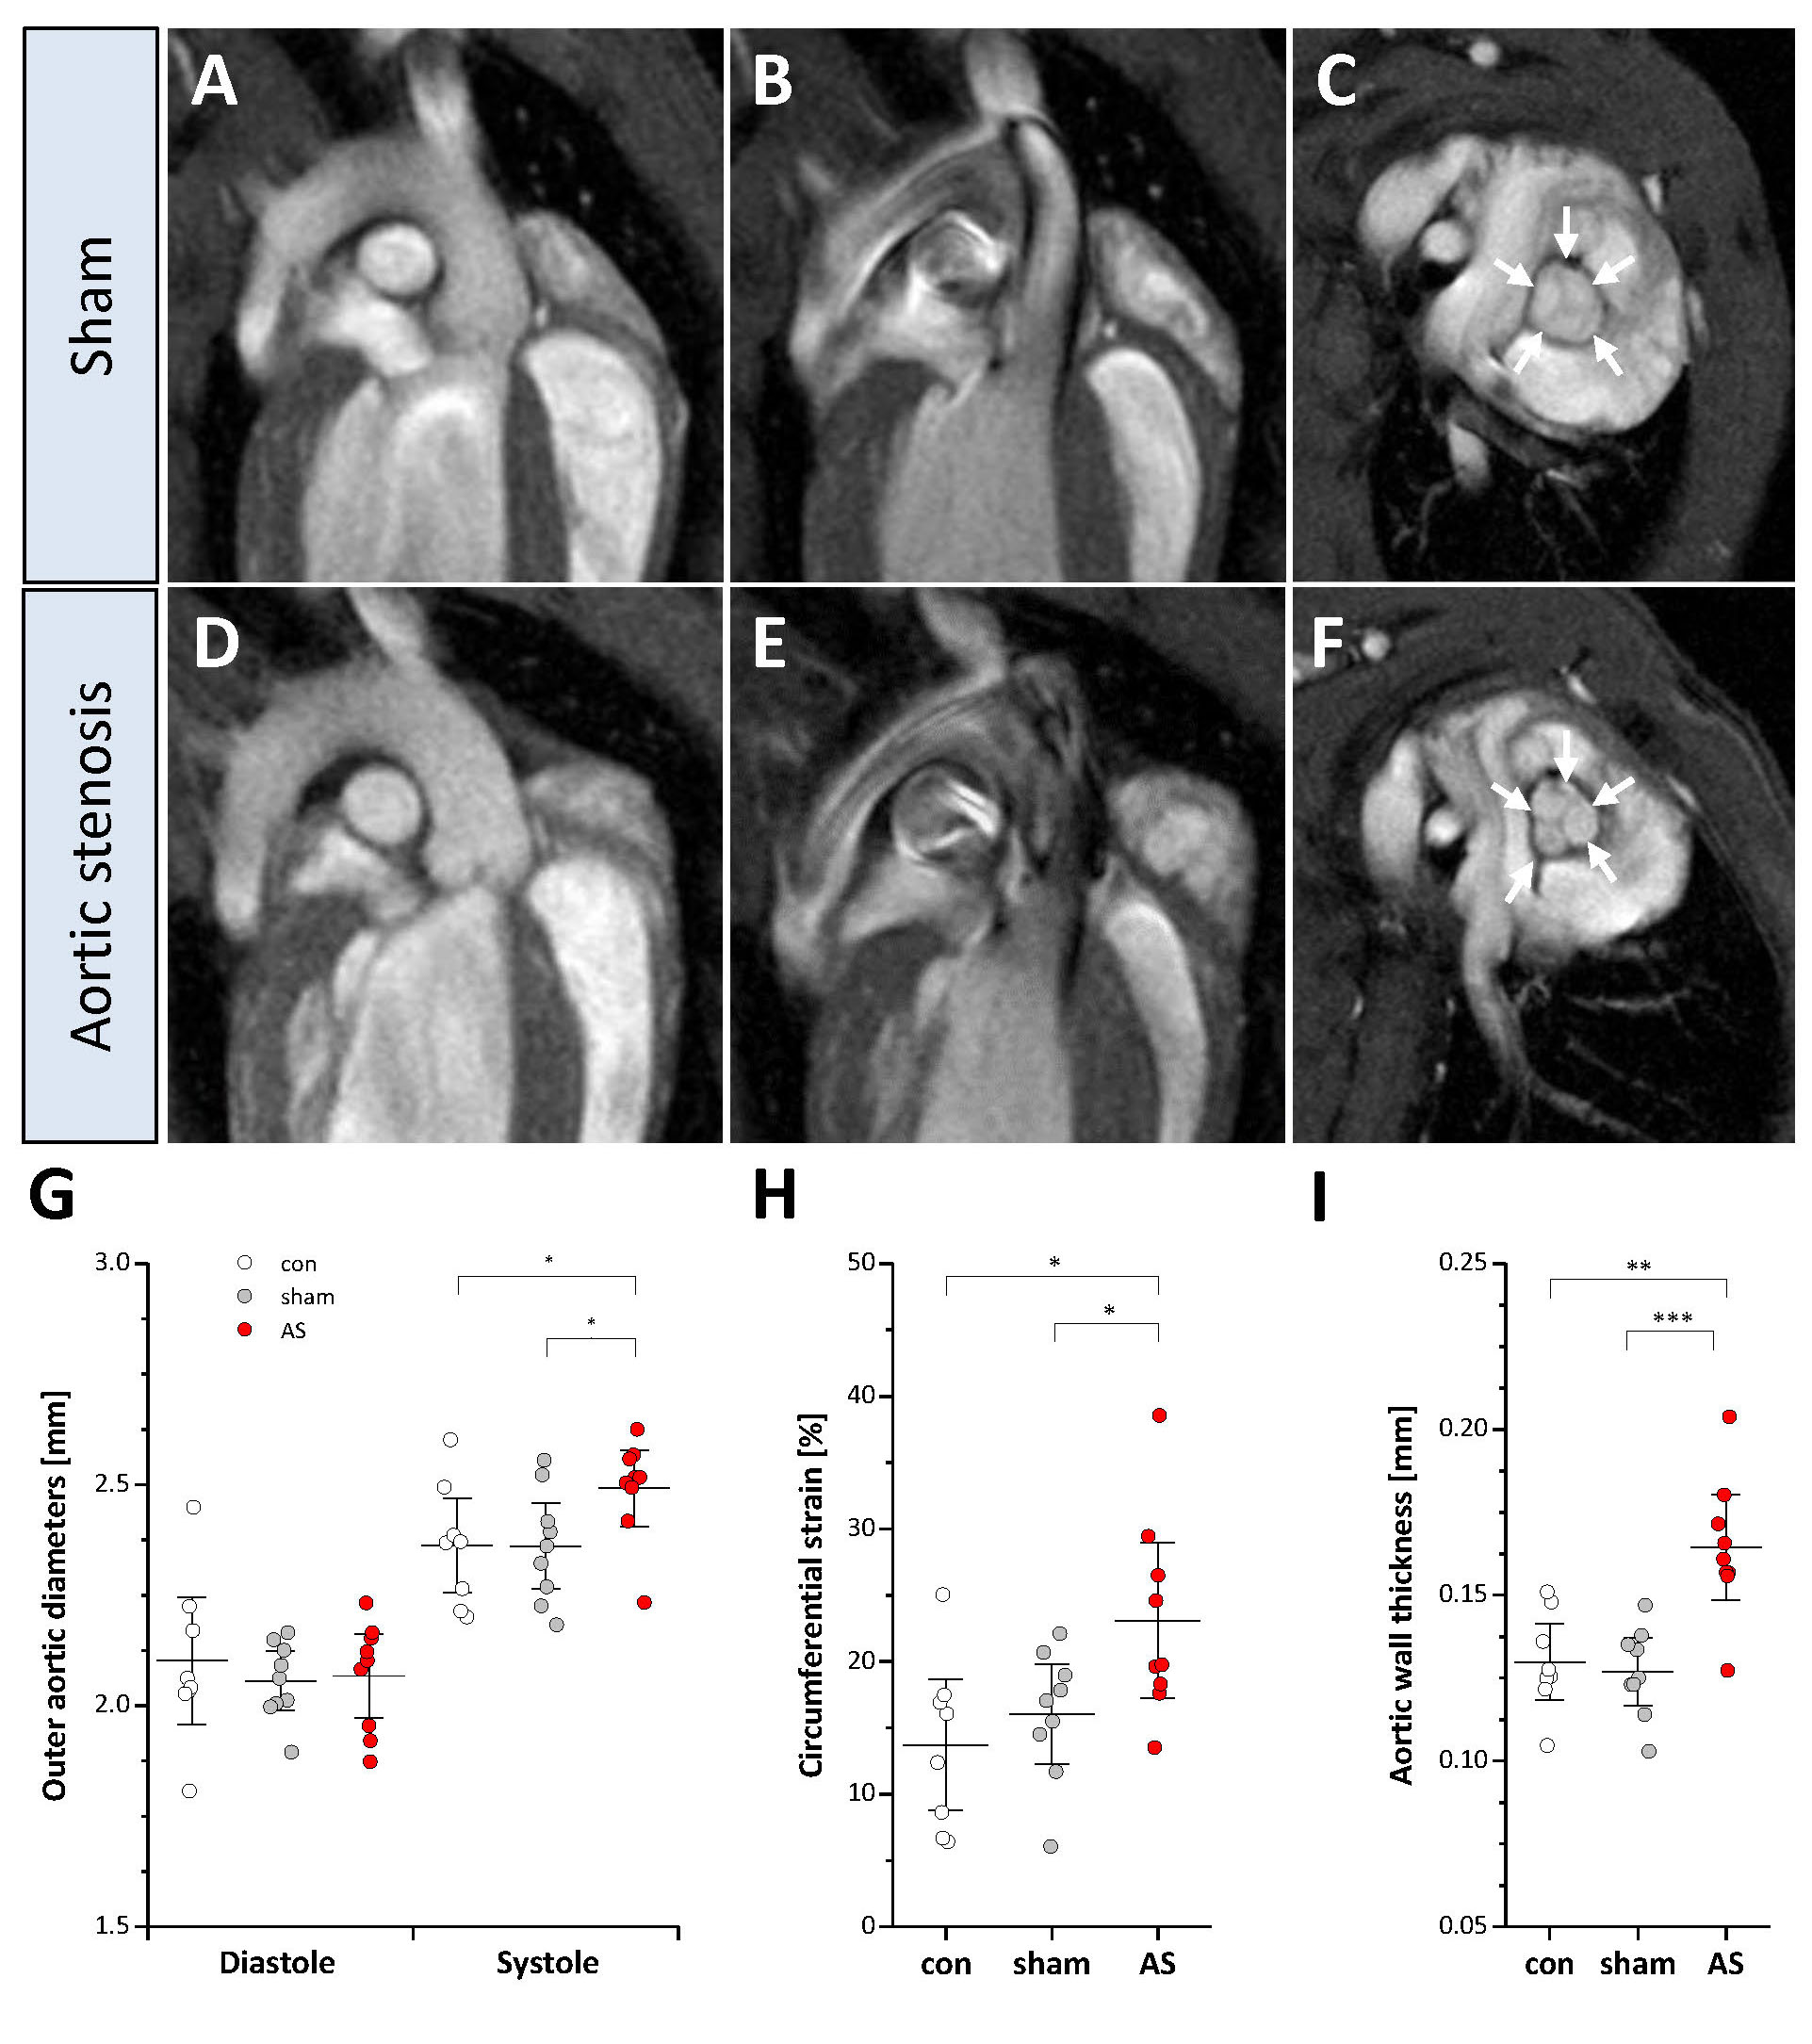
Figure 4: Aortic wall strain and morphology
(A+D) Aortic arch in end-diastole in sham controls and AS. (B) While sham mice exhibited a homogenous flow pattern in the ascending aorta in early systole, in AS turbulent flow occurred (black patchy flow artefacts) (E), which resulted in increased systolic distension (G) and enhanced circumferential strain in AS (H). (F+I) As a consequence, mice with AS displayed a thickening of the aortic wall (arrows) at the valvular level as compared to controls (C); n=9 each, *P<0.05, **P<0.01.
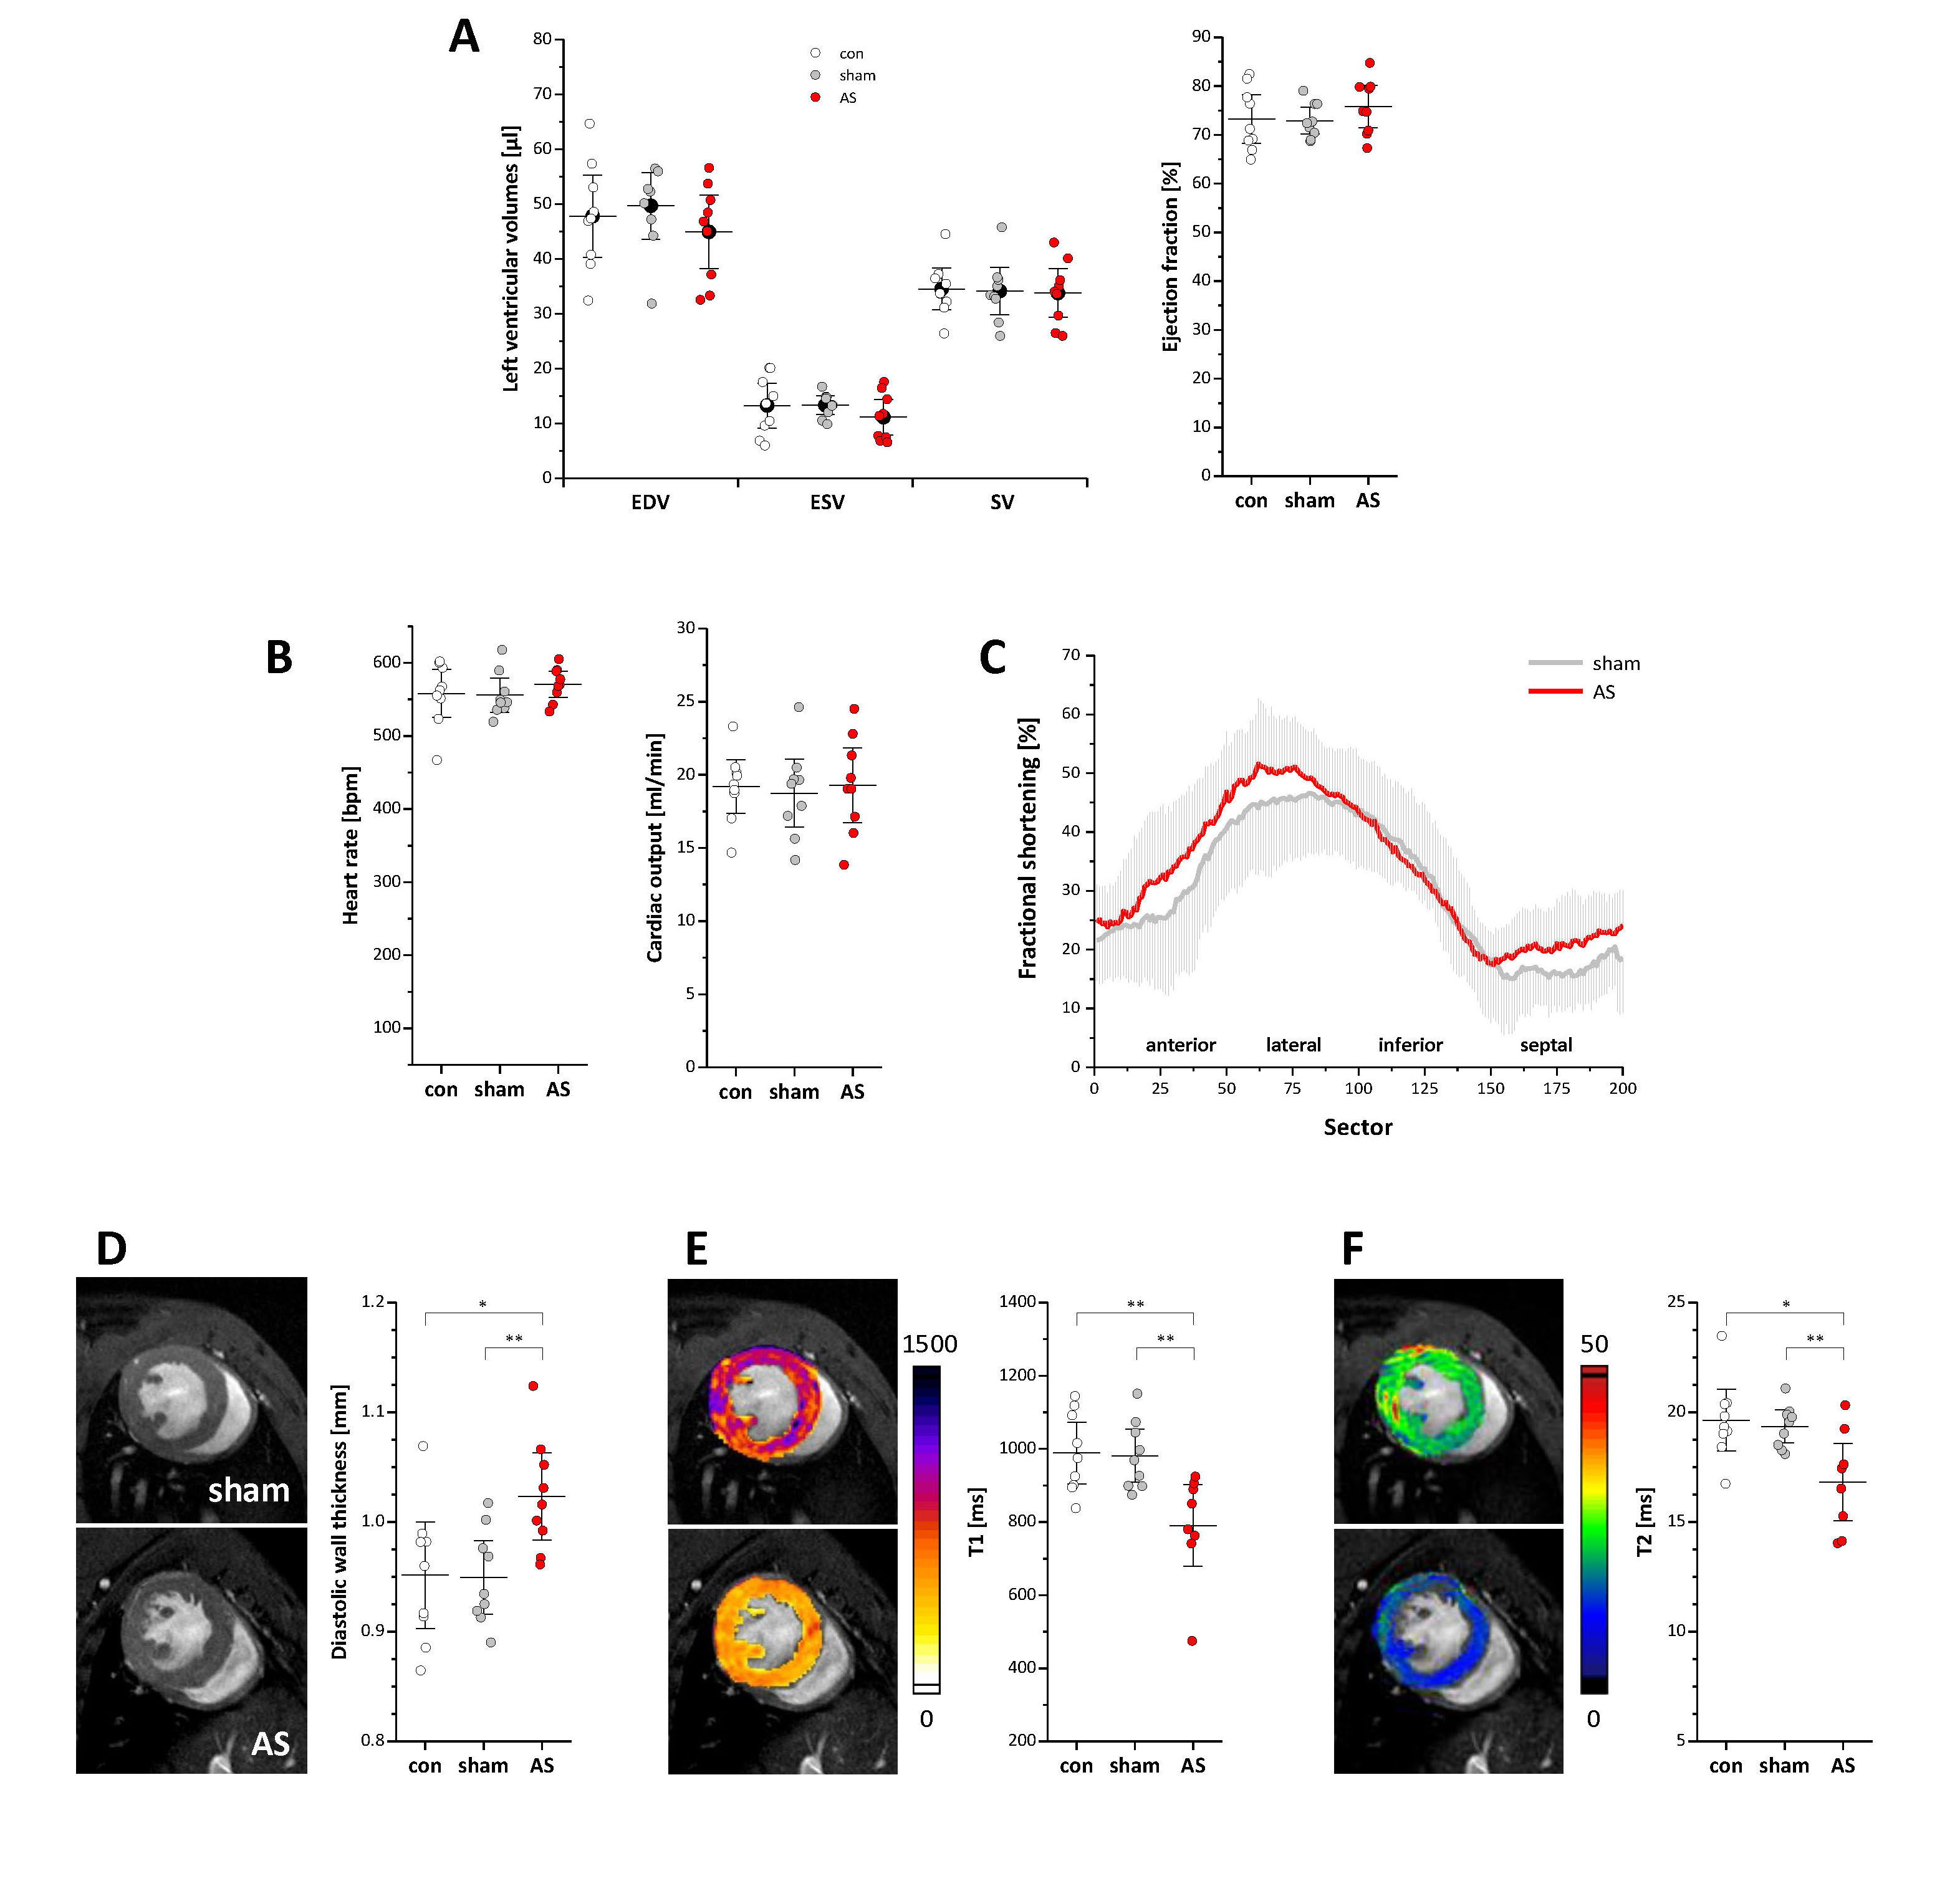
Figure 5: Left ventricular structural and functional changes
(A+B) Global left ventricular volumes, ejection fraction and cardiac output were unaltered in AS mice. (C) Regional analysis of cardiac function (see Supplementary Figure 2). For the sake of clarity, SDs are plotted in light grey and data of untreated controls were omitted; n=9 each. (D) Anatomical reference images demonstrated a significantly increased diastolic wall thickness in AS mice, which was accompanied by reduced myocardial T1 and T2 values as revealed by MR relaxometry (E+F); n=9 each, *P<0.05, **P<0.01.