0796
Effect of Temporal Resolution on Flow-Area Aortic Pulse Wave Velocity Measures Using Phase Contrast and Balanced SSFP MRI: A Preliminary Study1Medical Physics, University of Wisconsin - Madison, Madison, WI, United States
Synopsis
The flow-area (QA) method is a promising phase contrast (PC) technique to assess local aortic pulse wave velocity (PWV). However, validation for reduced temporal resolutions is lacking. Data analysis and automated post-processing are compromised because of varying PC image quality throughout the cardiac cycle. In this study, we acquire PC and bSSFP data at three temporal resolutions and measure QAPWV using PC data alone and by combining PC flow measures with bSSFP areas. We found that the highest temporal resolution datasets (10ms) provide the most accurate PWV measures and the method combining bSSFP and PC was less accurate.
Introduction
Pulse wave velocity (PWV) describes the rate at which blood pressure propagates through an artery and is inversely related to arterial stiffness1. 2D cine phase contrast (2DPC) MRI has been successfully used to non-invasively assess aortic PWV by measuring temporal shifts in flow waveforms between imaging planes and the vessel path length between these planes2. An alternative flow-area (QA) method was introduced by Vulliémoz et al. to probe local aortic PWV by evaluating flow and cross-sectional area changes during the increase in aortic flow (early systole) with a single slice acquisition3. However, their methodology used a very high acquired temporal resolutions of 8ms, which requires long breath-holds and is difficult to achieve in aging or diseased populations. In this pilot study, we aimed to validate PWV estimates with the QA method at multiple temporal resolutions in comparison to the established time-shift method (PWVTT). As a secondary aim, we validated the use of combining 2DPC flow measures with cross-sectional areas obtained using high-resolution, cine balanced steady-state free-procession (bSSFP) imaging.Methods
Three healthy volunteers (male; 22, 29, 55y) were imaged at 3T (MR750, GE Healthcare, WI) using a 32-channel phased array chest coil. Cartesian 2DPC scans were acquired with: three temporal resolutions [40/20/10ms]; ECG gating; TR/TE=5.0/3.0ms; flip=25˚; VENC=150cm/s; resolution=1.41x1.41mm; ASSET=2-3x acceleration. Heart rate-dependent parameters for one volunteer are: (heart rate~57); reconstructed frames=[33/66/88]; breath-held scan times=[15/23/35s]. Similarly, three sets of bSSFP scans were acquired with: ECG gating; TR/TE=3.3/1.3ms; flip=50˚; resolution=0.70x0.70mm; ASSET=2-3x acceleration; reconstructed frames=[43/101/307]; breath-held scan times=[10/16/28s]. For both sequences, an axial plane was placed in the aortic arch (Figure 1). Additionally, ungated anatomical images were acquired for vessel path length calculations.For the time-shift method, a user-interface was developed to semi-automatically determine PWVTT by tracing aortic centerlines and measuring flow waveform time shifts between the ascending and descending aorta with the cross-correlation method4.
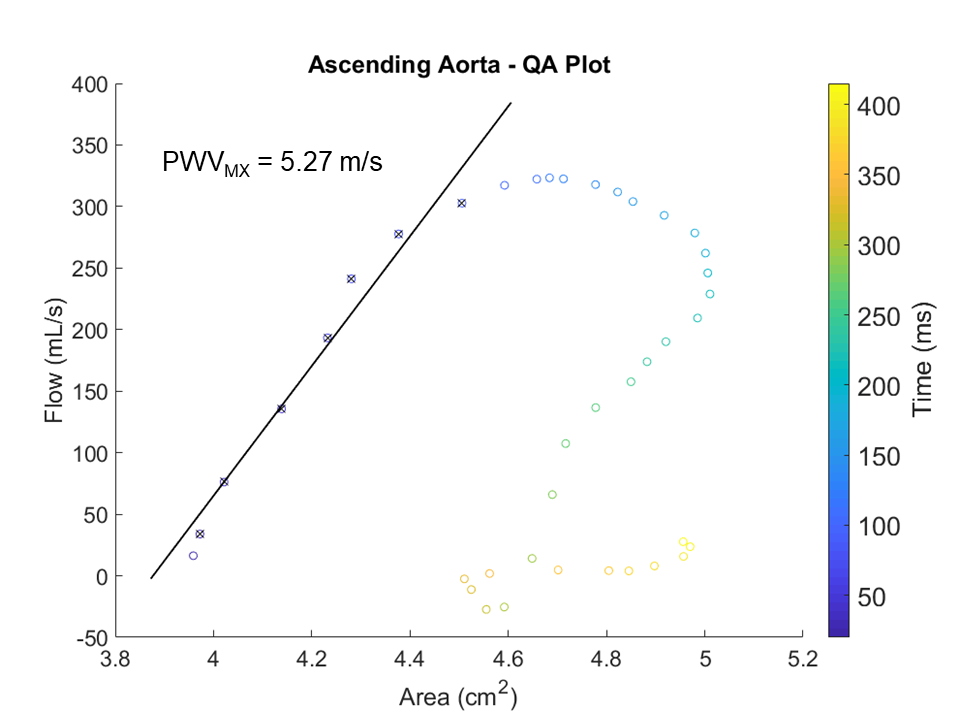
For the QA method, two separate methodological pipelines were developed: the original QA method3 performed on 2DPC images and a mixed method (MX) utilizing 2DPC and bSSFP images. Segmentations were performed via a semi-automatic method which included: circular Hough transforms, active contouring, dilation, and manual adjustment. Masks from bSSFP processing were then applied to the 2DPC images to calculate aortic flows for each frame and corresponding areas were calculated from bSSFP images (Figure 3). Due to differing temporal resolutions, both 2DPC and bSSFP sequences were interpolated down to 1ms before calculating flow and area per millisecond. After plotting flow versus time, the time frames corresponding to early systole were manually selected on the flow curve. Finally, flow versus area was plotted for systole and the slope of the fit of early systole points (PWVMX) was calculated (Figure 4).
For each subject, PWV was calculated once via time-shift method, and twice for the QA and MX methods (ascending and descending aorta) for three resolutions (10/20/40ms). The average PWV between ascending and descending aortas was calculated for QA and MX methods and compared against the time-shift method.
Results
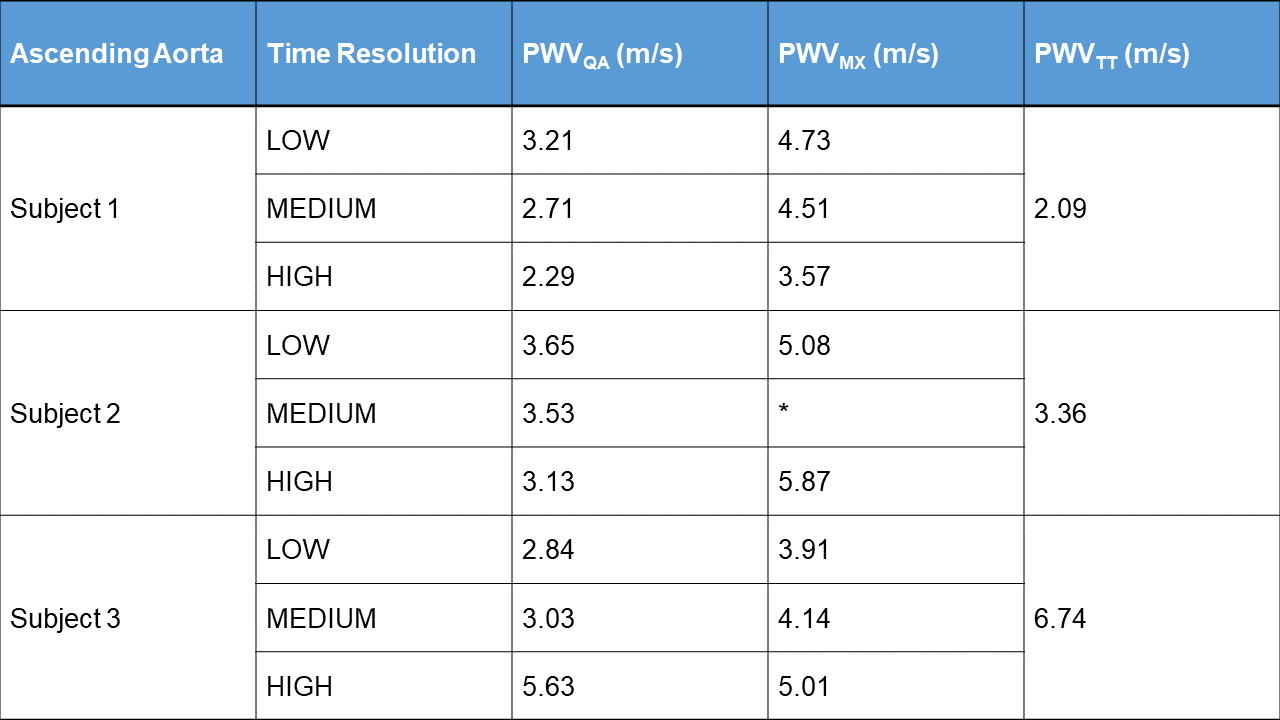
Results are tabulated in Figure 5. For subjects 1 and 3, there was a close correlation between the two methods with PWV values for the highest resolution scans approaching the PWVTT value. PWVQA was closer to PWVTT than PWVMX in both subjects. There was less agreement in subject 2 between the QA and MX methods but PWVQA still approached PWVTT.Discussion
The PWVQA values from the highest resolution scans were very close to the standard time-shift method PWVs. Increasing the resolution further would lead to closer agreement as demonstrated by Vulliémoz et al.3 but necessitates longer scan times and breath holds which is not feasible in older patients. Conversely, the QA method is sensitive to the points manually defined to be in systole. With low temporal resolutions, only 2-4 points could be identified on the linear portion of the QA plot, leading to large fluctuations in PWV. Higher temporal resolutions lead to more consistent fits, as illustrated in Figure 2.The decision to use area measures from bSSFP images was motivated by the challenge of segmenting early systolic frames on 2DPC images with low spatial resolution and compromised aortic contrast (Figure 1). The bSSFP images had higher CNR and SNR which made segmentation easier and enabled more automation. However, changes in the subjects’ heart rate and differing trigger delays between scans led to different temporal resolutions which necessitated interpolation. While segmentation was faster in the MX method, the results were not as close to the time-shift method, likely due to interpolation affecting area calculations.
Lastly, it should be noted that PWVTT measures PWV across a segment between the two ROIs while PWVQA and PWVMX reflect local vessel stiffness relative to that ROI. Hence, perfect agreement cannot be expected and PWVTT does not represent the gold standard. Nonetheless, agreement is expected to be close.
Conclusion
From preliminary results, PWVs calculated via the QA method agree with the standard time-shift method when high temporal resolutions are used. The proposed MX method had a faster analysis pipeline than the QA method but was less accurate. Future studies look to increase sample size, perform repeatability studies, validate with pressure wires, and implement fully-automated segmentation.Acknowledgements
We gratefully acknowledge research support from GE Healthcare and funding support from the National Institutes of Health (F31- AG071183, R01-AG027161, R01-AG062167).References
1. Cavalcante JL, Lima JA, Redheuil A, Al-Mallah MH. Aortic stiffness: current understanding and future directions. J Am Coll Cardiol 2011;57(14):1511-1522.
2. Wentland AL, Grist TM, Wieben O. Review of MRI-based measurements of pulse wave velocity: a biomarker of arterial stiffness. Cardiovasc Diagn Ther 2014;4(2):193-206.
3. Vulliemoz S, Stergiopulos N, Meuli R. Estimation of local aortic elastic properties with MRI. Magn Reson Med 2002;47(4):649-654.
4. Fielden SW, Fornwalt BK, Jerosch-Herold M, Eisner RL, Stillman AE, Oshinski JN. A new method for the determination of aortic pulse wave velocity using cross-correlation on 2D PCMR velocity data. J Magn Reson Imaging 2008;27(6):1382-1387.
Figures