0795
Fully automated aortic pulse wave velocity calculation from 4D flow MRI with AI-based segmentation
Ethan M I Johnson1, Haben Berhane1, Michael Scott1, Kelly Jarvis1, Alex Barker2, and Michael Markl1
1Northwestern University, Chicago, IL, United States, 2University of Colorado Anschutz Medical Campus, Aurora, CO, United States
1Northwestern University, Chicago, IL, United States, 2University of Colorado Anschutz Medical Campus, Aurora, CO, United States
Synopsis
Pulse wave velocity (PWV) is an important measure of vessel stiffness and can be quantified from 4D flow MRI. Accurate assessment of PWV requires placement of multiple analysis planes in an imaged volume, which typically is performed manually to some degree, such as through use of a vessel segmentation made by an experienced human observer. Here we present evaluation of a fully-automated method for calculating PWV in the thoracic aorta, incorporating an artificial intelligence (AI) convolutional neural network to segment the aorta. Estimates of PWV using AI segmentations were compared those from human-observer segmentations and found to be similarly reliable.
Introduction
Aortic wall stiffness is a biophysical parameter of interest in the study of aortic disease, such as aneurysm, connective tissue disease, or congenital valve disorders 1,2. Pulse wave velocity (PWV) of the blood flowing through the aorta can be used as a surrogate measure for vessel stiffness, and it can be characterized from aortic 4D flow MRI 3,4,5. However, quantification of PWV requires careful positioning of multiple 2D analysis planes along the vessel using a 3D segmentation of the aorta, which is frequently performed manually. As a result, PWV is potentially sensitive to human observer biases. Deep learning / artificial intelligence (AI) networks have been demonstrated capable of performing such segmentation tasks reliably 6,7, particularly when image contrast is predictable, and thus they may be useful in standardizing PWV calculation. Here, we present an evaluation of the human inter-observer variability in manual aortic segmentation-based PWV quantification compared to completely automatic 3D aorta segmentations and PWV calculations by an AI deep learning convolutional neural network. Our goal was to assess the human vs. machine performance for fully automated, standardized PWV quantification.Methods
An institutional database with cardiothoracic MRI data including 4D flow was queried to identify three types of subjects: healthy volunteers (no known cardiovascular disease), patients with bicuspid aortic valve (BAV) and aortic dilatation (≥4cm aortic diameter), and patients with tricuspid aortic valve (TAV) and dilatation. All included patients had ejection fraction above 50% and less-than mild valve dysfunction (stenosis, regurgitation). The 4D flow MRI covered the full thoracic aorta using 340-420×255-341×66-104mm3 FOV, 1.8-2.6×1.8-2.6×2.2-4.0 mm3/36-42ms spatial/temporal resolution, 80-500cm/s VENC (chosen from flow scout), 2.2-2.8ms TE, 4.1-5.7ms TR, 7-25° flip, with free breathing/respiratory navigators, at 1.5T and 3T, with or without contrast agents. For all datasets, sum-of-squares 3D phase contrast MR angiography (3DPCMRA) images were generated for use in segmentation, with pre-processing to correct phase errors from eddy currents and aliasing.Three sets of aortic segmentations for all subjects were performed using 3DPCMRA images. Two sets were performed by human observers with experience processing 4D flow MRI data and segmenting the thoracic aorta (PhD/MD/graduate-student cardiovascular imaging researchers) with commercial processing software (Mimics, Materialise). The first set was formed from two observers, and the second was from four observers. The third set of segmentations was generated automatically by a convolutional neural network (3D U-Net configuration 8 with DenseNet-based dense blocks 9) that was trained and validated with a wide range of subjects (age range 3-91 years, various healthy/disease statuses), as described in a previous study 7. Each of the three (two human, one AI) segmentations was used to calculate PWV in an automated processing framework (fig.1), using through-plane flow cross-correlation maximization, as described in a different, previous study 5.
The set of calculated PWV values were compared for each subject to evaluate inter-observer reliability for human vs. human segmentation and for human vs. AI segmentation (fig.2). Intra-class correlation coefficients (ICC) and mean difference / limits of agreement (LoA) were calculated in these comparisons, and Bland-Altman plots were created for each. Comparisons for human vs. AI were performed separately with each set of segmentations (i.e. human 1 vs. AI and human 2 vs. AI).
Results
A total of 86 subjects were included, including 16 healthy volunteers, 43 BAV patients, and 27 TAV patients. Subjects ranged in age from 20y to 79y (49y±15y, 45 male). The range of PWV for subjects calculated from any segmentation was 3.9–9.3m/s (fig.3). For PWV calculated from human-observer segmentations, the mean difference between values was –0.02m/s with LoA [–0.33m/s,+0.29m/s]; comparison of PWV from human 1 vs. AI segmentation had mean difference 0.00 with LoA [–0.30m/s,0.30m/s]; and human 2 vs. AI had mean difference 0.01m/s with LoA [–0.38m/s,+0.40m/s]. The ICC values for both comparisons with human 1 were 0.993; for human 2 vs. AI, ICC was 0.988. Agreement for PWV calculations do not vary substantively when segregated by subject type for either comparison, with LoA and ICC ranging from [–0.43m/s,+0.43m/s] and 0.984 (healthy) to [–0.28m/s,+0.22m/s] and 0.995 (TAV dilatation) for human vs. human, and [–0.26m/s,+0.51m/s] and 0.982 (healthy) to [–0.27,0.19] and 0.996 (TAV dilatation) for any human vs. AI.Discussion
The close concordance between inter-observer comparisons of PWV calculated from human segmentations and AI segmentations demonstrates that quantitative results derived from AI-based aorta segmentations are similarly reliable to those from trained human observers. Notably, the AI-based segmentation procedure is fully standardized, and it can be coupled with the PWV assessment algorithm (fig.1) to create a reliable, automated method for calculating PWV from 4D flow MRI. A follow-up test, re-test analysis, in which human/AI observers process serial measurements from the same subjects, would provide further validation of this concept.Conclusion
Here, we have presented an evaluation of completely automatic calculation for aortic PWV, which can serve as a surrogate measure for aortic wall stiffness. By using an AI network for aortic segmentation with standardized cross-correlation-maximization PWV calculation, no human inputs were required to estimate PWV from 4D flow MR images. The inter-observer variability for PWV calculated from AI-based segmentations compared to that of two human observers was similar, thus demonstrating a high degree of reliability for the fully automated PWV estimates.Acknowledgements
NIH TL1TR001423, R01HL115828, F30HL145995, R01HL133504, and T32HL134633References
1. Cavalcante JL, Lima JAC, Redheuil A, Al-Mallah MH. Aortic Stiffness. Journal of the American College of Cardiology. 2011 Apr;57(14):1511–22.2. Kuijpers JM, Mulder BJ. Aortopathies in adult congenital heart disease and genetic aortopathy syndromes: management strategies and indications for surgery. Heart. 2017 Jun;103(12):952–66.
3. Markl M, Wallis W, Brendecke S, Simon J, Frydrychowicz A, Harloff A. Estimation of global aortic pulse wave velocity by flow-sensitive 4D MRI: Global Aortic Pulse Wave Velocity. Magn Reson Med. 2010 Jun;63(6):1575–82.
4. Wentland AL, Grist TM, Wieben O. Review of MRI-based measurements of pulse wave velocity: a biomarker of arterial stiffness. 2014. 2014;4(2):193–206.
5. Jarvis K, Soulat G, Scott M, Vali A, Pathrose A, Syed AA, et al. Investigation of Aortic Wall Thickness, Stiffness and Flow Reversal in Patients With Cryptogenic Stroke: A 4D Flow MRI Study. J Magn Reson Imaging. 2020 Aug 31;jmri.27345.
6. van Pelt R, Nguyen H, ter Haar Romeny B, Vilanova A. Automated segmentation of blood-flow regions in large thoracic arteries using 3D-cine PC-MRI measurements. Int J CARS. 2012 Mar;7(2):217–24.
7. Berhane H, Scott M, Elbaz M, Jarvis K, McCarthy P, Carr J, et al. Fully automated 3D aortic segmentation of 4D flow MRI for hemodynamic analysis using deep learning. Magn Reson Med. 2020 Oct;84(4):2204–18.
8. Çiçek Ö, Abdulkadir A, Lienkamp SS, Brox T, Ronneberger O. 3D U-Net: Learning Dense Volumetric Segmentation from Sparse Annotation. In: Ourselin S, Joskowicz L, Sabuncu MR, Unal G, Wells W, editors. Medical Image Computing and Computer-Assisted Intervention – MICCAI. 2016. p. 424–32.
9. Huang G, Liu Z, Van Der Maaten L, Weinberger KQ. Densely Connected Convolutional Networks. In: 2017 IEEE Conference on Computer Vision and Pattern Recognition (CVPR). Honolulu, HI: IEEE; 2017. p.2261–9.
Figures
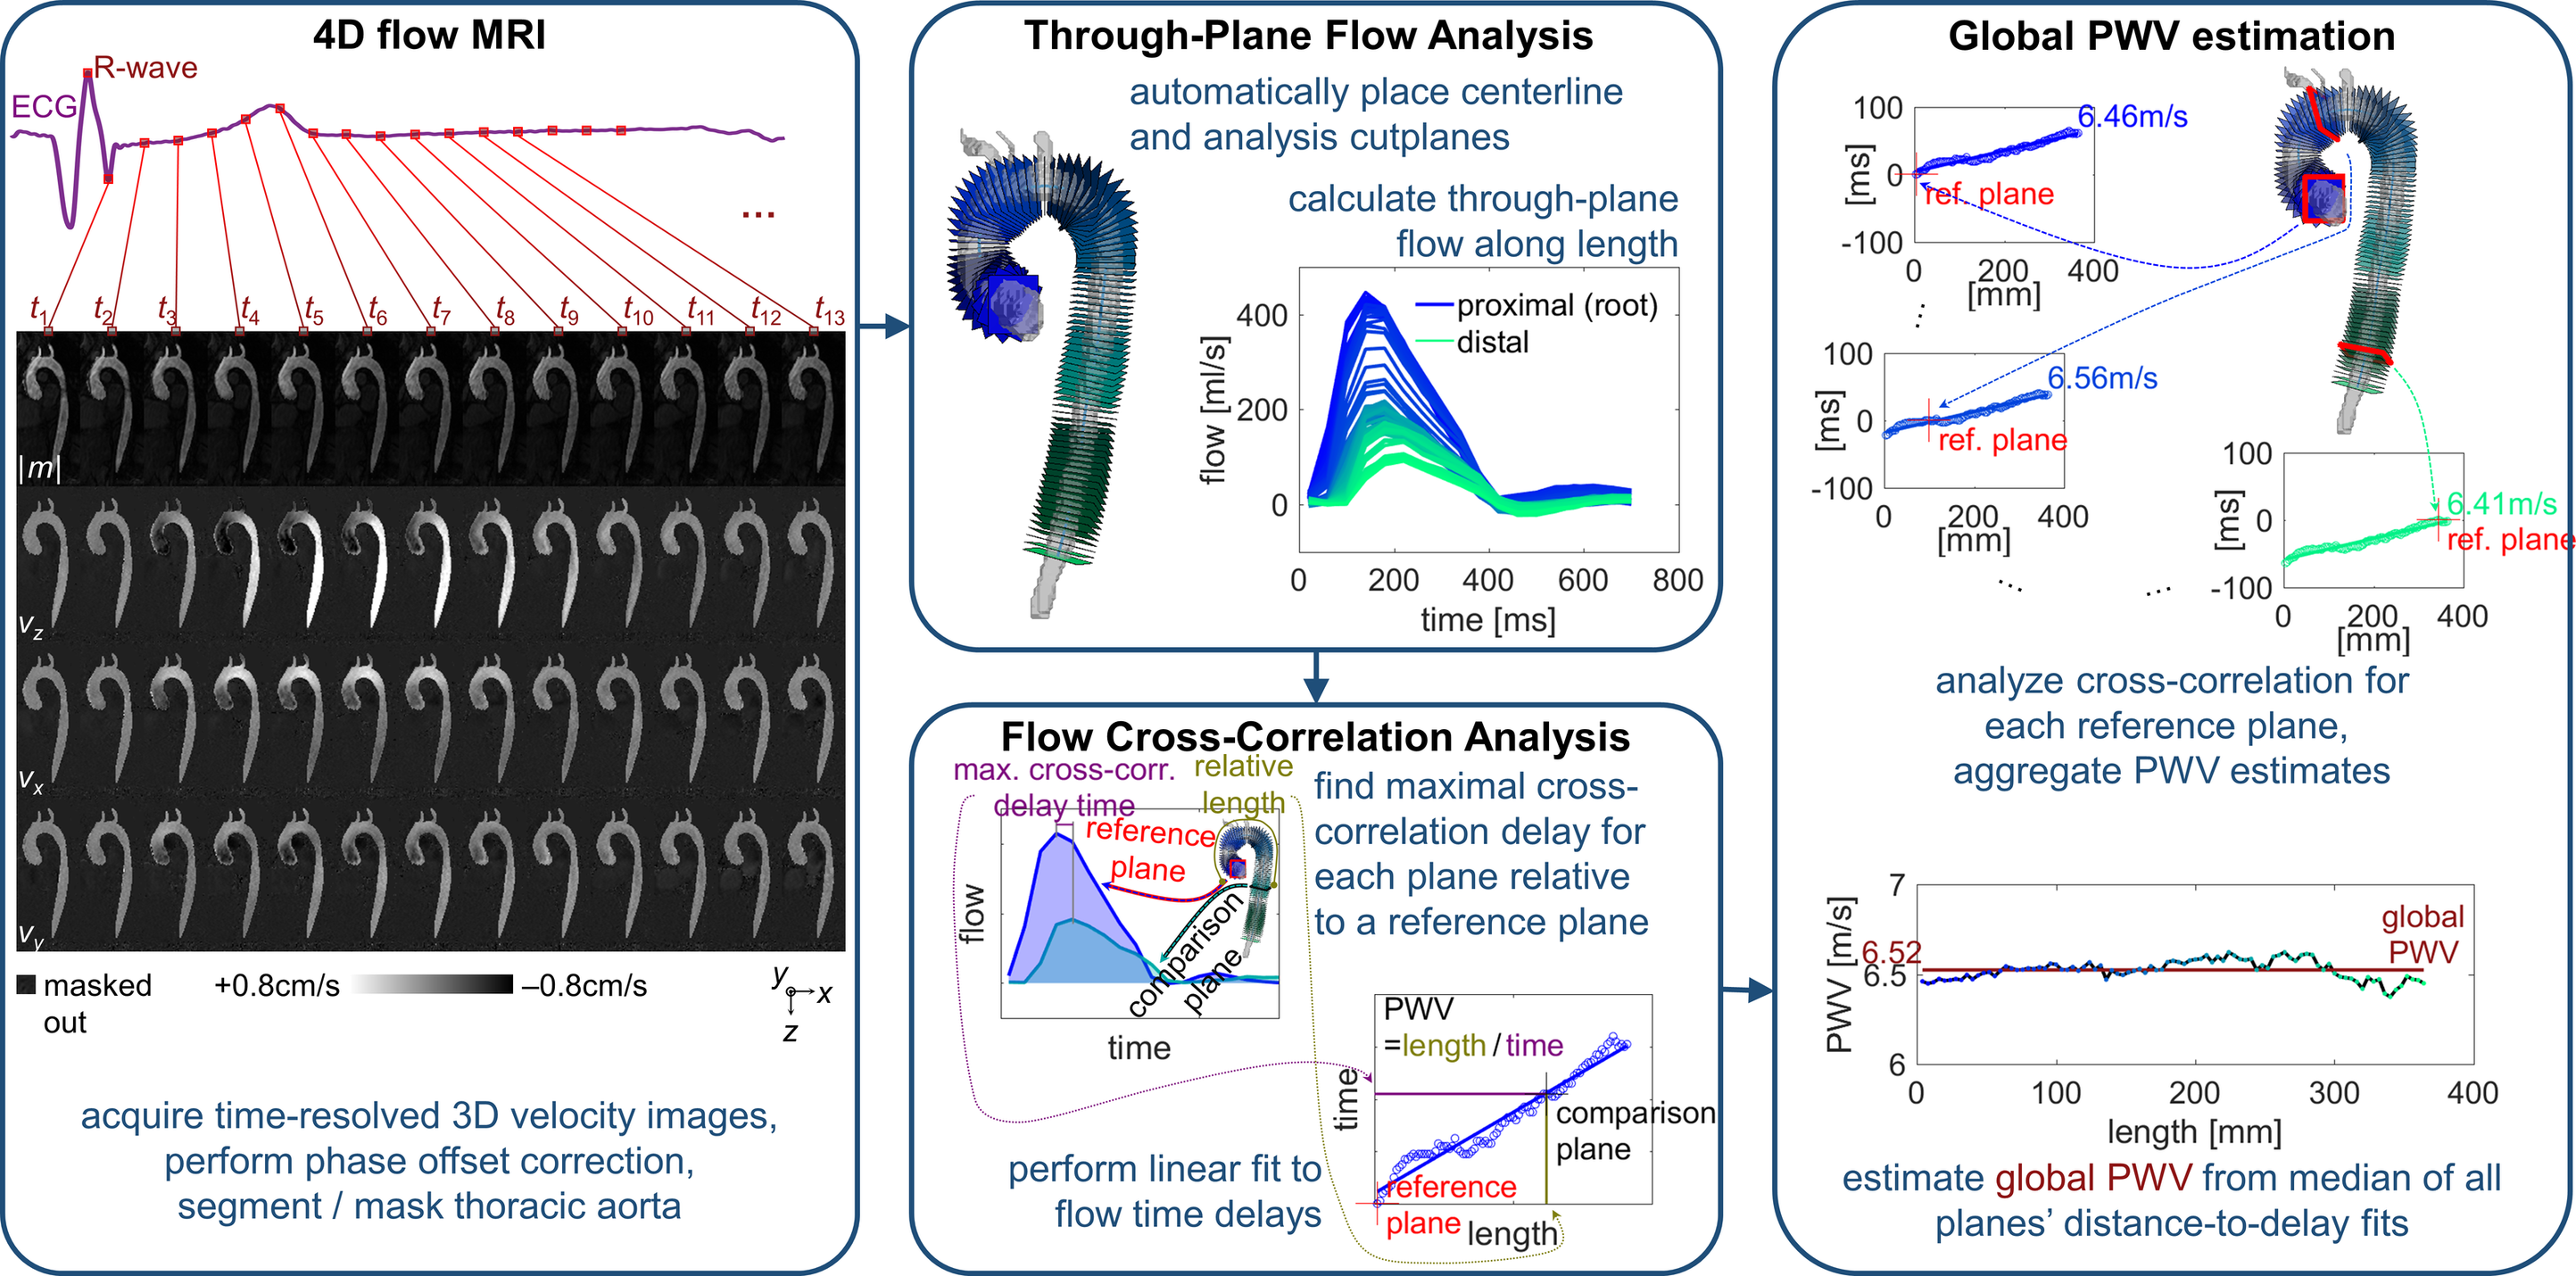
Figure 1. Calculation of pulse wave velocity (PWV) from 4D flow MRI data. Raw phase contrast data from 4D flow is segmented by human observer or AI network (left); automated placement of a centerline and cutplanes is performed to compute through-plane flow (center, top); cross-correlation maximization is used to identify pulse transit time (center, bottom); and a global estimate of PWV is formed from fits of the length vs. time relationship along the full aorta (right).
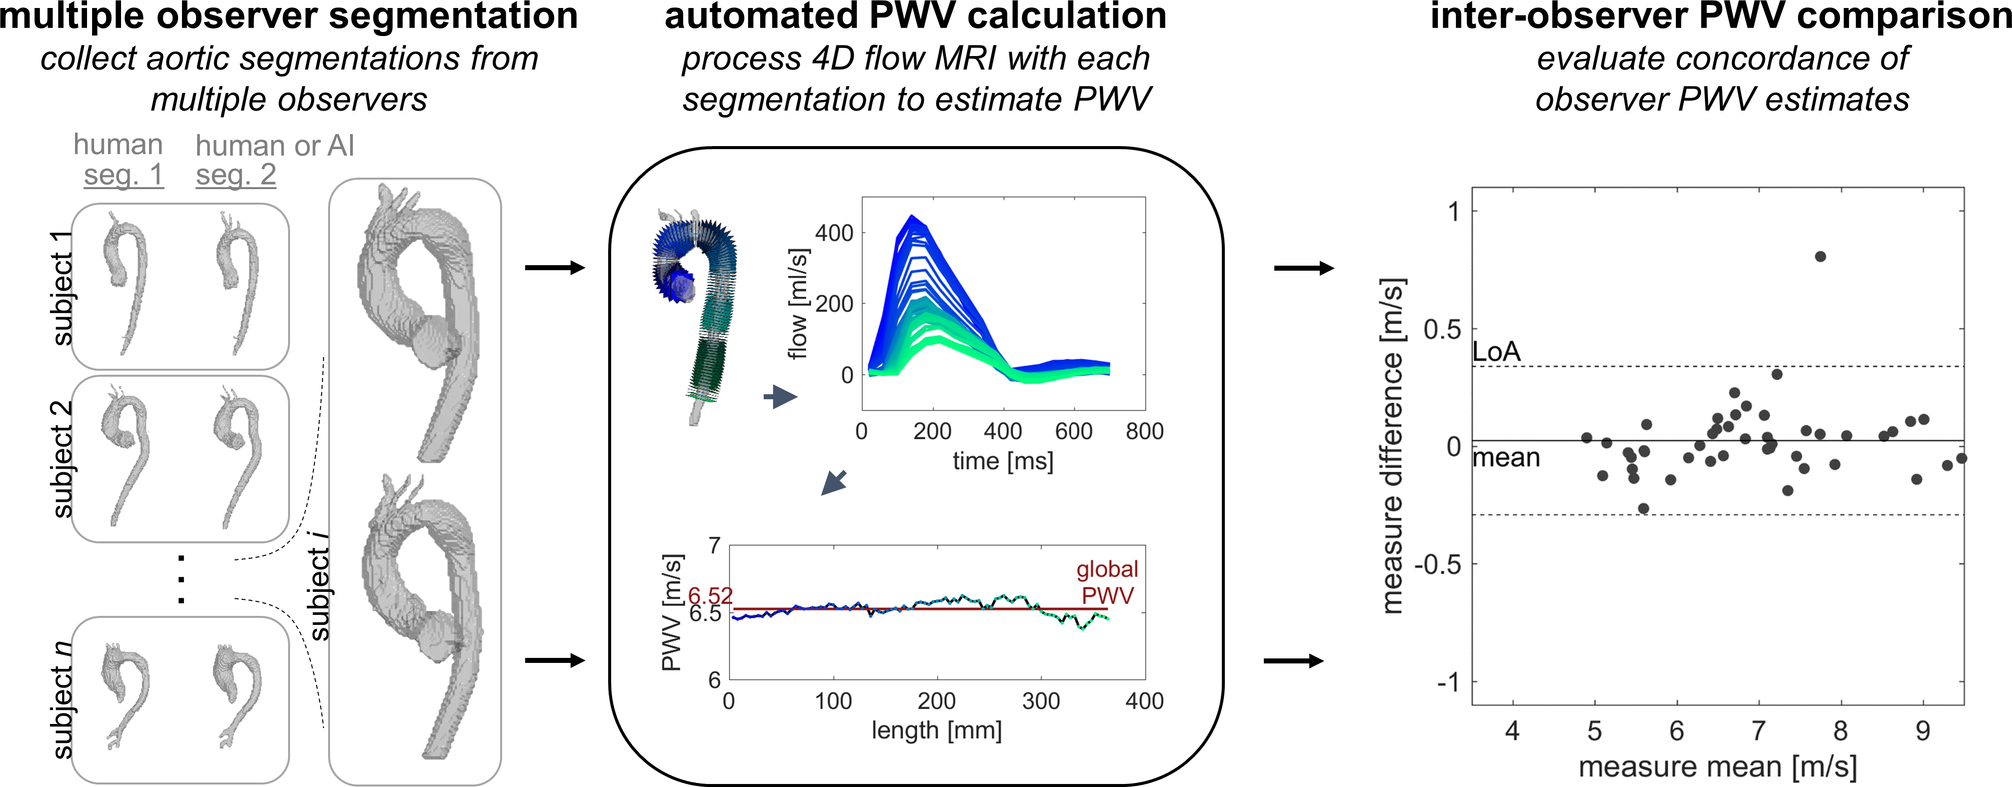
Figure 2. Inter-observer PWV comparison. Pairs of segmentations created by two different human observers or by one human observer and one AI network were input to the automated PWV calculation technique (fig.1), and the resultant PWV values were compared by Bland-Altman and intraclass correlation measures.
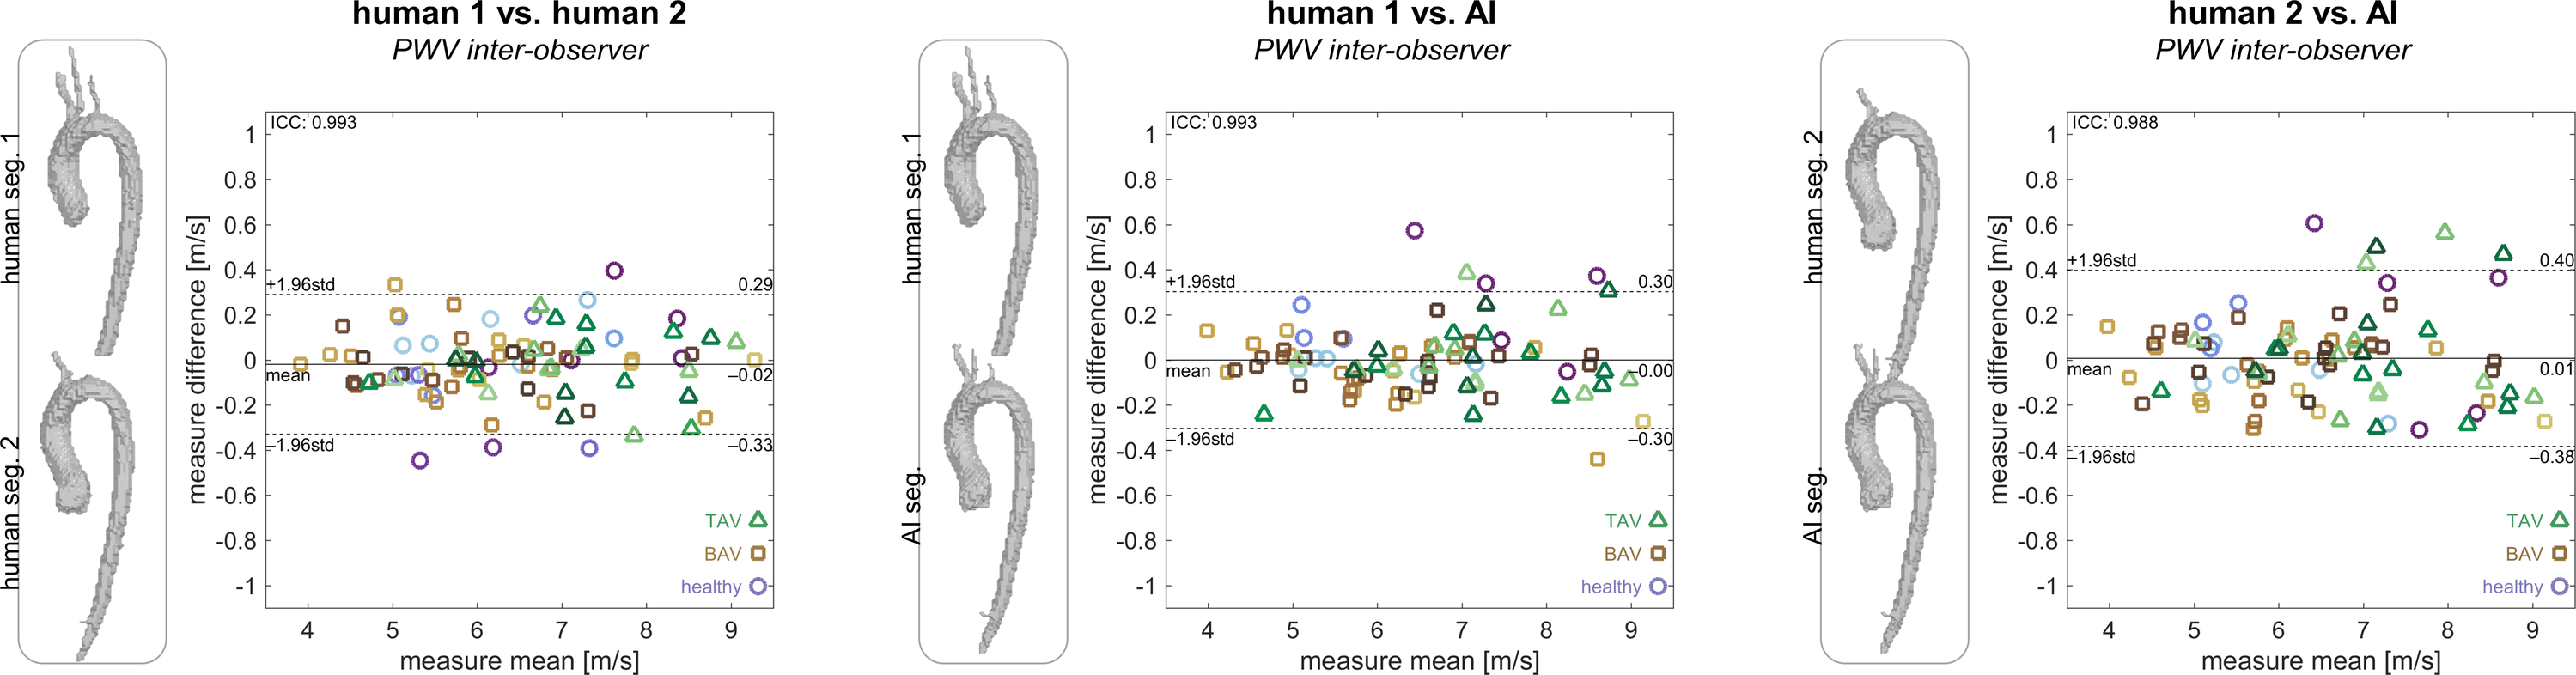
Figure 3. Human vs. human and human vs. AI for reliable PWV estimation. Inter-observer comparison for PWV values calculated from the different human observers' aortic segmentations show similar degrees of agreement to those of comparison between values from a human observer and an AI network used for aortic segmentation.
DOI: https://doi.org/10.58530/2022/0795