0794
Local and Global aortic pulse wave velocity in the murine aortic arch assessed by 4D flow magnetic resonance imaging1Department of MR Physics, University of Greifswald, Greifswald, Germany, 2Department of Experimental Physics V, University of Wuerzburg, Wuerzburg, Germany, 3Institute of Experimental Biomedicine, University Clinics Wuerzburg, Wuerzburg, Germany, 4Department of Diagnostic and Interventional Neuroradiology, University Clinics Wuerzburg, Wuerzburg, Germany, 5Department of Medical Clinic and Policlinic I, University Clinics Wuerzburg, Wuerzburg, Germany
Synopsis
As atherosclerosis is one of the main causes of death in industrial nations, noninvasive imaging modalities for studying its underlying mechanisms are in great demand. The quantification of hemodynamic parameters such as pulse wave velocity (PWV) assessed by flow sensitive magnetic resonance imaging (MRI) is a promising tool to observe plaque progression in preclinical models. Mostly, a global PWV value is assessed, however, previous studies already pointed to heterogeneous elasticity profiles in the presence of atherosclerotic plaques. Here, we present the measurement of local PWV values in the murine aortic arch assessed by 4D-flow MRI for spatially resolved elasticity measurements.
Background
Atherosclerosis is a complex disease of the cardiovascular vessels and one of the main causes of death in industrial nations. The development of noninvasive imaging techniques for an early detection of atherosclerosis and a better understanding of the underlying mechanisms of plaque development is of great interest. Here, hemodynamic parameters such as the aortic pulse wave velocity (PWV) have proven to be promising markers for clinical1 and preclinical2 magnetic resonance imaging (MRI). Up to now, most studies have been focusing on the assessment of a global PWV value, which only yields an average elasticity value of the examined vessel. Studies in atherosclerotic mouse models, however, already pointed to a heterogenous distribution of atherosclerotic plaques and therefore spatially varying elasticity values3. For that reason, the assessment of a local PWV value is needed. In this abstract, we are using retrospective cardiac and repiratory gated 4D flow MRI measurements, which were previously used to extract global PWV values and wall shear stress (WSS)4, to also assess local elasticity profiles in the murine aortic arch.Methods
MRIAll measurements were performed using 17.6T small animal MRI, a 1T/m gradient system and a 24mm birdcage coil. Wild type mice (n=10, age 12 weeks) were imaged in vivo. 4D flow was measured in 32 minutes using a self-navigated radial phase-contrast (PC) MRI sequence and balanced 4-point flow encoding, as described previously4,5. For the PWV analysis, CINE 4D flow images were reconstructed retrospectively in MATLAB (The Mathworks, USA) using an isotropic spatial resolution of 147µm and a frame rate of 200 frames/heart cycle. B0 inhomogeneity and rigid motion correction were applied prior to reconstruction5. For the lumen segmentation, cine images were reconstructed at 100µm spatial resolution and a frame rate of 20 frames/heart cycle.
Segmentation and data visualization
Lumen segmentation was assessed from the CINE 4D flow MRI dataset with high spatial resolution. A threshold-based semi-automated segmentation was used5. Subsequently, the segmentation data was interpolated to the spatiotemporal resolution of the PWV CINE 4D flow MR images4. Velocity was calculated from the phase images of the CINE 4D flow images. Using the segmentation data, the blood flow was determined and smoothed using spatial median filter. Afterwards the segmentation and velocity data were exported to Ensight (Ansys, Inc., USA) for further analysis.
Global PWV
Global PWV was calculated as previously described4. Through-plane flow was assessed within Ensight in approx. 50 analysis planes evenly distributed along the aorta. For each analysis plane, the position Δx relative to the proximal ascending aorta and the time point Δt of the early systolic upstroke of the flow pulse was determined. PWV was assessed from the slope of a line fitted to the plot Δt vs Δx (Fig. 1A).
Local PWV
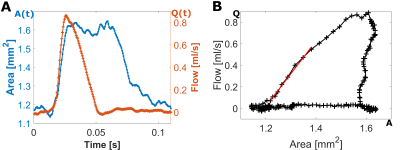
Local PWV was assessed in four analysis planes using the method introduced by Vulliémoz et al6-8. For each analysis plane, the temporal changes of the cross-sectional area, A(t) and the volume flow Q(t) were determined (Fig. 1B and Fig. 2A). The slope of a linear fit of the early systolic time points in the Q-A plot (red line in Fig. 2B) yields the local PWV value.
Results
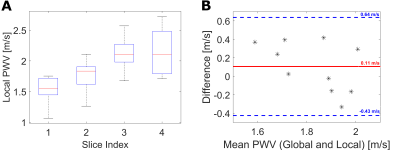
Fig. 3A shows box plots of the local PWV values, obtained from the four analysis planes. A slight increase with increasing slice index is noticeable. The results are in good agreement with previous studies of local PWV in the proximal ascending aorta2. For comparison of local PWV with global PWV, the local PWV values were averaged over the four analysis planes. Fig. 3B displays a Bland-Altman plot of the mean local PWV value versus the global PWV values, indicating slightly larger values (bias 0.11m/s) when using the local PWV measurement.Discussion and Conclusion
The assessment of hemodynamic parameters is a promising tool to assess functional information about the cardiovascular system. In particular the use of a retrospectively navigated 4D flow sequence has great potential, since different flow markers such as WSS and global PWV can be derived from a single measurement. In this abstract, we extend the 4D flow analysis in order to also assess local PWV values in the aortic arch. In order to avoid reflections of the flow pulse induced by changes of the impedance (e.g., caused by the bifurcations), only slices in the proximal ascending aorta with low curvature were analyzed. In slice 4, however, a comparably large variance (relative to the other slices) of the local PWV values was observed (Fig. 3A), which possibly indicates an already not negligible influence of reflections in this area. Therefore, thorough investigations, e.g., using computational fluid dynamics should be applied to investigate all sources of deviations (e.g., caused by impedance changes and curvature) of the determination of local PWV values in the arch in more detail. However, the assessment of both global and spatially resolved elasticity is a tool with great potential, which can be applied to study the effect of atherosclerotic lesions in greater detail.Acknowledgements
This work was funded by the Deutsche Forschungsgemeinschaft (ZE827/15-1, BA 1069/14-1, HA 7152/8-1, HE 7108/3-1, SFB1158/A10), the Bundesministerium für Bildung und Forschung (BMBF01, E01004), the Comprehensive Heart Failure Center (Deutsches Zentrum für Herzinsuffizienz) and the National Institutes of Health (NIH 1R01HL149787, NIH 1R21NS122511)References
1. Rivera-Rivera et al, JCBFM 41(2): 298-311, 2020
2. Gotschy et al, Circ Cardiovasc Imag 6(6): 916-923, 2013
3. Herold et al, JCMR 19(77), 2017
4. Winter and Andelovic et al, JCMR 23(34), 2021
5. Winter and Andelovic et al, JCMR 21(64) , 2019
6. Vulliémoz et al, MRM 47(4): 649-654, 2002
7. Herold et al, MRM 61(6): 1293-1299, 2009
8. Winter et al, JCMR 15(88), 2013
Figures


