0792
Deep-Learning based Wall Shear Stress Assessments from 3D Aortic Shape1Radiology, Johns Hopkins University, Baltimore, MD, United States, 2Sorbonne Université, Paris, France, 3Johns Hopkins University, Baltimore, MD, United States, 4Université de Paris, Hôpital Européen Georges Pompidou, Paris, France
Synopsis
We develop deep learning for full aortic wall shear stress assessment using 3D aortic shapes and ascending aortic waveforms as input flow. Technically, this would reduce the acquisition time to less than a minute and the post-processing time to a few seconds.
Introduction
Elevated arterial stiffness, a hallmark of aging, is associated with adverse clinical outcomes, including cardiovascular disease (CVD).(1–3) Aortic shape, analyzed before in specific aortopathies,(4–6) is seen to be a key influencer of flow patterns through the aorta.(7,8) 4D flow MRI allows for full spatial-temporal coverage of the aorta and the estimation of flow and wall shear stress (WSS).(9–11) However, current methods of 4D flow acquisition require long scan times (5-20 min). In addition, the complexity of 4D flow post-processing requirements have resulted in limited use, in spite of recent advances to improve post-processing time.(12–14)Recently, the idea of using deep-learning (DL) methods to perform flow-related computations to mimic computational fluid dynamics has emerged.(15,16) Here, we apply DL based on 4D flow MRI for WSS assessment using 3D aortic shapes and ascending aortic flow waveforms as input.Methods
Population: 4D flow MRI data were acquired in 59 subjects including 12 patients with ascending thoracic aortic aneurysms (67±14 years, 7 males) and 47 healthy volunteers free from and without history of overt CVD (50±18 years, 23 males). The study protocol was approved by Institutional Review Board and all subjects gave written informed consent.(10,17)Data Acquisition: MRI was performed on a 3T GE system (Mr750w GEM, Milwaukee, WI) with a 32-channel cardiac phased-array coil. 4D flow data were acquired during free-breathing with ECG gating in a sagittal oblique volume encompassing the thoracic aorta, using the following scan parameters: echo time=1.7 ms, repetition time TR=4.3-4.4 ms, flip angle=15°, spatial resolution=1×1.48×2.38 mm3, and velocity encoding=250 cm/s in all directions. Data were reconstructed into 50 temporal phases.
WSS Estimation from 4D flow Images: Phase offset and phase wrapping were corrected. A time-averaged phase-contrast MR angiography (PC-MRA) was derived from the 3 directional velocities weighted by modulus images, when considering 5 time phases around the systolic peak, defined as the temporal phase with maximal velocity in the ascending aorta. Such PC-MRA was used to segment the thoracic aortic volume with an explicit active contours algorithm and isolate aortic velocity fields. Algorithms and user interface were written in Matlab. WSS vectors τ were evaluated on the aortic wall segmentation voxels as described before.(17,18) Finally, WSS at peak systole was calculated at the points of a parametric mesh with 4096 points (128 longitudinal and 32 cross-sectional across the length of the aorta) for each subject.
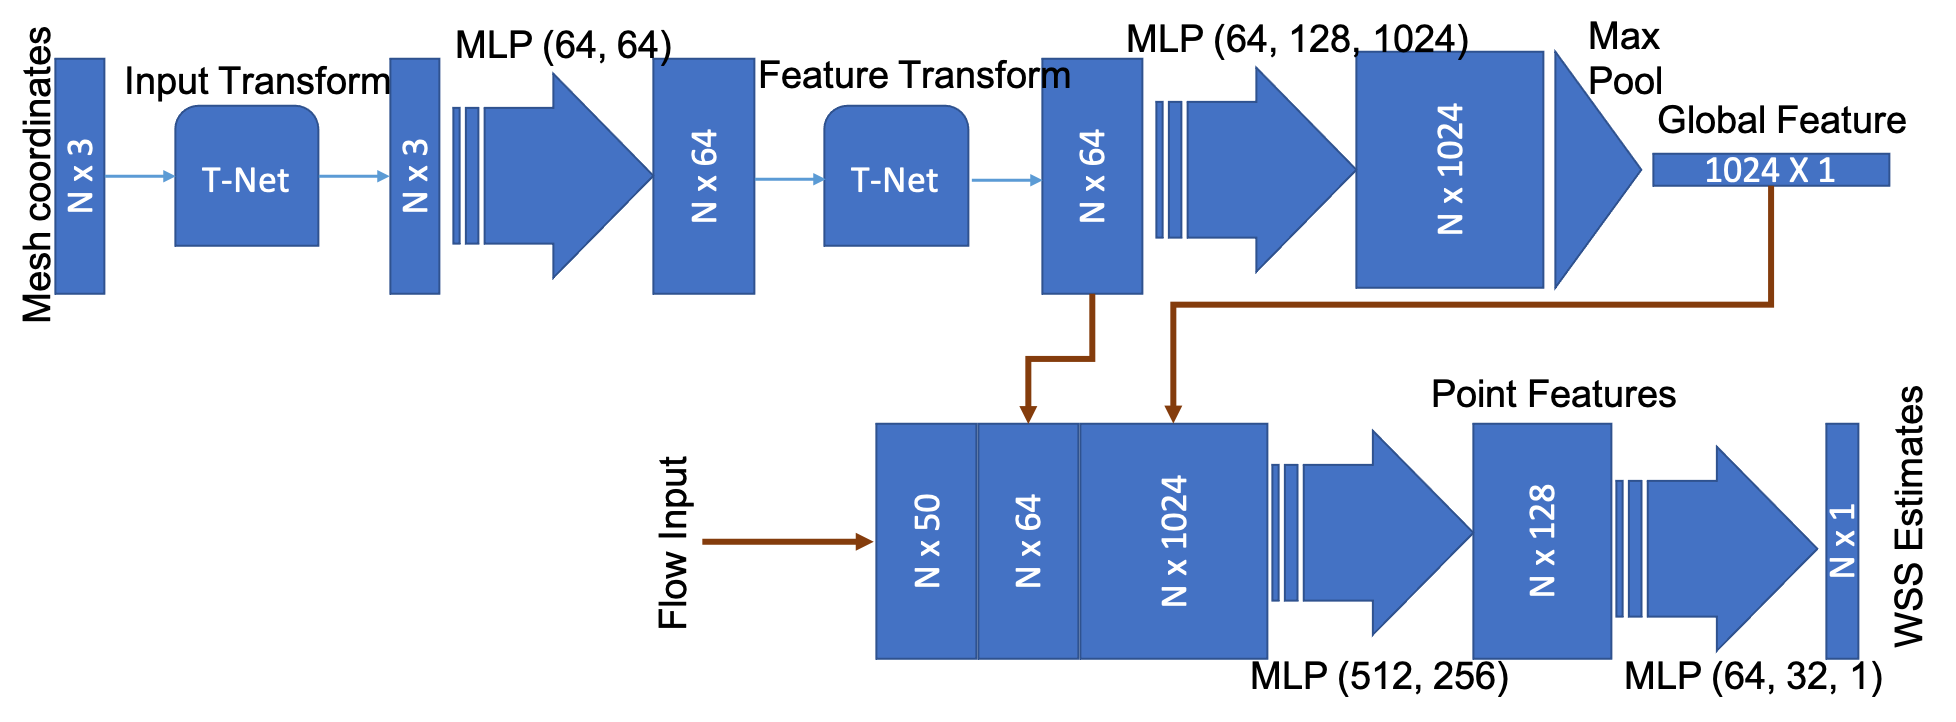
Deep-Learning Based Analysis: A leave-one-out scheme was used where each subject was used as the test data with the remaining as the training data (considering the small sample size used here). We used a modified PointNet architecture(19,20) with an additional input with ascending aortic flow. The inputs to the network were the mesh geometry (x, y and z coordinates of the parametric aortic mesh, 4096 points) and the aortic flow waveform at the ascending aorta. The network was trained to compute the WSS estimates [in Pa] at each of the 4096 mesh points of the aorta, using only the above-mentioned inputs. The detailed network diagram is shown in Figure 1. Adam optimizer was used, the maximum number of epochs was 5000. Mean absolute error was used as the loss function to be minimized.
Results
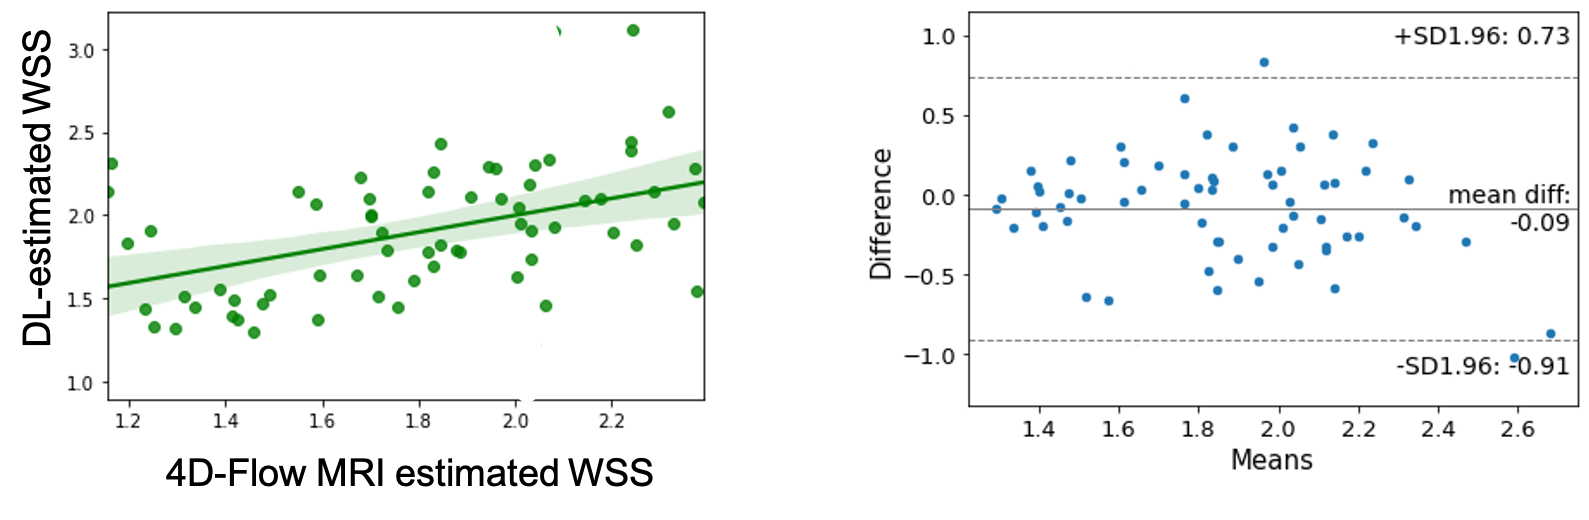
The preliminary results show that the DL-estimated wall shear stress and the 4D flow-based wall shear stress calculated at systole (time of peak wall shear stress) was moderate (Pearson’s r=0.67, p<0.01, Figure 2). Figure 3 shows visual comparison of point-wise wall shear stress estimates in a participant with dilated ascending aorta. The mean difference in the log-transformed WSS estimates was -0.09±0.82.Discusiion
4D flow MRI has greatly expanded our capability to study pathologic aortic remodeling through concomitant flow and geometrical changes. However, currently 4D flow acquisitions are time-consuming as are the associated post-processing and data storage requirements. Our method of calculating WSS potentially reduces the acquisition time to less than a minute and the post-processing time to a few seconds. While, here we have used shape derived from PCMRA, one could potentially obtain aortic shape using 3D gradient echo or balanced steady state free precession sequences in a few seconds. The PointNet architecture has unique advantages – (1) no need for conversion of aortic shape features present as a point cloud to a 3D volume, (2) convolutions are performed with the actual shape as the basis, and (3) the input point-cloud can unordered and unequally spaced points.(19,20) Future endeavors could include the computation of 4D flow patterns and other vessel properties based on the vessel shape, using 4D flow data as training. This technique could also potentially be applied to shape meshes obtained from other imaging modalities such as computed tomography.Conclusion
We developed a DL-based technique to compute aortic WSS estimates fairly accurately using just the shape of the aorta and the flow waveform from the ascending aorta. This technique overcomes the need for time-consuming 4D flow assessment and post-processing.Acknowledgements
No acknowledgement found.References
1. Redheuil A, Wu CO, Kachenoura N, et al. Proximal Aortic Distensibility Is an Independent Predictor of All-Cause Mortality and Incident CV Events The MESA Study. J Am Coll Cardiol 2014;64:2619–2629 doi: 10.1016/j.jacc.2014.09.060.
2. Ohyama Y, Ambale-Venkatesh B, Noda C, et al. Aortic Arch Pulse Wave Velocity Assessed by Magnetic Resonance Imaging as a Predictor of Incident Cardiovascular Events. Hypertension 2017;70:524–530 doi: 10.1161/hypertensionaha.116.08749.
3. Sutton-Tyrrell K, Najjar SS, Boudreau RM, et al. Elevated Aortic Pulse Wave Velocity, a Marker of Arterial Stiffness, Predicts Cardiovascular Events in Well-Functioning Older Adults. Circulation 2005;111:3384–3390 doi: 10.1161/circulationaha.104.483628.
4. Bruse JL, McLeod K, Biglino G, et al. A statistical shape modelling framework to extract 3D shape biomarkers from medical imaging data: assessing arch morphology of repaired coarctation of the aorta. Bmc Med Imaging 2016;16:40 doi: 10.1186/s12880-016-0142-z.
5. Bruse JL, Zuluaga MA, Khushnood A, et al. Detecting Clinically Meaningful Shape Clusters in Medical Image Data: Metrics Analysis for Hierarchical Clustering Applied to Healthy and Pathological Aortic Arches. Ieee T Bio-med Eng 2017;64:2373–2383 doi: 10.1109/tbme.2017.2655364.
6. Schnell S, Smith DA, Barker AJ, et al. Altered aortic shape in bicuspid aortic valve relatives influences blood flow patterns. European Hear J Cardiovasc Imaging 2016;17:1239–1247 doi: 10.1093/ehjci/jew149.
7. Bensalah MZ, Bollache E, Kachenoura N, et al. Geometry is a major determinant of flow reversal in proximal aorta. Am J Physiol-heart C 2014;306:H1408–H1416 doi: 10.1152/ajpheart.00647.2013.
8. Westerhof BE, Westerhof N. Magnitude and return time of the reflected wave. J Hypertens 2012;30:932–939 doi: 10.1097/hjh.0b013e3283524932.
9. Jarvis K, Soulat G, Scott M, et al. Investigation of Aortic Wall Thickness, Stiffness and Flow Reversal in Patients With Cryptogenic Stroke: A 4D Flow MRI Study. J Magn Reson Imaging 2020 doi: 10.1002/jmri.27345.
10. Bouaou K, Bargiotas I, Dietenbeck T, et al. Analysis of aortic pressure fields from 4D flow MRI in healthy volunteers: Associations with age and left ventricular remodeling. J Magn Reson Imaging 2019;50:982–993 doi: 10.1002/jmri.26673.
11. Houriez--Gombaud-Saintonge S, Mousseaux E, Bargiotas I, et al. Comparison of different methods for the estimation of aortic pulse wave velocity from 4D flow cardiovascular magnetic resonance. J Cardiov Magn Reson 2019;21:75 doi: 10.1186/s12968-019-0584-x.
12. Ferdian E, Suinesiaputra A, Dubowitz DJ, et al. 4DFlowNet: Super-Resolution 4D Flow MRI Using Deep Learning and Computational Fluid Dynamics. Aip Conf Proc 2020;8:138 doi: 10.3389/fphy.2020.00138.
13. Vishnevskiy V, Walheim J, Kozerke S. Deep variational network for rapid 4D flow MRI reconstruction. Nat Mach Intell 2020;2:228–235 doi: 10.1038/s42256-020-0165-6.
14. Berhane H, Scott M, Elbaz M, et al. Fully automated 3D aortic segmentation of 4D flow MRI for hemodynamic analysis using deep learning. Magnet Reson Med 2020;84:2204–2218 doi: 10.1002/mrm.28257.
15. Tesche C, Cecco CND, Baumann S, et al. Coronary CT Angiography–derived Fractional Flow Reserve: Machine Learning Algorithm versus Computational Fluid Dynamics Modeling. Radiology 2018;288:64–72 doi: 10.1148/radiol.2018171291.
16. Liang L, Mao W, Sun W. A feasibility study of deep learning for predicting hemodynamics of human thoracic aorta. J Biomech 2020;99:109544 doi: 10.1016/j.jbiomech.2019.109544.
17. Bouaou K, Dietenbeck T, Soulat G, et al. Pressure and Flow Interplay in Aortic Dilation Using 4D Flow Magnetic Resonance Imaging. 2019 Comput Cardiol Cinc 2019;00:Page 1-Page 4 doi: 10.23919/cinc49843.2019.9005917.
18. Potters WV, Ooij P, Marquering H, vanBavel E, Nederveen AJ. Volumetric arterial wall shear stress calculation based on cine phase contrast MRI. J Magn Reson Imaging 2015;41:505–516 doi: 10.1002/jmri.24560.
19. Qi CR, Su H, Mo K, Guibas LJ. PointNet: Deep Learning on Point Sets for 3D Classification and Segmentation. Arxiv 2016.
20. Qi CR, Yi L, Su H, Guibas LJ. PointNet++: Deep Hierarchical Feature Learning on Point Sets in a Metric Space. Arxiv 2017.
Figures