0788
MTsat is more sensitive to cerebellar myelin abnormality in multiple sclerosis compared to MTR1Medicine (Neurology), University of Toronto, Toronto, ON, Canada, 2Medicine, Keenan Research Centre for Biomedical Research, Toronto, ON, Canada, 3Radiology, University of British Columbia, Vancouver, BC, Canada, 4Copenhagen University Hospital, Copenhagen, Denmark, 5Medicine (Neurology), University of British Columbia, Vancouver, BC, Canada, 6Biomedical Engineering, University of British Columbia, Vancouver, BC, Canada, 7Physics and Astronomy, University of British Columbia, Vancouver, BC, Canada, 8Medicine (Neurosurgery), University of Toronto, Toronto, ON, Canada
Synopsis
Magnetization transfer saturation (MTsat) is suggested to be superior to conventional MT ratio (MTR) in quantifying myelin as it reduces bias from T1 effect and B1 inhomogeneity and is more sensitive to tissue damage. This study aimed to compare the ability of MTsat and MTR to detect cerebellar myelin differences across multiple sclerosis (MS) subtypes and to evaluate whether MTsat or MTR demonstrates stronger correlations with clinical disability. We found that MTsat demonstrated greater group differences and more strongly correlated with clinical disability in cerebellum than MTR suggesting that MTsat may be more sensitive to cerebellar myelin abnormalities than MTR.
Introduction
Damage to the cerebellum in multiple sclerosis (MS) can contribute to a more aggressive disease course with greater motor, cognitive, and emotional disability.1,2 Quantitative magnetization transfer saturation (MTsat) can provide insight into myelin pathology and is suggested to be superior in quantifying myelin in brain tissue as it is less sensitive to T1 dependent effects and B1 inhomogeneity compared to MTR.3-5 We aimed to (1) compare the ability of MTsat and MTR to detect differences in myelin content in the cerebellum and cerebellar peduncles between people with radiologically isolated syndrome (RIS), relapsing-remitting MS (RRMS), primary progressive MS (PPMS), and healthy control (CON), and to (2) evaluate correlations between MTsat or MTR in the cerebellum and cerebellar peduncles and clinical disability as measured by Expanded Disability Status Scale (EDSS) in people with MS.6Methods
MT imaging data using a 3D gradient echo sequence with and without MT saturation pulses (TR = 25 ms, TE = 2.66 ms, flip angle = 5 degrees, sagittal, 1.5 mm x 1.5 mm x 1.5 mm, off-resonance Gaussian-shaped RF pulse, frequency offset from water resonance 1.2 kHz, GRAPPA acceleration factor 2) were acquired on 3T Siemens scanners from participants in the Canadian Prospective Cohort Study to Understand Progression in MS (CanProCo): 20 RIS (mean age 42y (range 20-59y), disease duration 3y (0-8y), median EDSS 0.5 (0.0-3.0)), 82 RRMS (mean age 38y (19-59y), disease duration 1y (0-18y), median EDSS 1.5 (0.0-6.0)), 17 PPMS (mean age 49y (26-61y), disease duration 3y (0-8y), median EDSS 4.0 (1.5-6.5)) and 16 CON (mean age 33y (19-51y)). 3D T1-weighted image (TR = 11ms, TE = 2.66ms, flip angle = 15 degrees, sagittal, 1.5 mm x 1.5 mm x 1.5 mm) was acquired to account for T1 effect when calculating MTsat. MTsat (sct_compute_mtsat) and MTR (sct_compute_mtr) were calculated using Spinal Cord Toolbox. 3,7 Registration and segmentation were performed using FMRIB Software Library (FSL) tools.8 Levene’s test was used to check for equality of variances across groups. Then, a one-way analysis of variance (ANOVA) with Tukey post hoc test for multiple comparisons was performed to compare MTsat or MTR in the regions of interest (ROI), including whole cerebellum, Crus I/II, and superior/middle/inferior cerebellar peduncles (S/M/ICP), between groups. Spearman’s rho was used to evaluate correlations between MTsat or MTR and EDSS scores.Results
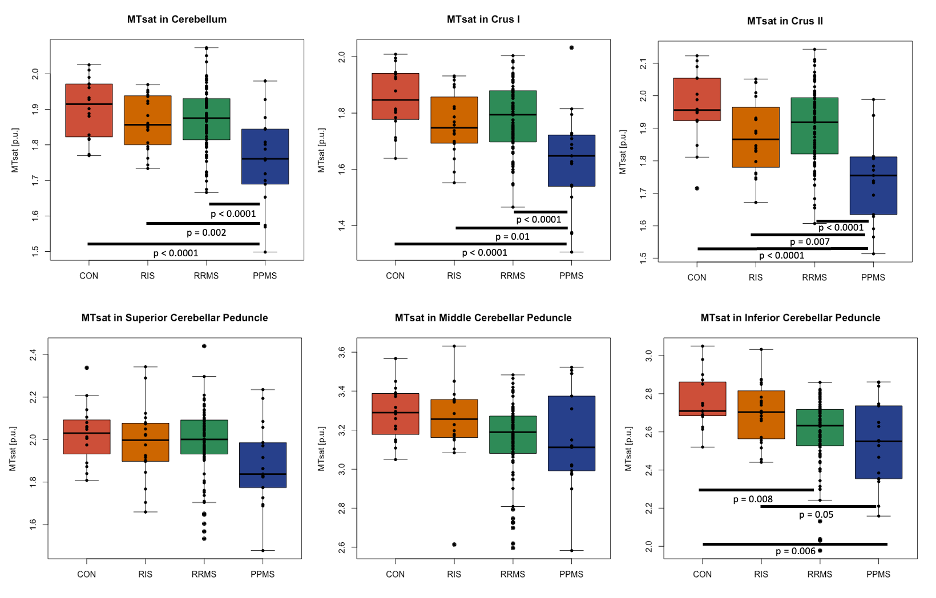
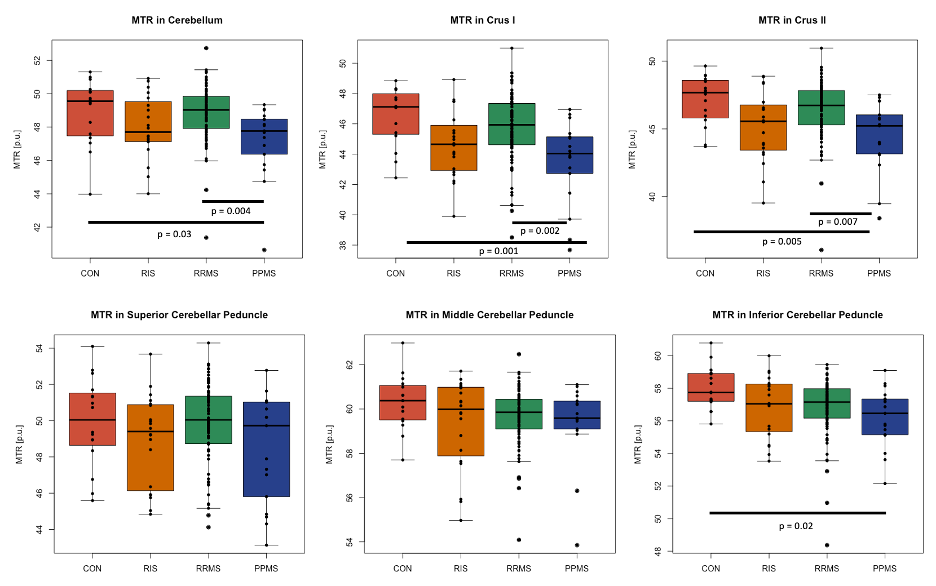
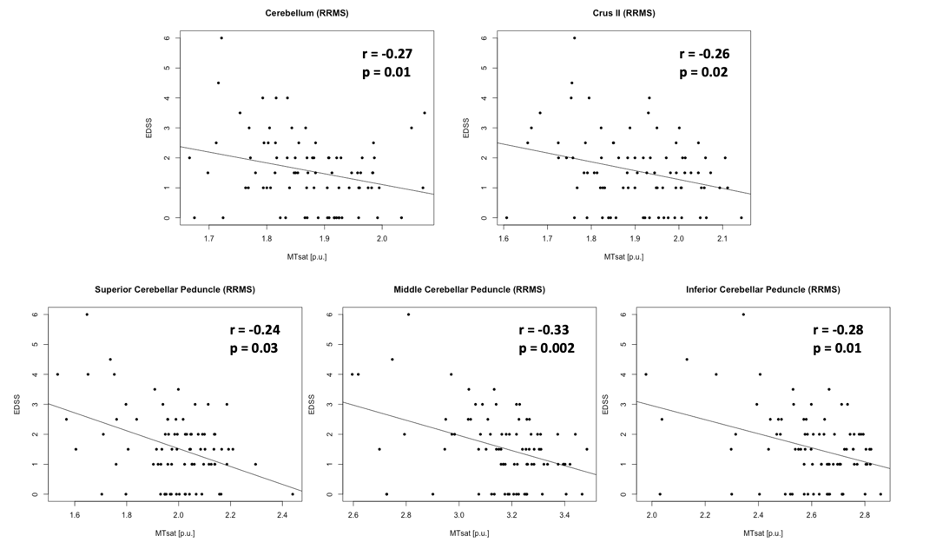
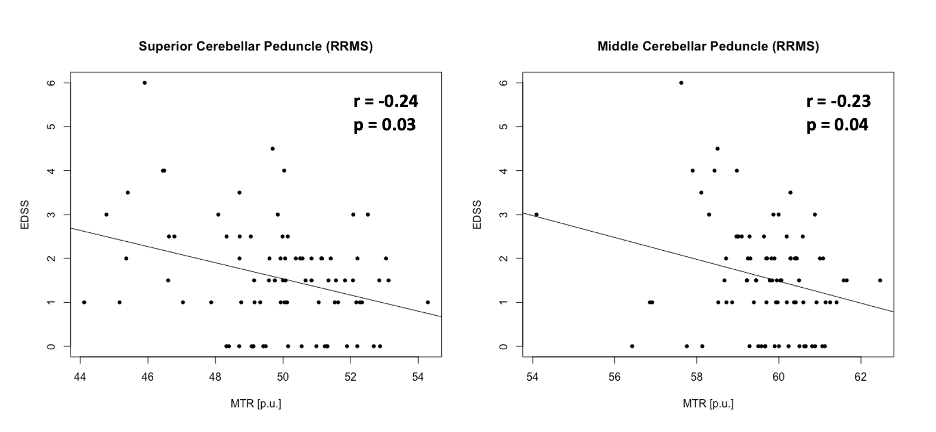
Levene’s test confirmed equality of variances across groups in all ROI (p>0.05). Mean MTsat consistently showed group differences between PPMS and CON (4 out of 6 ROI, p≤0.006), RIS (4 out of 6 ROI, p≤0.04), or RRMS (3 out of 6 ROI, p≤0.0001) (Fig. 1). Mean MTR showed significant differences only between PPMS and CON (4 out of 6 ROI, p≤0.03) or RRMS (3 out of 6 ROI, p≤0.007) (Fig. 2). The percentage difference of the means between the groups were greater using MTsat (-5.85% to -12.05%, p≤0.04) compared to MTR (-3.12% to -6.54%, p≤0.03) in cerebellum, Crus I, Crus II, and ICP (Fig. 1, 2). Mean MTsat demonstrated stronger correlations with EDSS in more ROI (5 out of 6 ROI, r=-0.24 to -0.33, p≤0.03) than mean MTR (2 out of 6 ROI, r=-0.23 to -0.24, p≤0.04) in RRMS (Fig. 3, 4). There was no correlation between MTsat or MTR and EDSS in RIS or PPMS.Discussion
Mean MTsat was able to detect group differences more frequently than mean MTR. Mean MTsat demonstrated a greater percentage difference of the means between the groups in the cerebellum and cerebellar peduncles compared to mean MTR. The inverse relationship between MTsat (myelin content) and EDSS (disability) was more evident than MTR and EDSS in RRMS. Together, these findings suggest that MTsat may have higher sensitivity and specificity to cerebellar myelin across distinct MS subtypes. These findings provide insight into early MS disease process relevant to clinical disability, including in RIS. A prospective follow-up will be important to understand how cerebellar pathology contributes to the evolution of clinical disability in MS. Cerebellar tracts have widespread connections throughout the brain, and are involved in various neurological functions, including cognition and motor coordination. MTsat has some advantages over other imaging techniques. The field-of-view of myelin water fraction mapping using the traditional gradient and spin echo sequence only covers the cerebrum and not the infratentorial region.9 Quantitative magnetization transfer (qMT) estimates myelin independently of T1; however, it requires a long acquisition time and complex postprocessing.10 Our findings support that MTsat may be a reasonable alternative to these two techniques to investigate myelin pathology in the cerebellum in people with MS.Conclusion
Lower myelin content in the cerebellum and cerebellar peduncles may contribute to disability in MS. MTsat may be more sensitive and specific to cerebellar myelin abnormalities in MS than MTR. These findings, and prospective follow-up of this cohort using MTsat in the cerebellum may allow us to gain deeper insight into early MS disease processes relevant to clinical disability onset and progression in MS.Acknowledgements
The authors sincerely thank all study participants and collaborators of CanProCo study. This study was supported by MS Society of Canada, Brain Canada, Biogen-Idec, Roche, and Government of Alberta.References
1. Tornes L, Conway B, Sheremata W. Multiple sclerosis and the cerebellum. Neurol Clin. 2014; 32: 957-977.
2. Weier K, Banwell B, Cerasa A, et al. The role of the cerebellum in multiple sclerosis. Cerebellum. 2015; 14: 364-374.
3. Helms G, Dathe H, Kallenberg K, et al. High-resolution maps of magnetization transfer with inherent correction for RF inhomogeneity and T1 relaxation obtained from 3D FLASH MRI. Magn Reson Med. 2008; 60: 1396-1407.
4. Helms G, Dathe H, and Dechent P. Modeling the influence of TR and excitation flip angle on the magnetization transfer ratio (MTR) in human brain obtained from 3D spoiled gradient echo MRI. Magn Reson Med. 2010; 64: 177-185.
5. Lema A, Bishop C, Malik O, et al. A comparison of magnetization transfer methods to assess brain and cervical cord microstructure in multiple sclerosis. J Neuroimaging. 2017; 27: 221-226.
6. Kurtzke JF. Rating neurologic impairment in multiple sclerosis: an expanded disability status scale (EDSS). Neurology. 1983; 1444-1452.
7. De Leener B, Levy S, Dupont SM, et al. SCT: spinal cord toolbox, an open-source software for processing spinal cord MRI data. Neuroimage. 2017; 145: 24-43.
8. Jenkinson M, Beckmann CF, Behrens TE, et al. FSL. Neuroimage. 2012; 67: 782-790.
9. Prasloski T, Rauscher A, MacKay AL, et al. Rapid whole cerebrum myelin water imaging using a 3D GRASE sequence. Neuroimage. 2012; 63: 533-539.
10. Schmierer K, Tozer DJ, Scaravilli F, et al. Quantitative magnetization transfer imaging in postmortem multiple sclerosis brain. J Magn Reson Imaging. 2007; 26: 41-51.
Figures