0787
Magnetisation transfer saturation and MTR in multiple sclerosis: sensitivity to longitudinal change and clinical disability1Centre for Clinical Brain Sciences, University of Edinburgh, Edinburgh, United Kingdom, 2Anne Rowling Regenerative Neurology Clinic, University of Edinburgh, Edinburgh, United Kingdom
Synopsis
Myelin-sensitive magnetisation transfer saturation (MTsat) corrects magnetisation transfer ratio (MTR) signal variance, accounting for T1 recovery and B1 inhomogeneities, but its validity as a longitudinal imaging marker in multiple sclerosis (MS) is not yet clear. Here, we examine longitudinal change in cerebral MTsat and MTR in a cohort of people with newly diagnosed MS (n=62). MTsat, but not MTR, decreased in normal-appearing white matter over one year and was associated with clinical disability progression. In white matter lesions, both MTsat and MTR increased longitudinally. We conclude that MTsat is more sensitive to subtle myelin damage over time than MTR.
Introduction
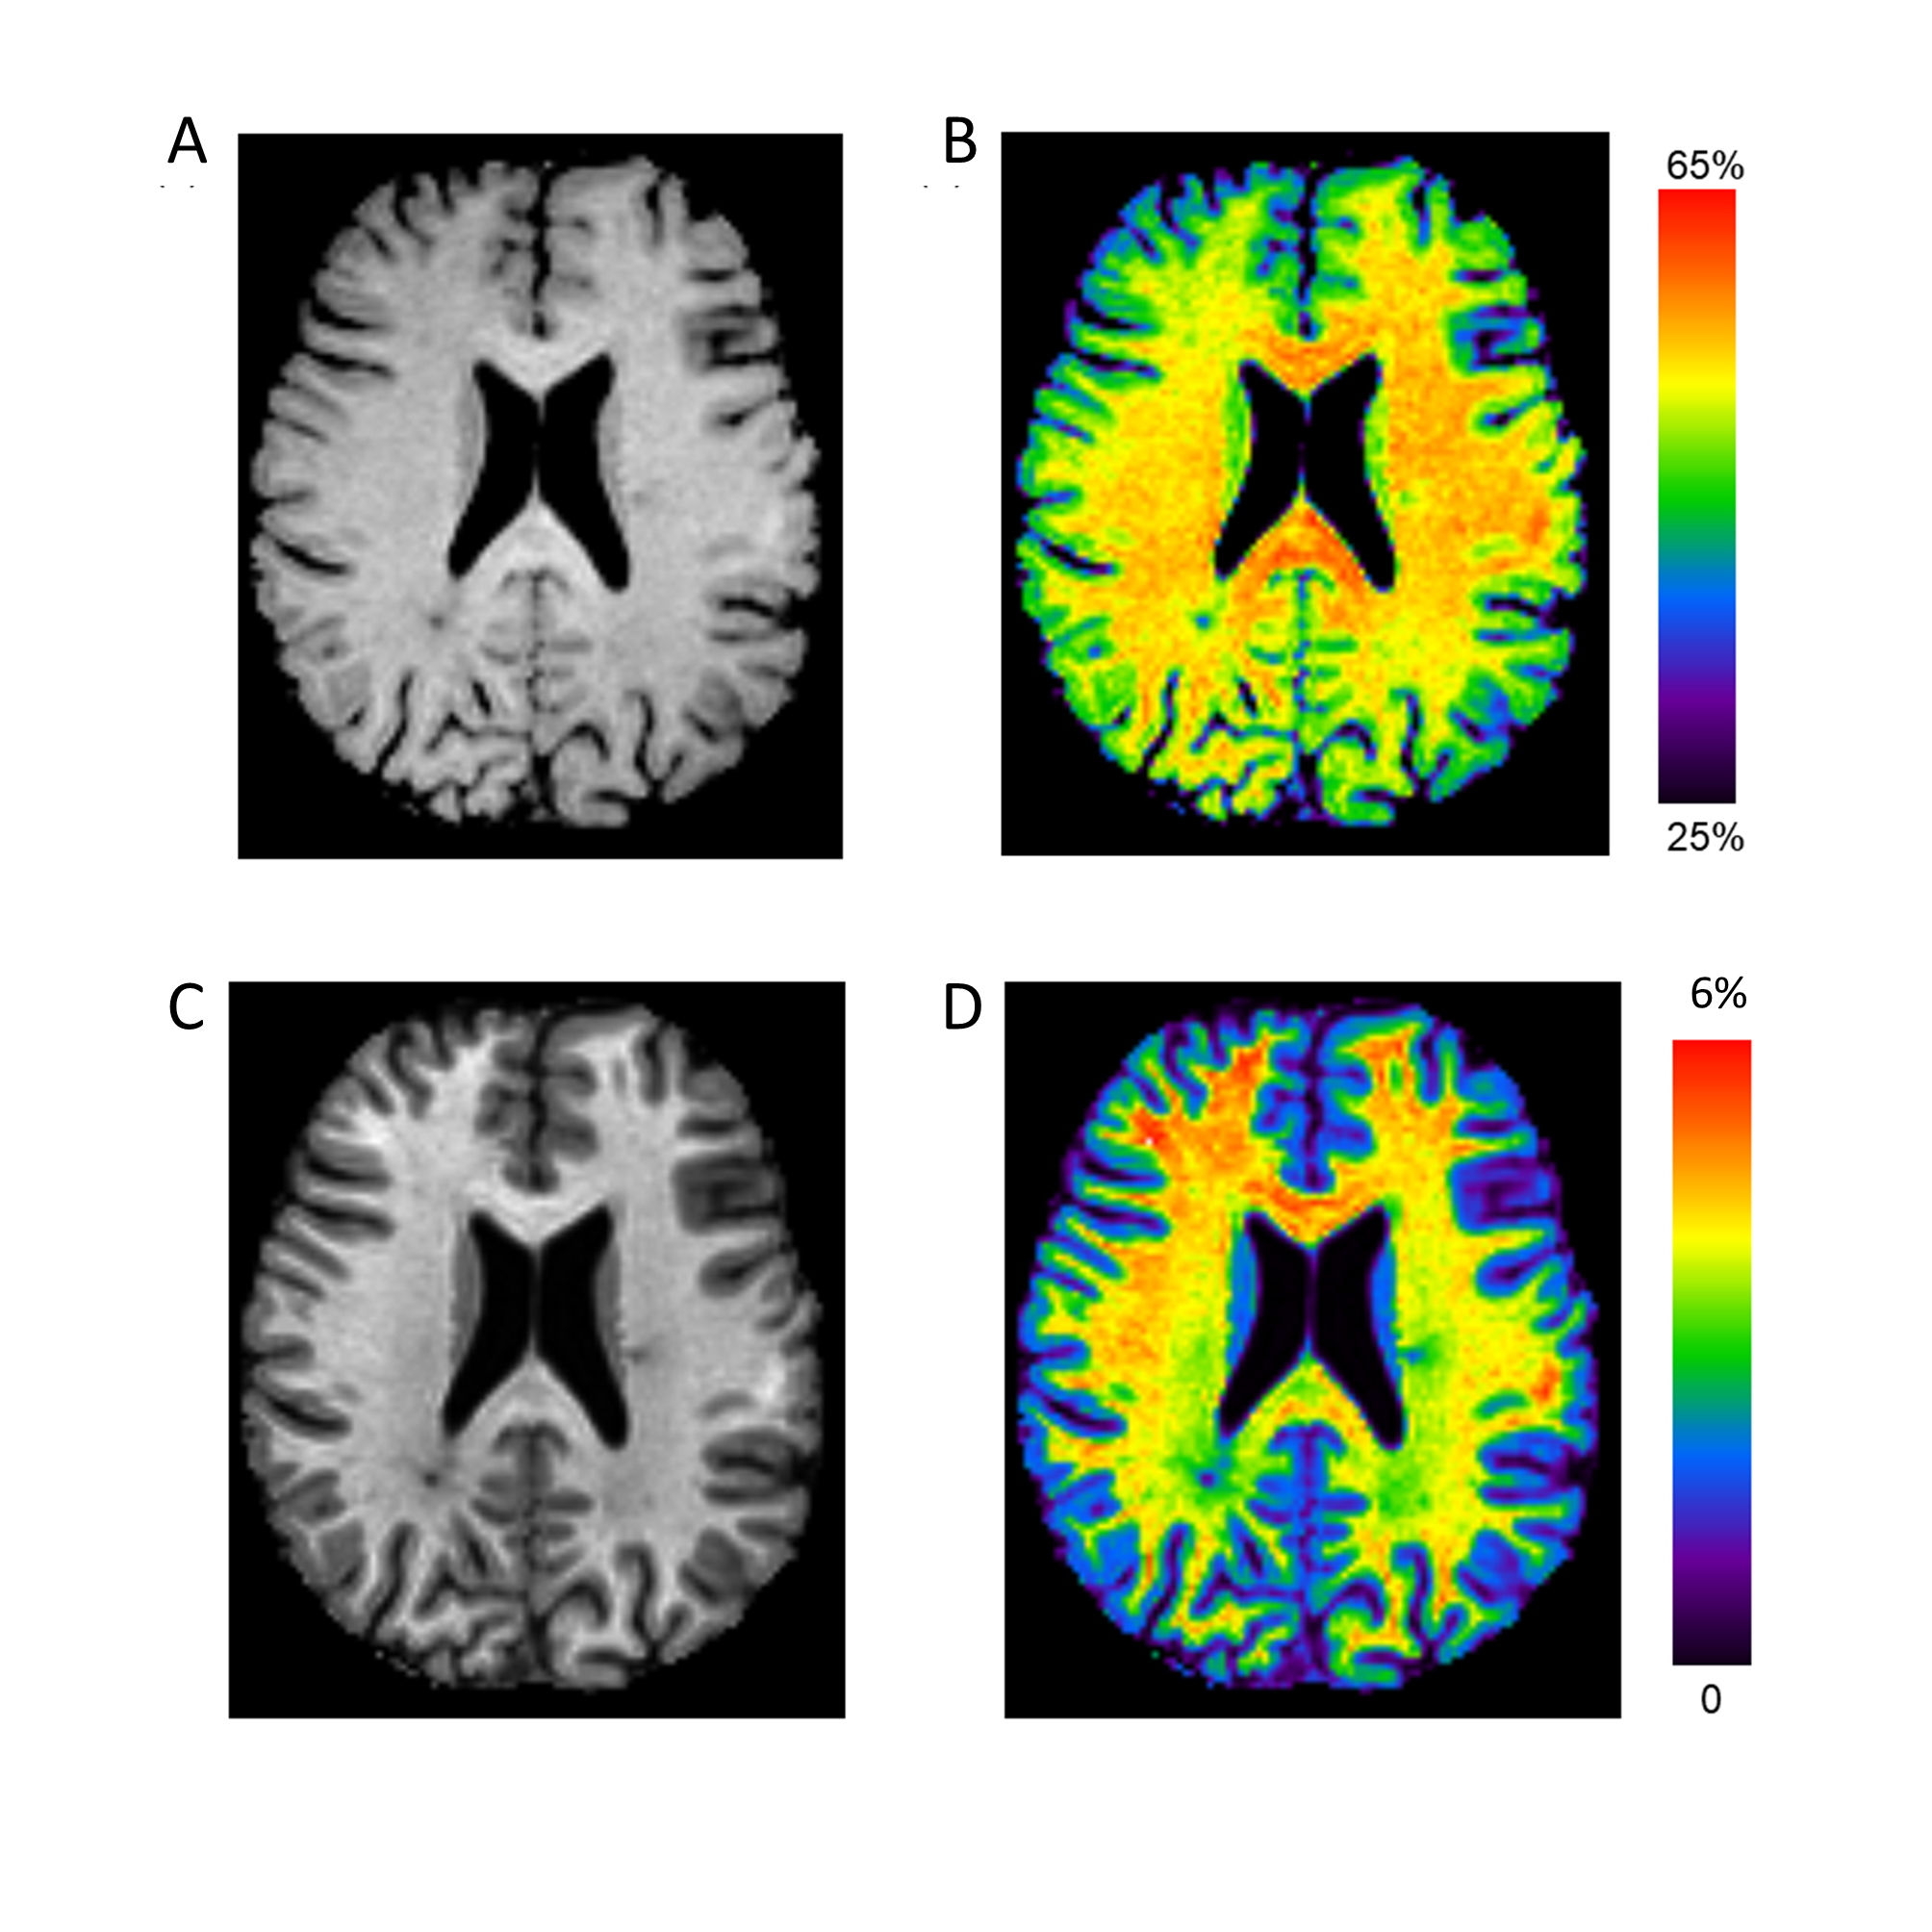
Magnetisation transfer (MT) imaging is sensitive to myelin-bound macromolecules with short T2 (~10μs), not typically seen on conventional MRI. As such, the derived magnetisation transfer ratio (MTR, Figure 1A-B) has been applied in the study of white matter diseases, including multiple sclerosis (MS). MTR is, however, confounded by T1 recovery and B1 inhomogeneities, limiting its application as a longitudinal clinical biomarker in MS.Magnetisation transfer saturation (MTsat, Figure 1C-D) has been proposed as an alternative MT measure which inherently accounts for T1 and largely corrects for B1 inhomogeneities.1 Compared to healthy controls, normal-appearing white matter (NAWM) MTsat is reduced in relapsing-remitting MS (RRMS).2 It is not yet clear, however, how MTsat and MTR compare as longitudinal biomarkers in RRMS, nor their association with early clinical progression, which this study aims to examine.
Methods
We recruited seventy-seven people with RRMS to an extended MRI sub-study of Future-MS, a longitudinal cohort study of people newly diagnosed with RRMS (protocol details available elsewhere3,4). Patients were treatment-naïve at baseline and clinical assessment included Expanded Disability Status Score (EDSS). Approval was granted from the local Research Ethics committee and written informed consent was provided by participants.At baseline and one year follow-up, patients underwent MR imaging on a 3.0T MR system (Prisma; Siemans Healthcare, Erlangen, Germany) with 32-channel head coil. Structural imaging included a sagittal 3D T1-weighted MPRAGE (1mm isotropic voxels; TR/TE: 2.26/2500 ms; 176 slices; 256 x 256 mm acquisition matrix) and axial 2D T2 FLAIR PROPELLER (1 x 1 x 3mm; TR/TE: 120/9500ms; 60 slices; 256 x 256 mm).
MT imaging was three sagittal 3D gradient echo fast low-angle shot (FLASH) sequences: two proton density images (1.4mm isotropic; 128 slices; 160 x 172 mm; TR=30ms, α=5°) with and without a Gaussian off-resonance MT saturation pulse, plus a T1-weighted image (TR=15ms, α=18°).
Preprocessing included automatic segmentation of T2 FLAIR white matter lesions (WMLs), with manual correction, and segmentation of NAWM from the T1-weighted MPRAGE with FreeSurfer.4
Statistical analyses were performed in RStudio (v1.4.1103). Longitudinal change was assessed with paired t-tests; where significant, follow-up linear mixed modelling was applied with correction for age, lesion load and initiation of disease-modifying therapies (DMTs) with correction for multiple comparisons. The association of longitudinal change in MT metrics with EDSS progression (stable/improved versus worse) over one year was determined with binomial logistic regression independently for MTsat and MTR, with age, longitudinal change in lesions load and in whole brain volume (corrected for intracranial volume) as covariates.
Results
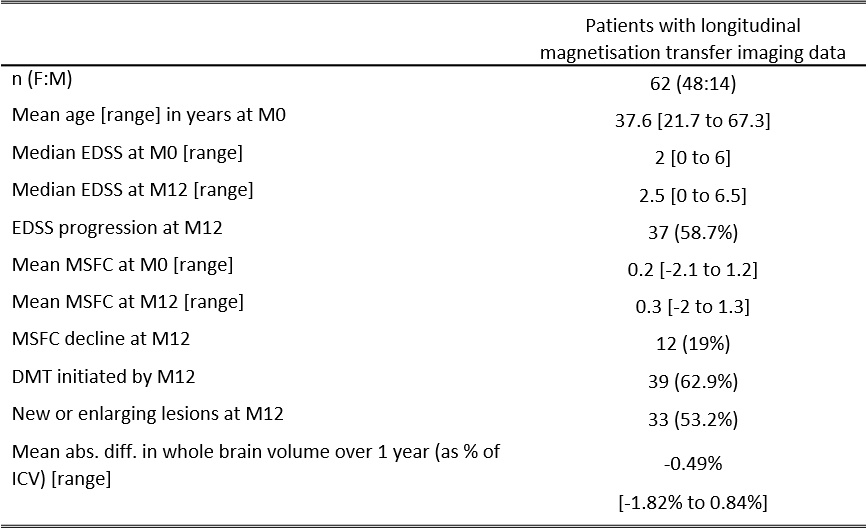
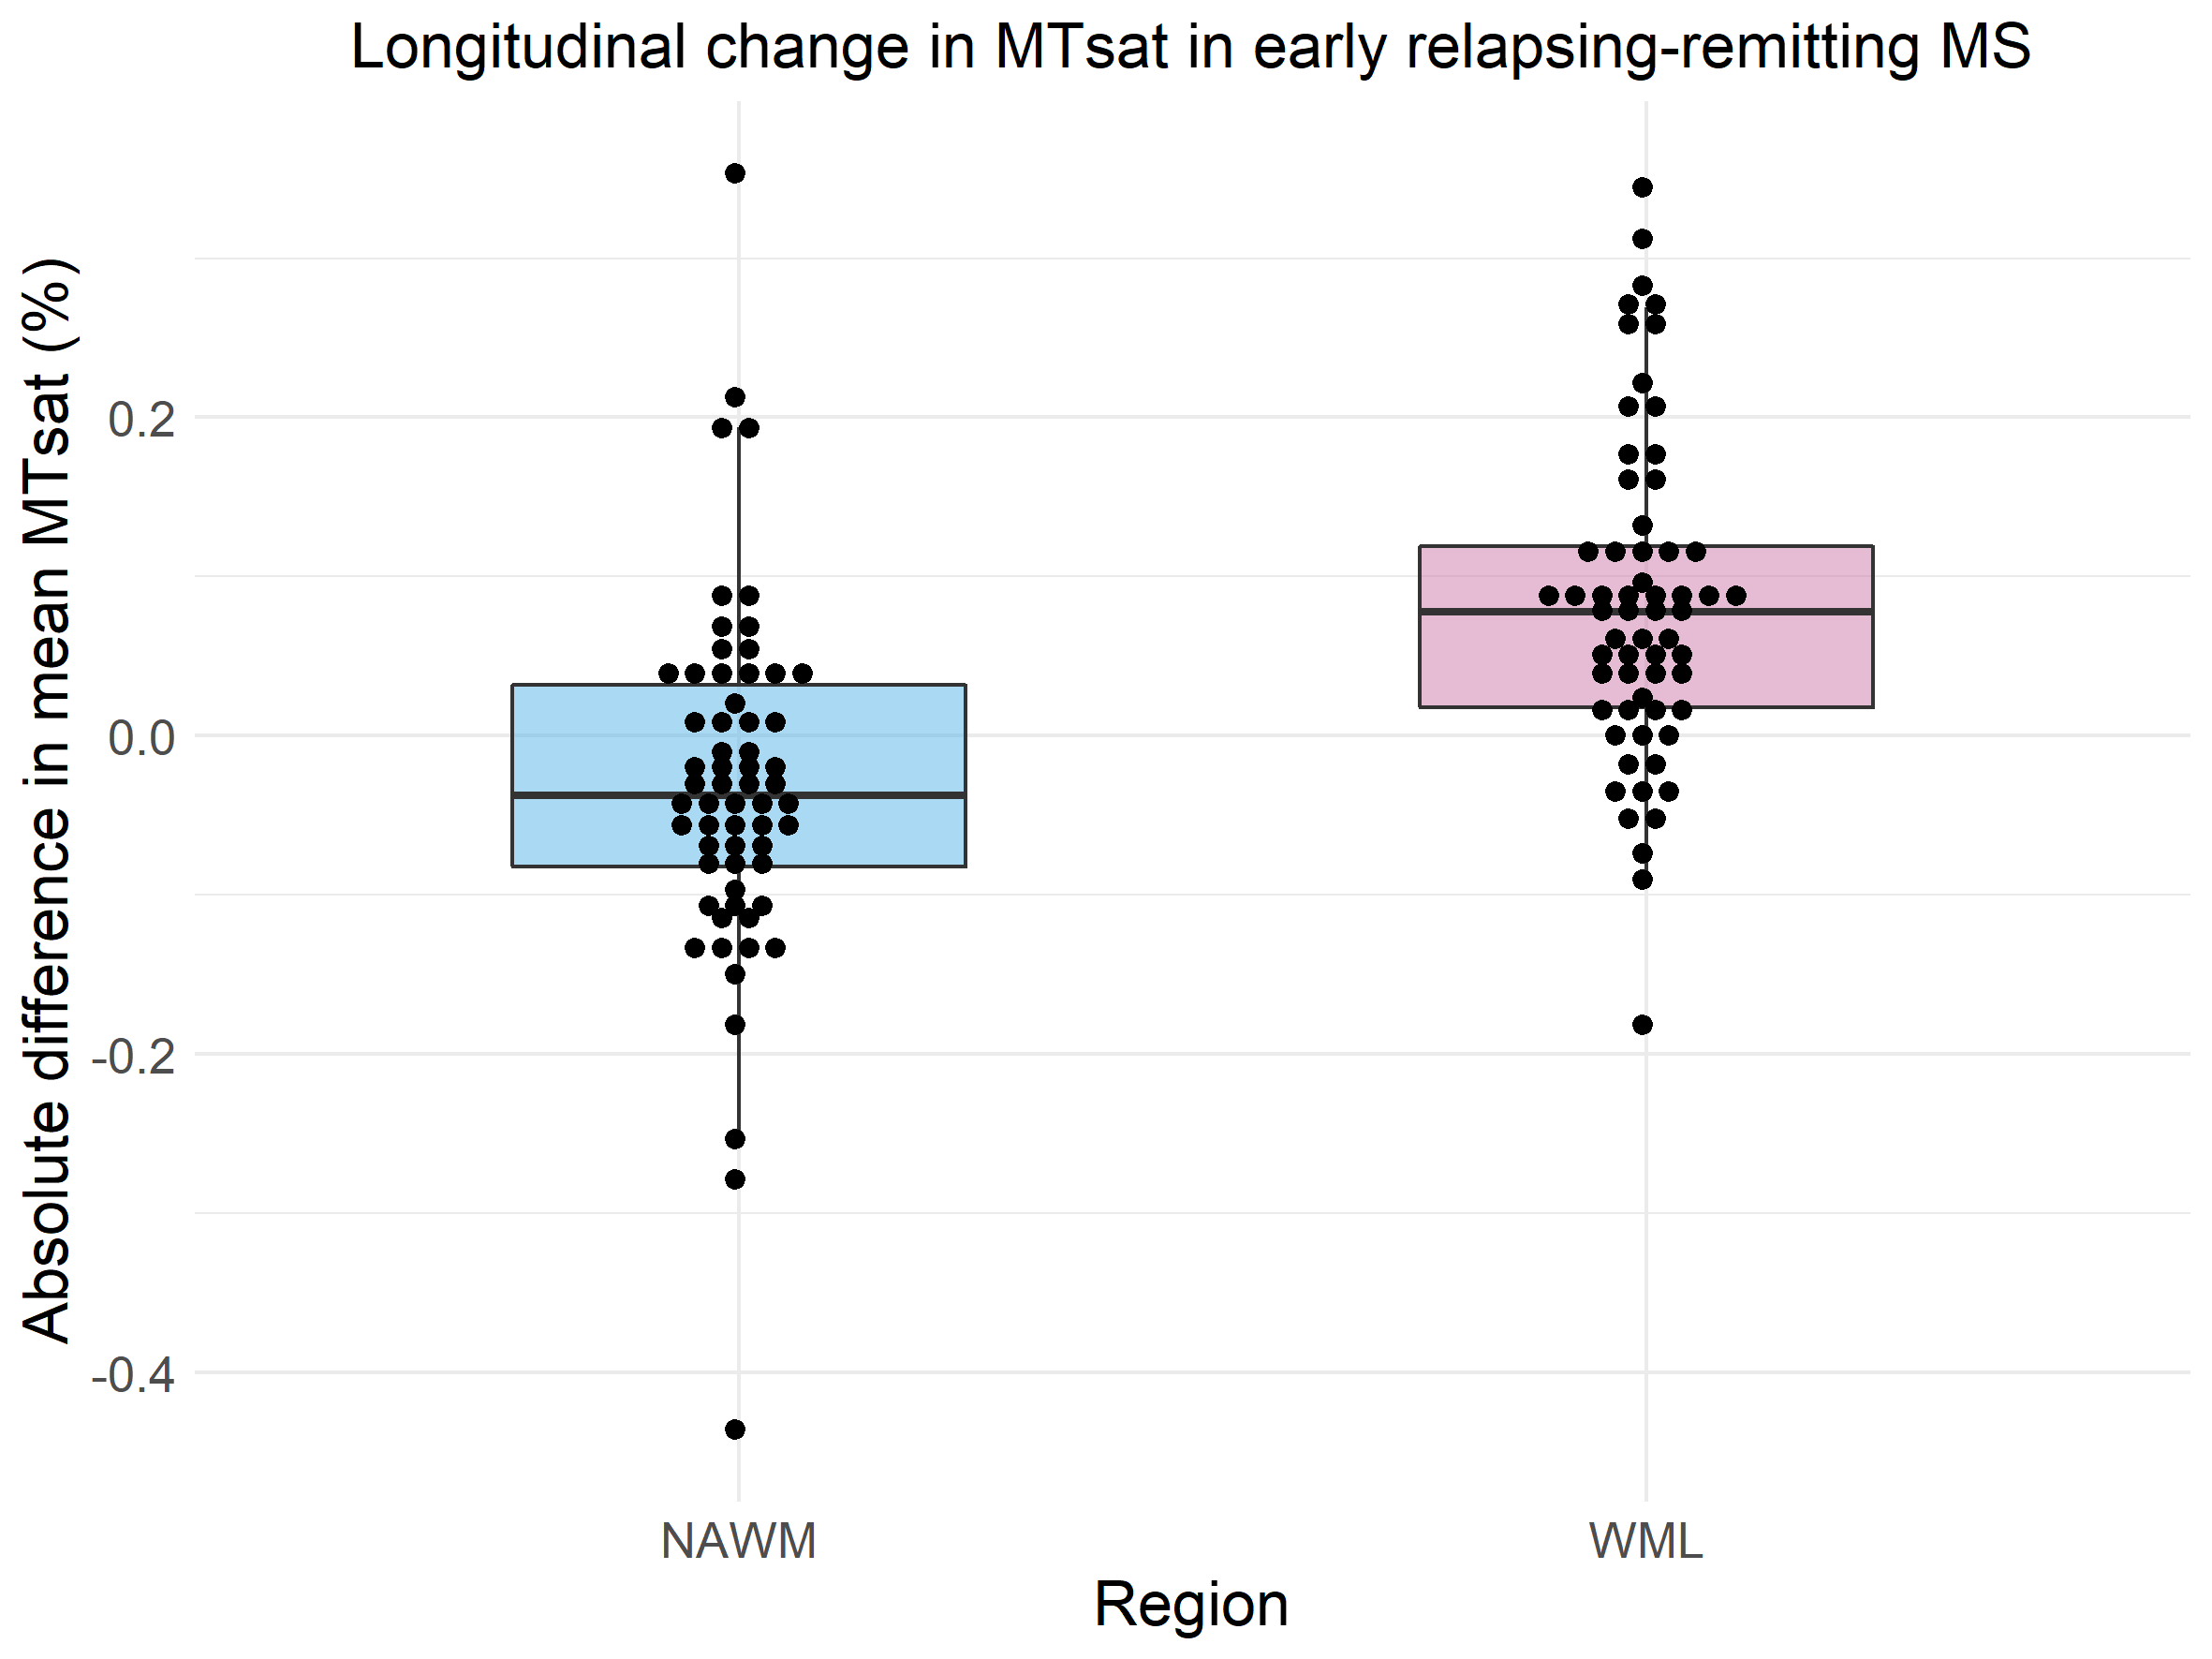
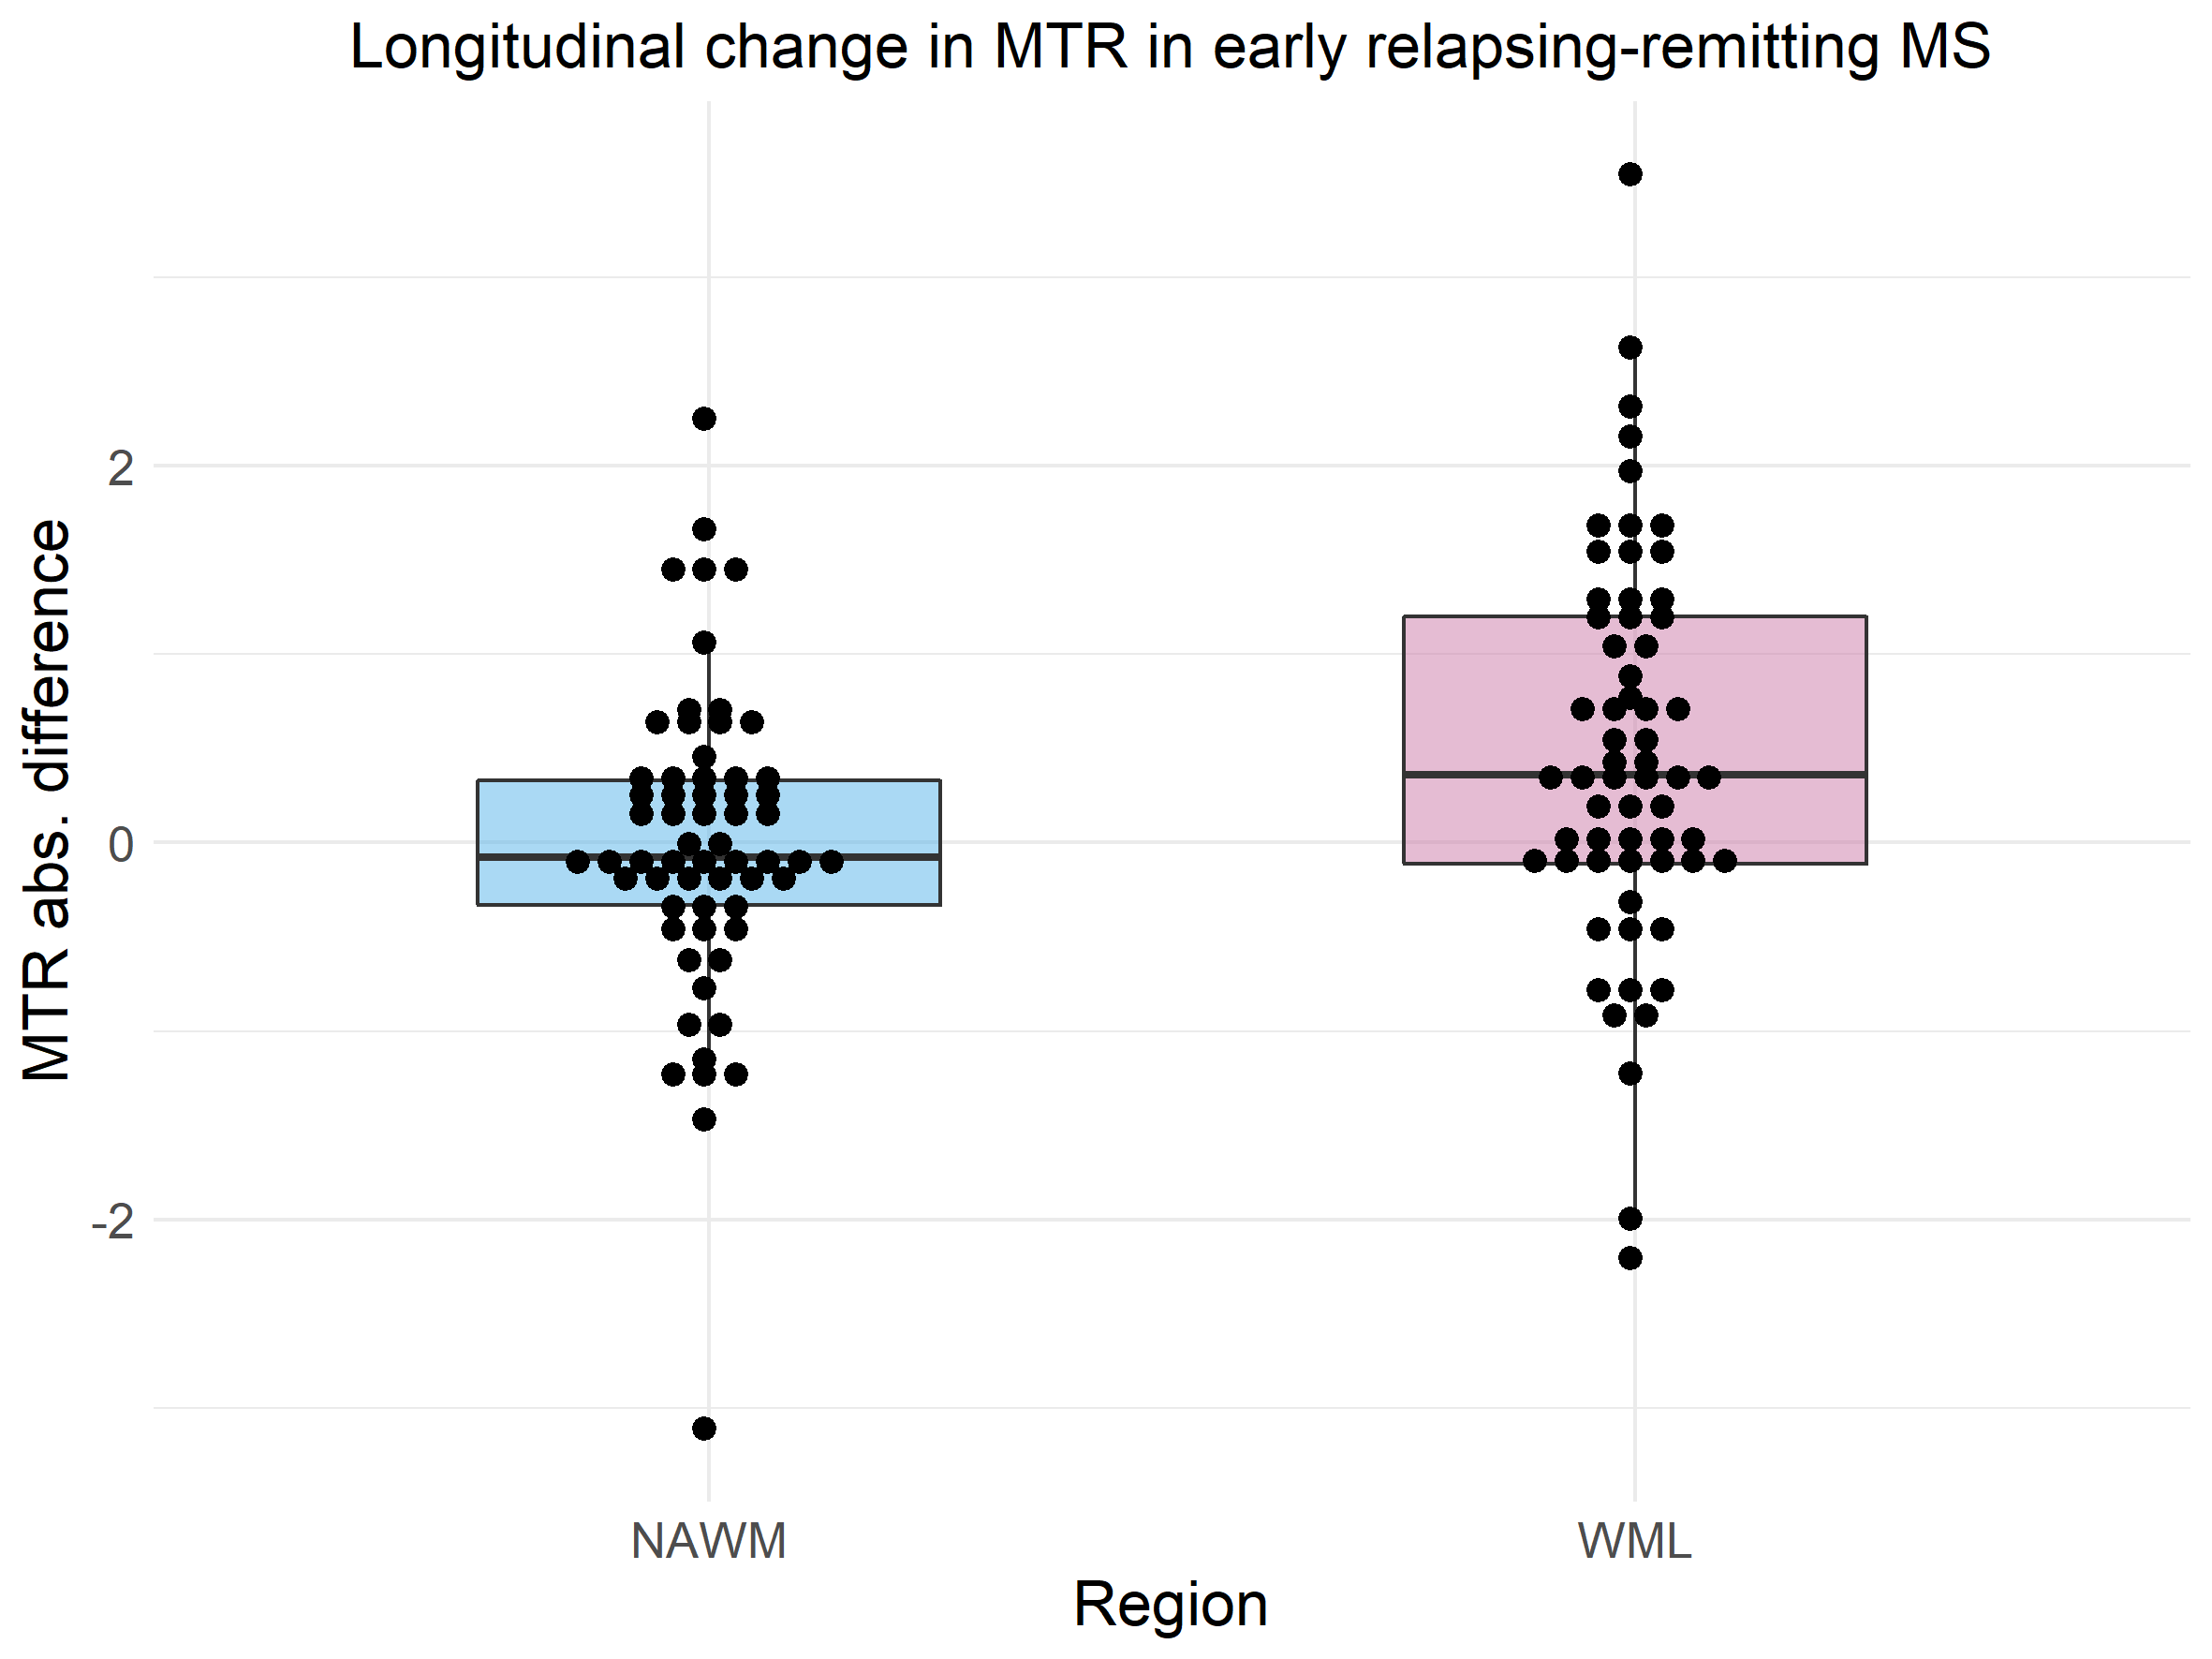
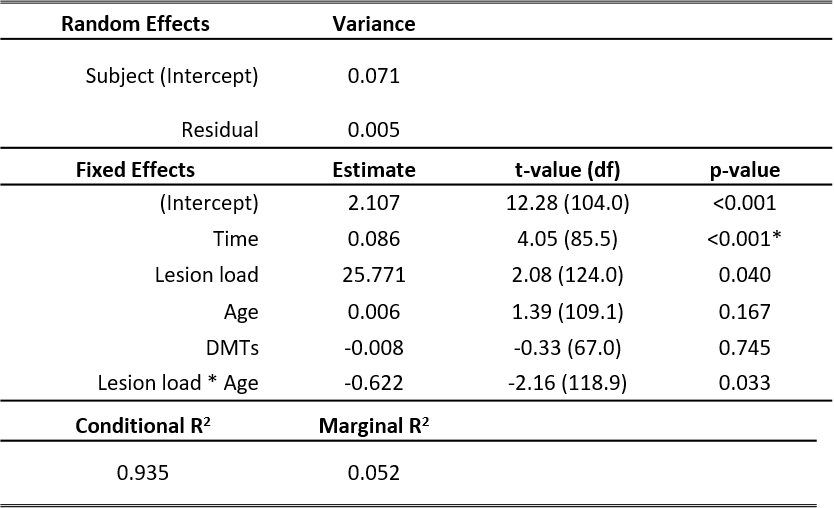
Longitudinal MT data was available for sixty-two patients (Table 1). Paired t-tests showed a significant decrease in MTsat in NAWM over one year (abs. mean difference -0.032% [95% CI -0.061% to -0.003%], t(61) = -2.19 , p = 0.033, Figure 2) but no difference in NAWM MTR (mean difference -0.008 [95% CI -0.22 to 0.20], t(61) = -0.079, p = 0.94, Figure 3). Follow-up linear mixed models showed the longitudinal decrease in MTsat in NAWM remained after controlling for age, lesion load and initiation of DMTs (β = -0.051, t(79.1) = 2.49, p = 0.015).In WMLs, there was a significant longitudinal increase in MTsat (mean difference 0.084% [95% CI 0.057% to 0.11%], t(61) = 6.34, p <0.001) and MTR (mean difference 0.47% [95% CI 0.20% to 0.73%], t(61) = 3.52, p<0.001). Both survived correction for age, lesion load and initiation of DMTs (linear mixed models: MTsat: β = 0.086, t(85.5) = 4.05, p <0.001; MTR: β = 0.408, t(80.3) = 2.07, p = 0.042). Only longitudinal change in WML MTsat survived correction for multiple comparisons (Table 2).
Logistic regression showed a significant association between NAWM MTsat and EDSS progression (β=-12.75, z value -2.87, p=0.004) and explained 37.9% (Nagelkerke’s R2) of the variance. One year change in NAWM MTsat and in whole brain volume were also significant factors, but age and change in lesion load were not.
Logistic regression showed that one year change in WML MTsat was not associated with disability progression (β=-4.91, z-value -1.72, p=0.085). The model was significant (χ2(4) = 10.46, p = 0.033) but driven by change in lesion load. Neither NAWM MTR nor WML MTR were significantly associated with disability progression (binomial logistic regression: χ2(4) = 7.31, p = 0.121 and χ2(4) = 7.73, p = 0.102, respectively).
Discussion
Results suggest that MTsat is more sensitive to longitudinal subtle myelin loss in NAWM than MTR in newly diagnosed RRMS. The observed relationship with clinical disability progression suggests that loss of myelin integrity in otherwise normal-appearing tissue may contribute to worsening MS symptoms.The increase in WML MTsat and, to a lesser extent, MTR was unexpected but may reflect myelin repair which can occur in a spontaneous fashion. Early treatment with DMTs may also allow myelin recovery. The lack of association between MT metrics and clinical disability may be due to the relatively small volume of interest or longitudinal recovery of tissue.
Conclusion
In conclusion, MTsat shows greater sensitivity to longitudinal change in myelin integrity than MTR in RRMS, which is associated with clinical disability progression. Longitudinal studies on a longer timescale would help to solidify the added value of MTsat as a myelin-sensitive biomarker in MS.Acknowledgements
We acknowledge support and funding from Chief Scientist Office Scottish PhD Research & Innovation Network Traineeships Motor Neuron Disease/Multiple Sclerosis Studentship (ENY), Wellcome Trust Senior Research Fellowship (215621/Z/19/Z, DPJH), NHS Lothian Research and Development Office (MJT), MS Society UK Centre of Excellence and the Anne Rowling Clinic.
With thanks to Future-MS, hosted by Precision Medicine Scotland Innovation Centre (PMSIC) and funded by a grant from the Scottish Funding Council to PMS-IC and Biogen Idec Ltd Insurance (combined funding under reference Exemplar SMS_IC010). With special thanks to all Future-MS participants who have made this study possible.
References
1. Helms G, Dathe H, Kallenberg K, Dechent P. High‐resolution maps of magnetization transfer with inherent correction for RF inhomogeneity and T1 relaxation obtained from 3D FLASH MRI. Magnetic Resonance in Medicine: An Official Journal of the International Society for Magnetic Resonance in Medicine. 2008 Dec;60(6):1396-407.
2. Lommers E, Simon J, Reuter G, Delrue G, Dive D, Degueldre C, Balteau E, Phillips C, Maquet P. Multiparameter MRI quantification of microstructural tissue alterations in multiple sclerosis. NeuroImage: Clinical. 2019 Jan 1;23:101879.
3. Kearns PK, Martin SJ, Chang YT, Meijboom R, York EN, Chen Y, Weaver C, Stenson A, Freyer E, Hafezi K, Harroud A. FutureMS Cohort Profile: A Scottish Multi-Centre Inception Cohort Study of Relapsing-Remitting Multiple Sclerosis. medRxiv. 2021 Jan 1.
4. Meijboom R, Wiseman SJ, York EN, Bastin ME, Hernandez MD, Thrippleton MJ, Mollison D, White N, Kampaite A, Kwong KC, Gonzalez DR. Rationale and design of the brain magnetic resonance imaging protocol for FutureMS: a longitudinal multi-centre study of newly diagnosed patients with relapsing-remitting multiple sclerosis in Scotland. medRxiv. 2021 Jan 1.
Figures