0786
Clinical correlates of brain iron and myelin changes in Multiple Sclerosis: a multi-parameter quantitative MRI study1University of Naples "Federico II", Naples, Italy, 2Institute of Biostructure and Bioimaging, National Research Council, Naples, Italy, 3Università degli Studi della Campania "Luigi Vanvitelli", Naples, Italy
Synopsis
In this cross-sectional study, voxel-based morphometry and voxel-based quantification analyses of longitudinal relaxation rate (R1) and quantitative susceptibility (QSM) maps, reflecting myelin and iron, respectively, were conducted on 117 patients with MS (pwMS) and 53 healthy controls. Between-group differences and correlations with clinical variables (global disability, cognitive and motor performance) were assessed. We found widespread atrophy and R1 decrease in pwMS, with smaller clusters of reduced susceptibility in the thalami and cerebral WM. While subcortical atrophy and WM iron depletion contributed to global and motor disability, deep GM atrophy and R1 decrease in lesional areas correlated with cognitive performance.
Introduction
In patients with Multiple Sclerosis (pwMS), the nature and clinical relevance of brain microstructural abnormalities remain elusive. Quantitative MRI methods provide the means to explore these changes, with a particular interest in MS being devoted to the assessment of iron (via quantitative susceptibility mapping, QSM) and myelin (affecting longitudinal relaxation rate, R1), as these might offer a glimpse into fundamental disease-related processes(1,2). On the clinical side of the equation, the impact of iron and myelin changes remains unclear for several reasons, including the limits of global disability measures(3,4), the lack of whole-brain analyses(5,6), and the confounding effect of brain atrophy(7). To address these gaps, we conducted a multi-parametric analysis of quantitative MR relaxometry and QSM, together with brain volumetry, to (i) characterize the topographical distribution of brain atrophy and iron and myelin changes in pwMS and (ii) clarify their impact on both cognitive and motor disability.Methods
In this cross-sectional study, we enrolled pwMS diagnosed according to the 2010-McDonald criteria(8) and age- and sex-comparable healthy controls (HC). PwMS underwent clinical examination to quantify disability using the Expanded Disability Status Scale (EDSS)(9) and were tested using the Symbol Digit Modalities Test (SDMT)(10) to assess cognitive processing speed. Ambulation and manual dexterity were probed through Timed 25-Foot Walk (T25FW) and 9-Hole Peg Test (9-HPT)(11), respectively. SDMT and motor scores were expressed as Z-scores with respect to reference populations, and motor scores averaged to obtain a single composite measure of motor performance. All MRI exams were performed on the same 3T scanner and included 3D T1-weighted and T2-weighted FLAIR sequences and two spoiled gradient-echo sequences for quantitative analyses(12). A complete description of the processing steps leading to the computation of R1 and QSM (χ) maps is available in previous works(12-14). Initially, quantitative maps were mapped onto the corresponding T1-weighted volumes, demyelinating lesions were automatically segmented on FLAIR images with LST (https://www.applied-statistics.de/lst.html) and lesion masks were used for lesion filling on T1-weighted images. Subsequent processing steps were carried out in SPM12 following the voxel-based morphometry (VBM)(15) and voxel-based quantification (VBQ)(16) approaches: filled T1-weighted volumes were segmented in tissue classes and normalized to a 1mm isotropic template in MNI space, and the estimated spatial transformations were applied to quantitative maps. Normalized GM and WM maps were modulated and smoothed(17), while normalized R1 and χ maps were smoothed via the tissue-weighted smoothing procedure(16) implemented in the hMRI toolbox (https://hmri-group.github.io/hMRI-toolbox) to account for the partial volume contribution of tissue density. Preprocessed tissue probability, R1, and ꭓ maps were statistically analyzed, separately for GM and WM, to assess voxel-wise between-group differences using a nonparametric permutation-based approach via the TFCE toolbox (http://www.neuro.uni-jena.de/tfce). Age, sex, and total intracranial volume (TIV) were included in the model as confounding variables, with k=100 voxels and significance level p<0.05 after FWER correction. When significant between-group differences emerged, the corresponding clusters were used as explicit masks in voxel-wise regression analyses assessing the relationships between clinical variables and MRI metrics.Results
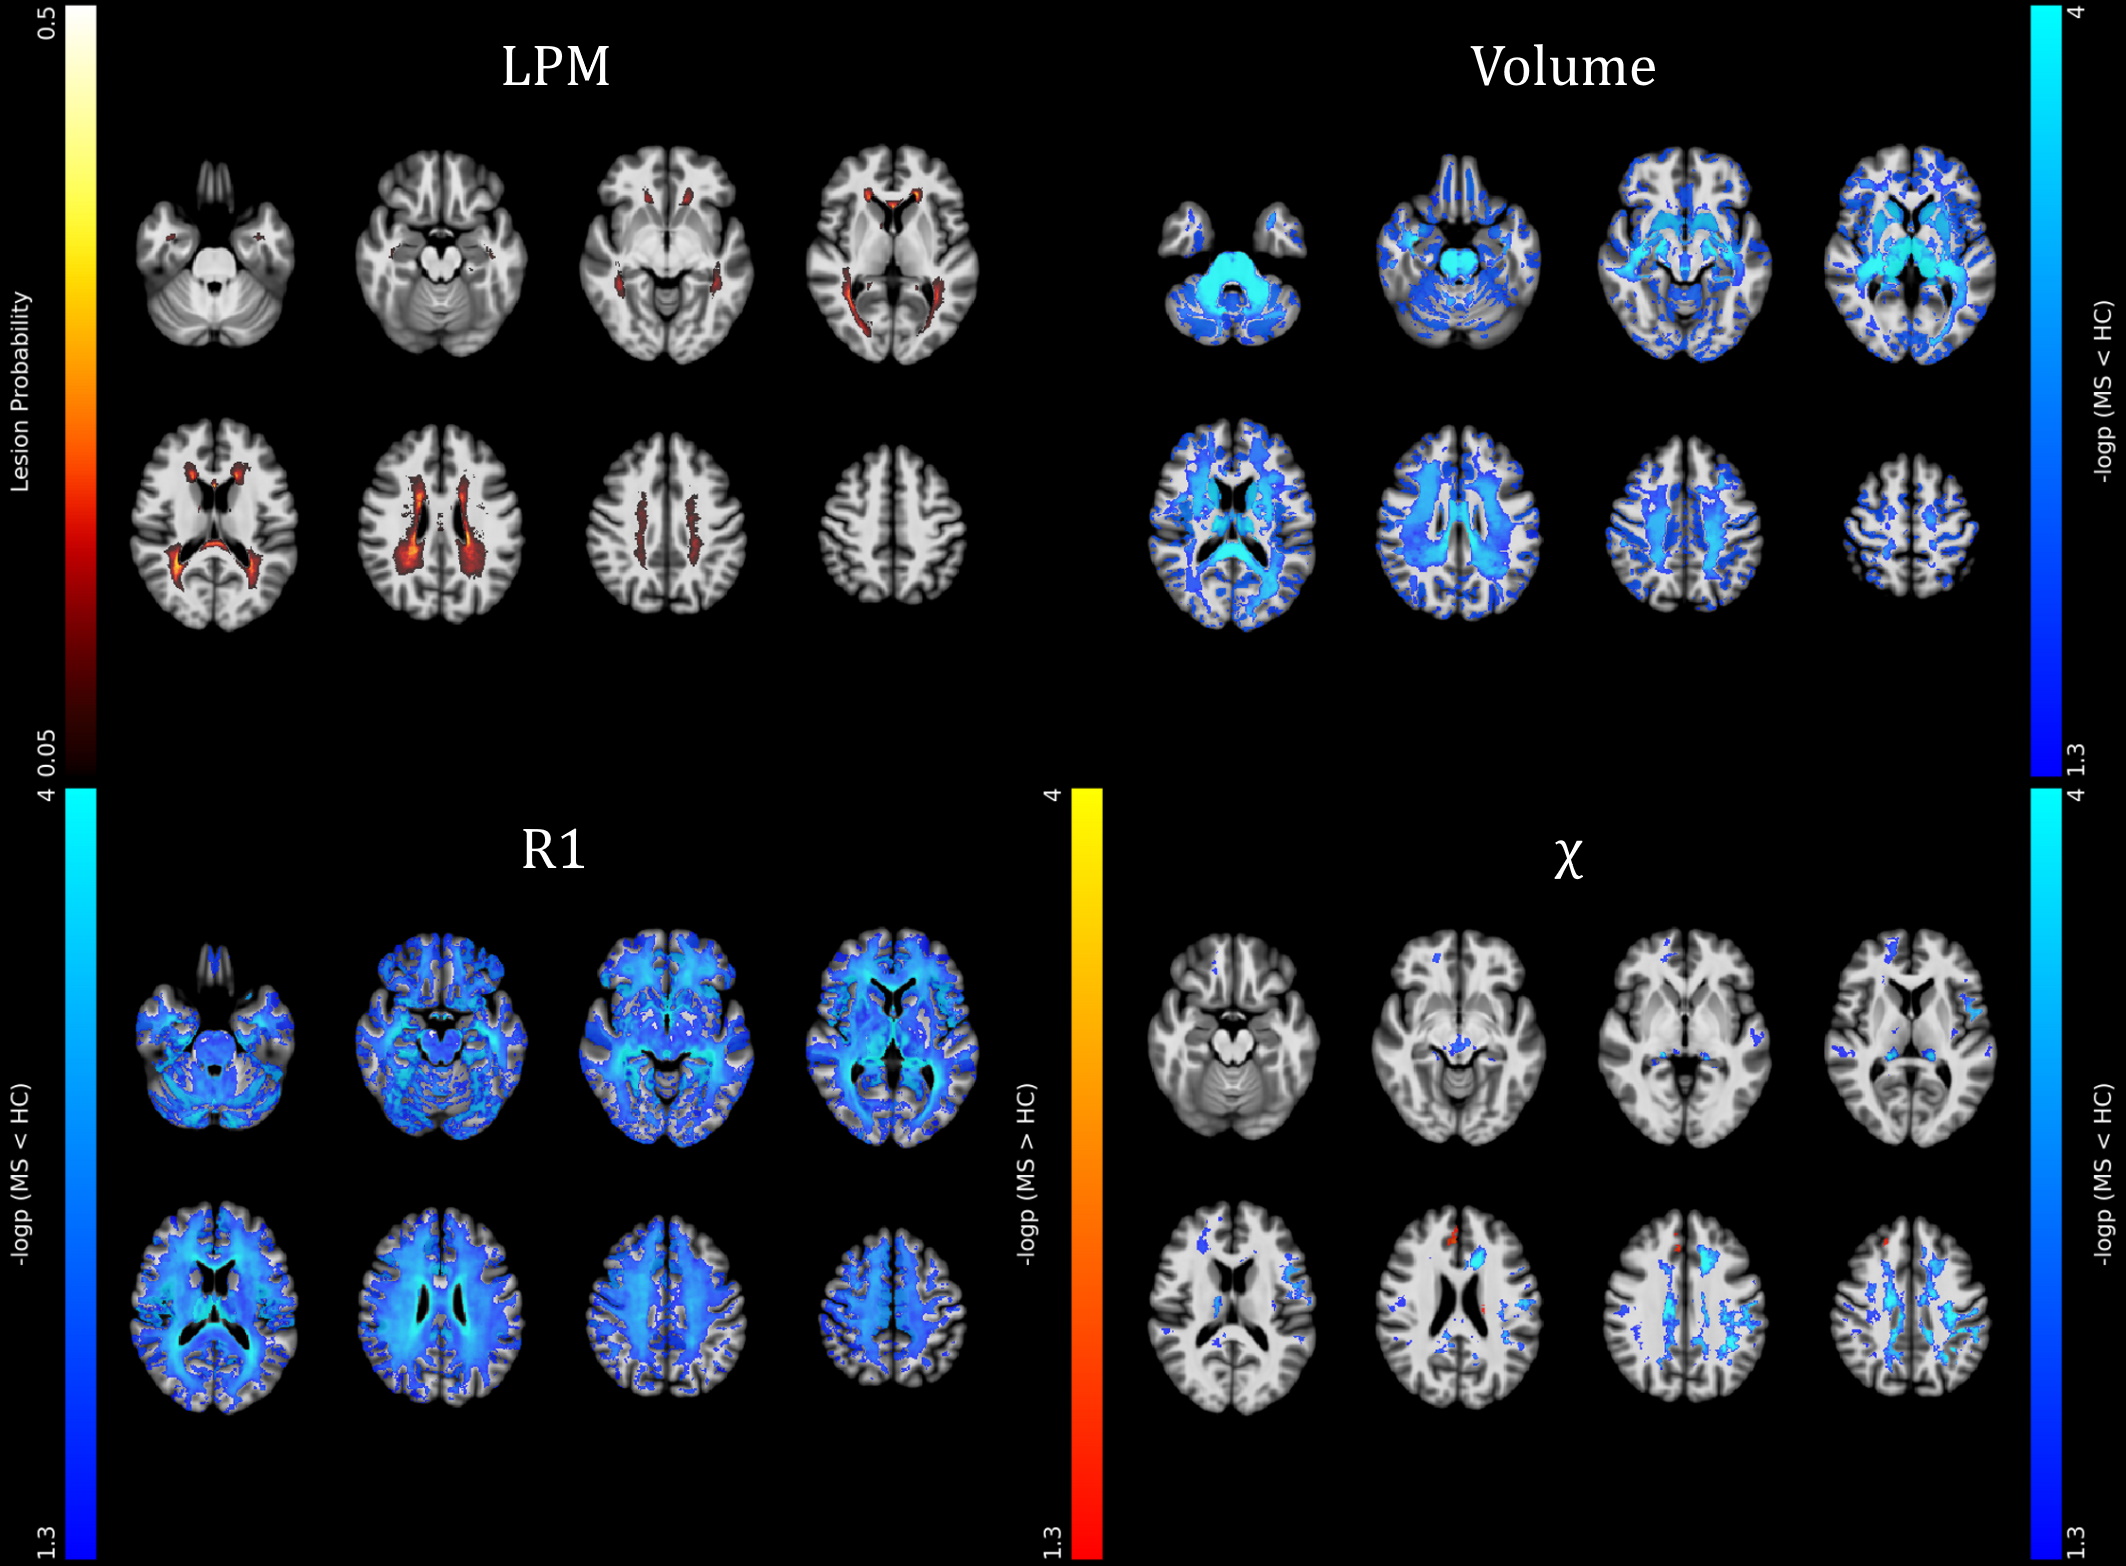
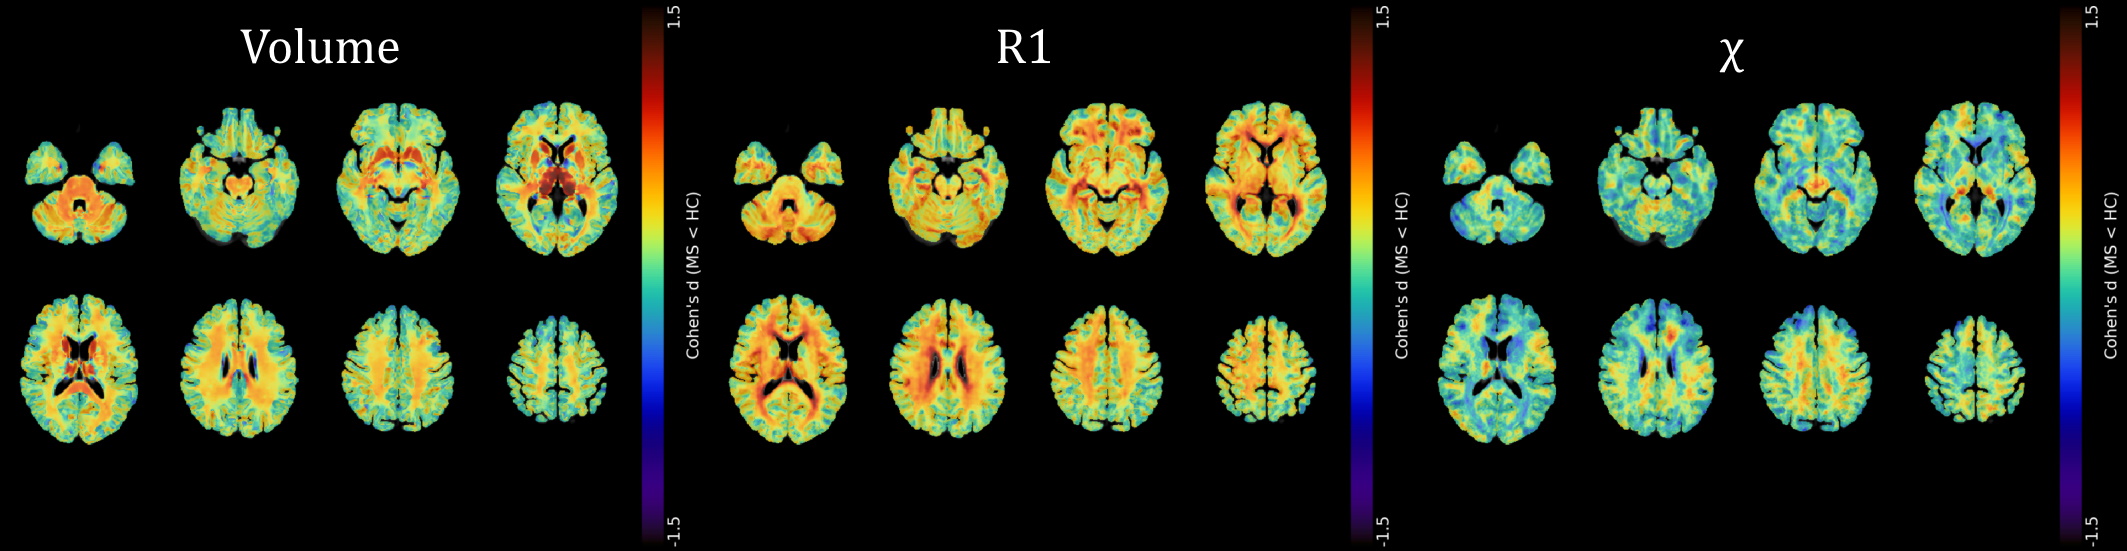
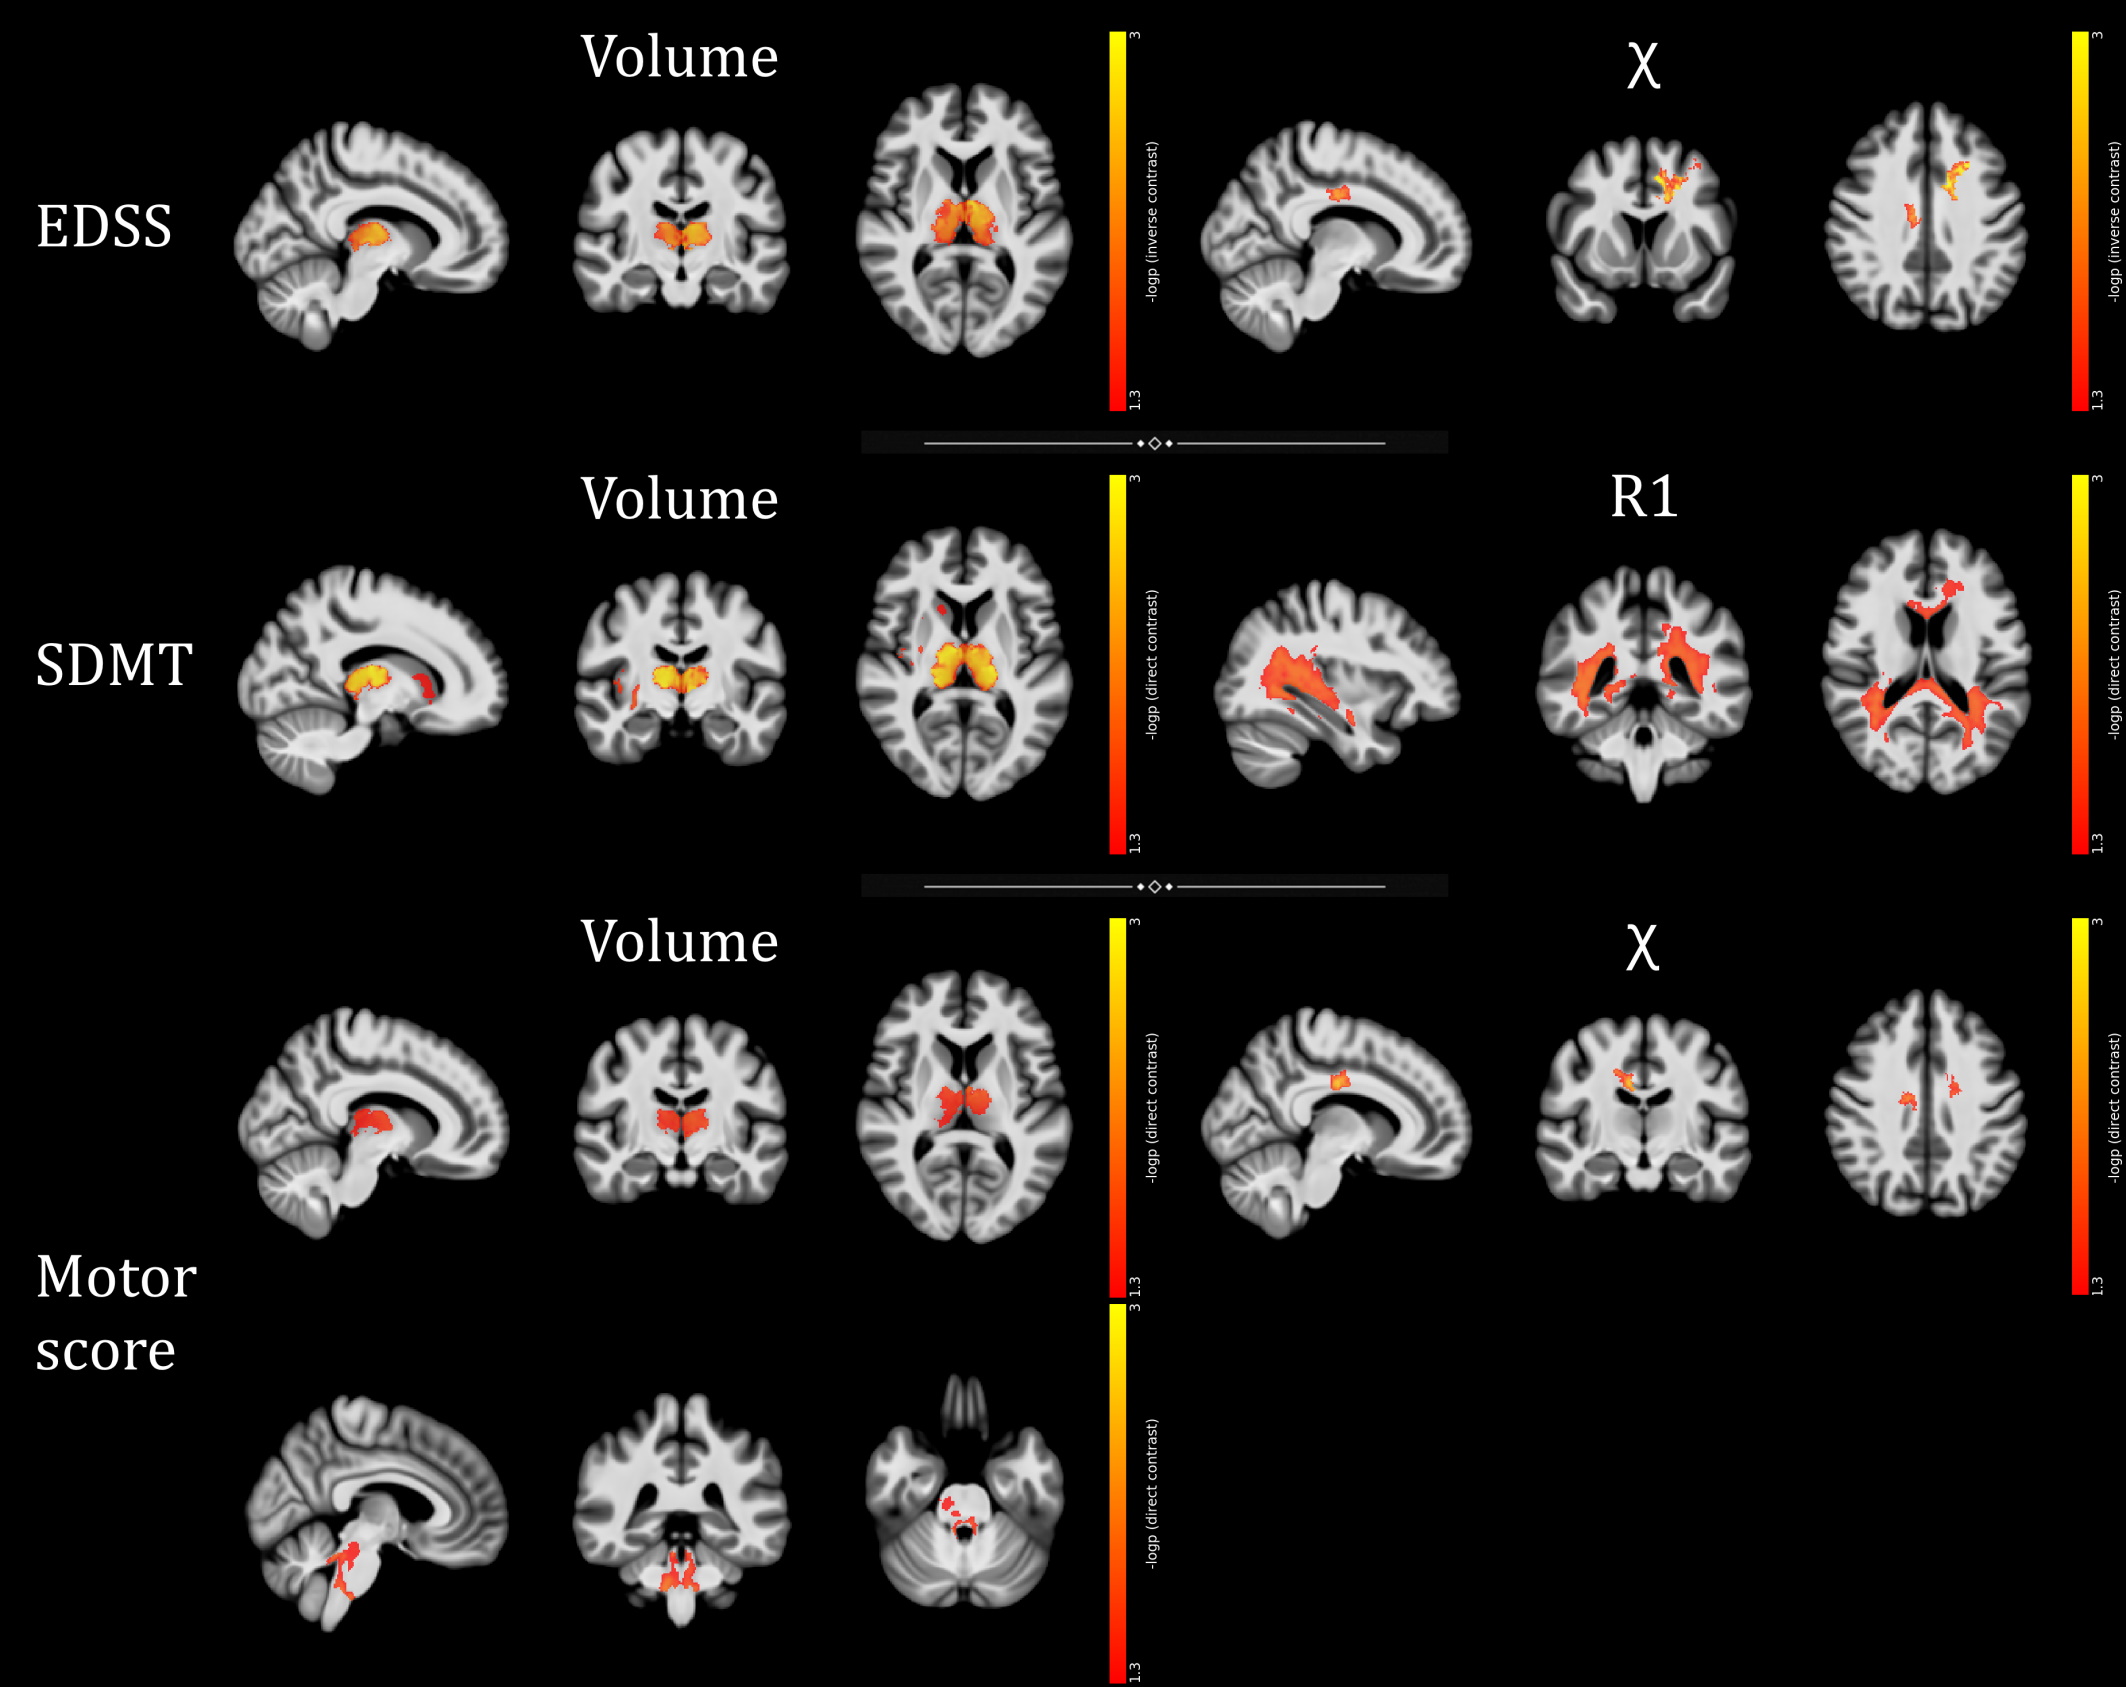
A total of 117 pwMS (40.6±11.9 years; F/M=85/32) were enrolled, along with 53 HC (41.3±11.6 years; F/M=33/20). At the between-group analyses (Figures 1-2), pwMS showed extensive clusters of atrophy compared to HC, with local maxima located in the thalami (p-values<0.001). Similarly, widespread clusters of reduced R1 values emerged, peaking in the corpus callosum, periventricular WM, and thalami (p-values<0.001). Regarding QSM, pwMS showed several clusters of reduced ꭓ values compared to HC involving cerebral WM (p-values<0.001), midbrain (p=0.001) and thalami (p-values<0.001), along with small clusters of increased QSM values in the left caudate nucleus (p=0.004) and right frontal cortex (p-values<0.02). As for the relationship with clinical variables (Figure 3), thalamic volume correlated both negatively with clinical disability (p=0.001) and positively with cognitive processing speed (p=0.001) and motor performance (p=0.01), with additional positive correlations between the SDMT score and GM volume in the right basal ganglia and insula (p-values<0.04) and between motor performance and infratentorial WM volume at the level of cerebellar peduncles (p=0.01). Furthermore, a large cluster of significant association between the SDMT score and R1 values emerged, extensively involving periventricular WM and peaking around the right posterior thalamic radiation (p=0.01), while χ values in the frontal sections of the cingulum and corona radiata were related both negatively with EDSS (p<0.001) and positively with motor performance (p=0.003).Discussion
PwMS showed an atrophy pattern mainly involving deep GM, posterior and infratentorial regions. Also, they exhibited widespread R1 decrease across GM and WM regions, extending well beyond the distribution of T2-hyperintense lesions and presumably reflecting demyelination, and more limited modifications in QSM, possibly suggesting oligodendrocyte damage-related iron depletion in cerebral WM and thalami and atrophy-related relative iron increase in the basal ganglia. WM QSM changes and subcortical atrophy, reflecting oligodendrocyte damage and neuronal loss, significantly contributed to global and motor disability, while cognitive performance was related to deep GM atrophy and R1 abnormalities mostly overlapping with the distribution of T2-hyperintense lesions, likely causing disconnection of distributed networks subserving high-level functions.Conclusion
We confirmed the presence of widespread atrophy and demyelination in MS, with more limited modifications of tissue QSM. While atrophy and iron changes are related to global and motor disability, demyelination is a meaningful correlate of cognition.Acknowledgements
No acknowledgement found.References
1. Stuber C, Pitt D, Wang Y. Iron in Multiple Sclerosis and Its Noninvasive Imaging with Quantitative Susceptibility Mapping. Int J Mol Sci 2016;17(1).
2. O'Muircheartaigh J, Vavasour I, Ljungberg E, et al. Quantitative neuroimaging measures of myelin in the healthy brain and in multiple sclerosis. Hum Brain Mapp 2019;40(7):2104-2116.
3. Rudko DA, Solovey I, Gati JS, Kremenchutzky M, Menon RS. Multiple sclerosis: improved identification of disease-relevant changes in gray and white matter by using susceptibility-based MR imaging. Radiology 2014;272(3):851-864.
4. Zivadinov R, Tavazzi E, Bergsland N, et al. Brain Iron at Quantitative MRI Is Associated with Disability in Multiple Sclerosis. Radiology 2018;289(2):487-496.
5. Schmalbrock P, Prakash RS, Schirda B, et al. Basal Ganglia Iron in Patients with Multiple Sclerosis Measured with 7T Quantitative Susceptibility Mapping Correlates with Inhibitory Control. AJNR Am J Neuroradiol 2016;37(3):439-446.
6. Fujiwara E, Kmech JA, Cobzas D, et al. Cognitive Implications of Deep Gray Matter Iron in Multiple Sclerosis. AJNR American journal of neuroradiology 2017;38(5):942-948.
7. Pontillo G, Petracca M, Monti S, et al. Unraveling Deep Gray Matter Atrophy and Iron and Myelin Changes in Multiple Sclerosis. AJNR Am J Neuroradiol 2021;42(7):1223-1230.
8. Polman CH, Reingold SC, Banwell B, et al. Diagnostic criteria for multiple sclerosis: 2010 revisions to the McDonald criteria. Ann Neurol 2011;69(2):292-302.
9. Kurtzke JF. Rating neurologic impairment in multiple sclerosis: an expanded disability status scale (EDSS). Neurology 1983;33(11):1444-1452.
10. Goretti B, Niccolai C, Hakiki B, et al. The Brief International Cognitive Assessment for Multiple Sclerosis (BICAMS): normative values with gender, age and education corrections in the Italian population. BMC neurology 2014;14:171.
11. Fischer JS, Rudick RA, Cutter GR, Reingold SC. The Multiple Sclerosis Functional Composite Measure (MSFC): an integrated approach to MS clinical outcome assessment. National MS Society Clinical Outcomes Assessment Task Force. Mult Scler 1999;5(4):244-250.
12. Monti S, Borrelli P, Tedeschi E, Cocozza S, Palma G. RESUME: Turning an SWI acquisition into a fast qMRI protocol. PLoS One 2017;12(12):e0189933.
13. Palma G, Tedeschi E, Borrelli P, et al. A Novel Multiparametric Approach to 3D Quantitative MRI of the Brain. PLoS One 2015;10(8):e0134963.
14. Borrelli P, Palma G, Tedeschi E, et al. Improving Signal-to-Noise Ratio in Susceptibility Weighted Imaging: A Novel Multicomponent Non-Local Approach. PLoS One 2015;10(6):e0126835.
15. Ashburner J, Friston KJ. Voxel-based morphometry--the methods. Neuroimage 2000;11(6 Pt 1):805-821.
16. Draganski B, Ashburner J, Hutton C, et al. Regional specificity of MRI contrast parameter changes in normal ageing revealed by voxel-based quantification (VBQ). Neuroimage 2011;55(4):1423-1434.
17. Smith SM, Nichols TE. Threshold-free cluster enhancement: addressing problems of smoothing, threshold dependence and localisation in cluster inference. Neuroimage 2009;44(1):83-98.
Figures