0785
Multiple sclerosis related fatigue: Altered resting-state functional connectivity of the Default Mode Network.1Department of Magnetic Resonance, Lanzhou University Second Hospital, Lanzhou, China, 2Philips Healthcare, Xi’an, China
Synopsis
The objective of this study was to elucidate the no-motor component of fatigue mechanism in multiple sclerosis (MS) patients by studying the resting state functional connectivity (RS-FC) of default mode network (DMN). 12 with fatigue (F) and 10 without fatigue (nF) MS underwent resting sate magnetic resonance imaging (MRI). We selected 11 priori regions within the DMN as the regions of interests (ROIs) and ROI to ROI and ROI to global FC were calculated. Compared to nF-MS patients, F-MS patients showed abnormal increased functional connectivity in brain regions associated with cognitive function within the DMN.
Introduction
Multiple Sclerosis (MS) is an immune-mediated, demyelinating disease of the central nervous system. Fatigue (i.e., persistent mental and/or physical exhaustion or lack of energy) is the most common and disabling symptom, significantly impacting on patients’ daily life activities and affecting up to 83% of all MS patients1. MS-related fatigue can exist without any mental or physical tasks, which mechanisms remain poorly understood. Regional damage to the grey matter in MS patients is likely to disrupt brain cortical network connectivity within cortical and sub-cortical networks2. Resting-state (rs)-fMRI in MS has mainly been used to study the intrinsic functional architecture and connectivity of the brain and relation to disease progression and clinical impairment. Previous studies shown MS-fatigue related to motivation and reward processing3, thus supporting the hypothesis that fatigue is not just subtended by a motor network dysfunction. Between resting-state networks, the most relevant non-motor network is the default mode network (DMN)4. The aim of this study is to explore the no-motor component of fatigue mechanism in MS by studying the resting state functional connectivity (RS-FC) of DMN in relapsing remitting multiple sclerosis (RRMS) patients with fatigue (F) and without fatigue (nF).Methods
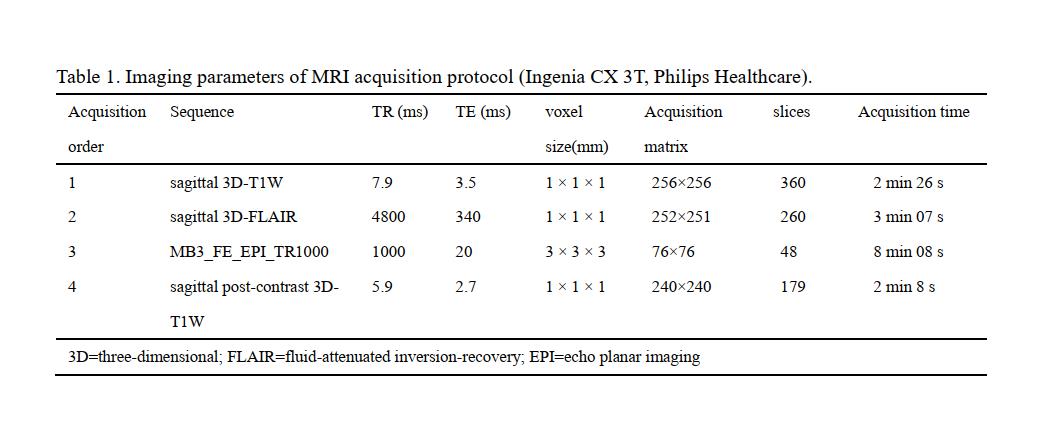
We recruited 12 F-RRMS (5 females, age 30.0 ± 6.9 years, symptom duration 3.6±1.6 years) and 10 nF-RRMS (7 females, age 27.4 ± 7.1 years, symptom duration 4.9 ± 1.8 years) with the following criteria: (1) absence of clinical relapses and stable MS treatment for at least 3 months, (2) no corticosteroid therapy in the last 60 days, (3) Beck Depression Inventory II (BDI-II) score ≤14, (4) Montreal Cognitive Assessment (MoCA) score ≥26, (4) Expanded Disability Status Scale (EDSS) 0–6, (5) no sleep disorders, and (6) right-handed. Fatigue was assessed using the fatigue severity scale (FSS). Patients were classified as fatigued if they had at least a score of FSS = 45.All patients were scanned using a 3.0 T MR scanner (Ingenia CX, Philips Healthcare, the Netherlands) with a 32-channel phased-array head coil. RS-fMRI data were acquired using a single-shot EPI sequence with eyes closed. High-resolution structural MRI data were collected using a 3D T1-weighted MPRAGE sequence and a 3D FLAIR sequence. And all subjects completed post-contrast 3D-T1WI to ensure that there were no acute lesions. Table 1 summarizes the imaging parameters of the MRI protocols.
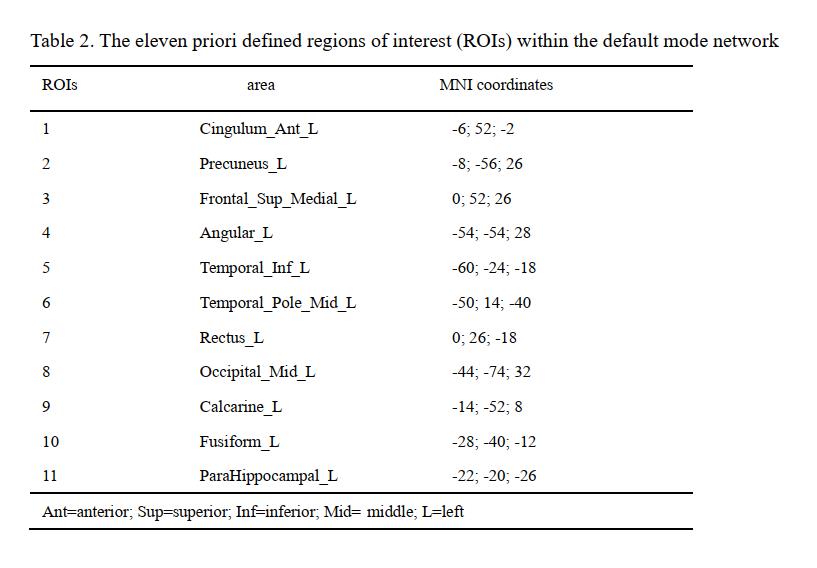
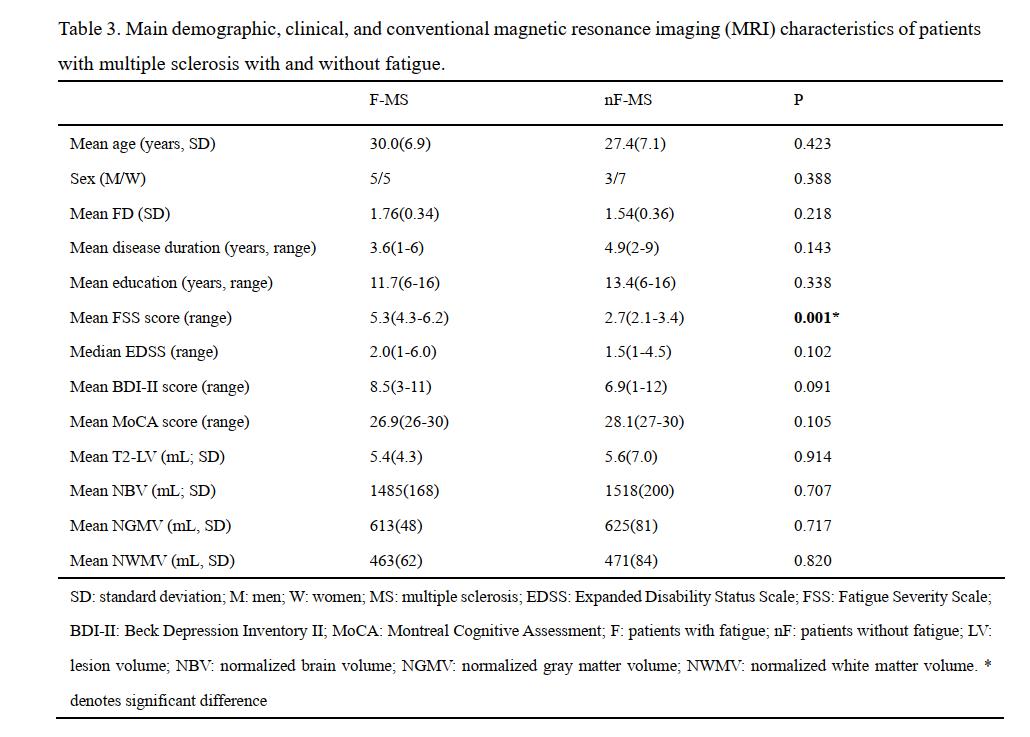
Data preprocessing was performed using DPARSFA (www.rfmri.org/DPARSF) based on SPM12 (www.fil.ion.ucl.ac.uk/spm/). Two F-MS patients had an absolute motion greater than 2.5 mm and were excluded from all analyses. We chose to investigate several priori regions within the DMN as regions of interest (ROIs) (table 2). The T2-lesion volume was measured by 3D-Slicer (https://download.slicer.org/), and the volume of global, white and gray matter was measured by CAT12 (www.neuro.uni-jena.de/cat/). Table 3 shows the demographic, clinical and conventional MRI characteristics of the two groups. Two sample t-test analyses were performed to assess functional connectivity differences between F-MS and nF-MS.
Results
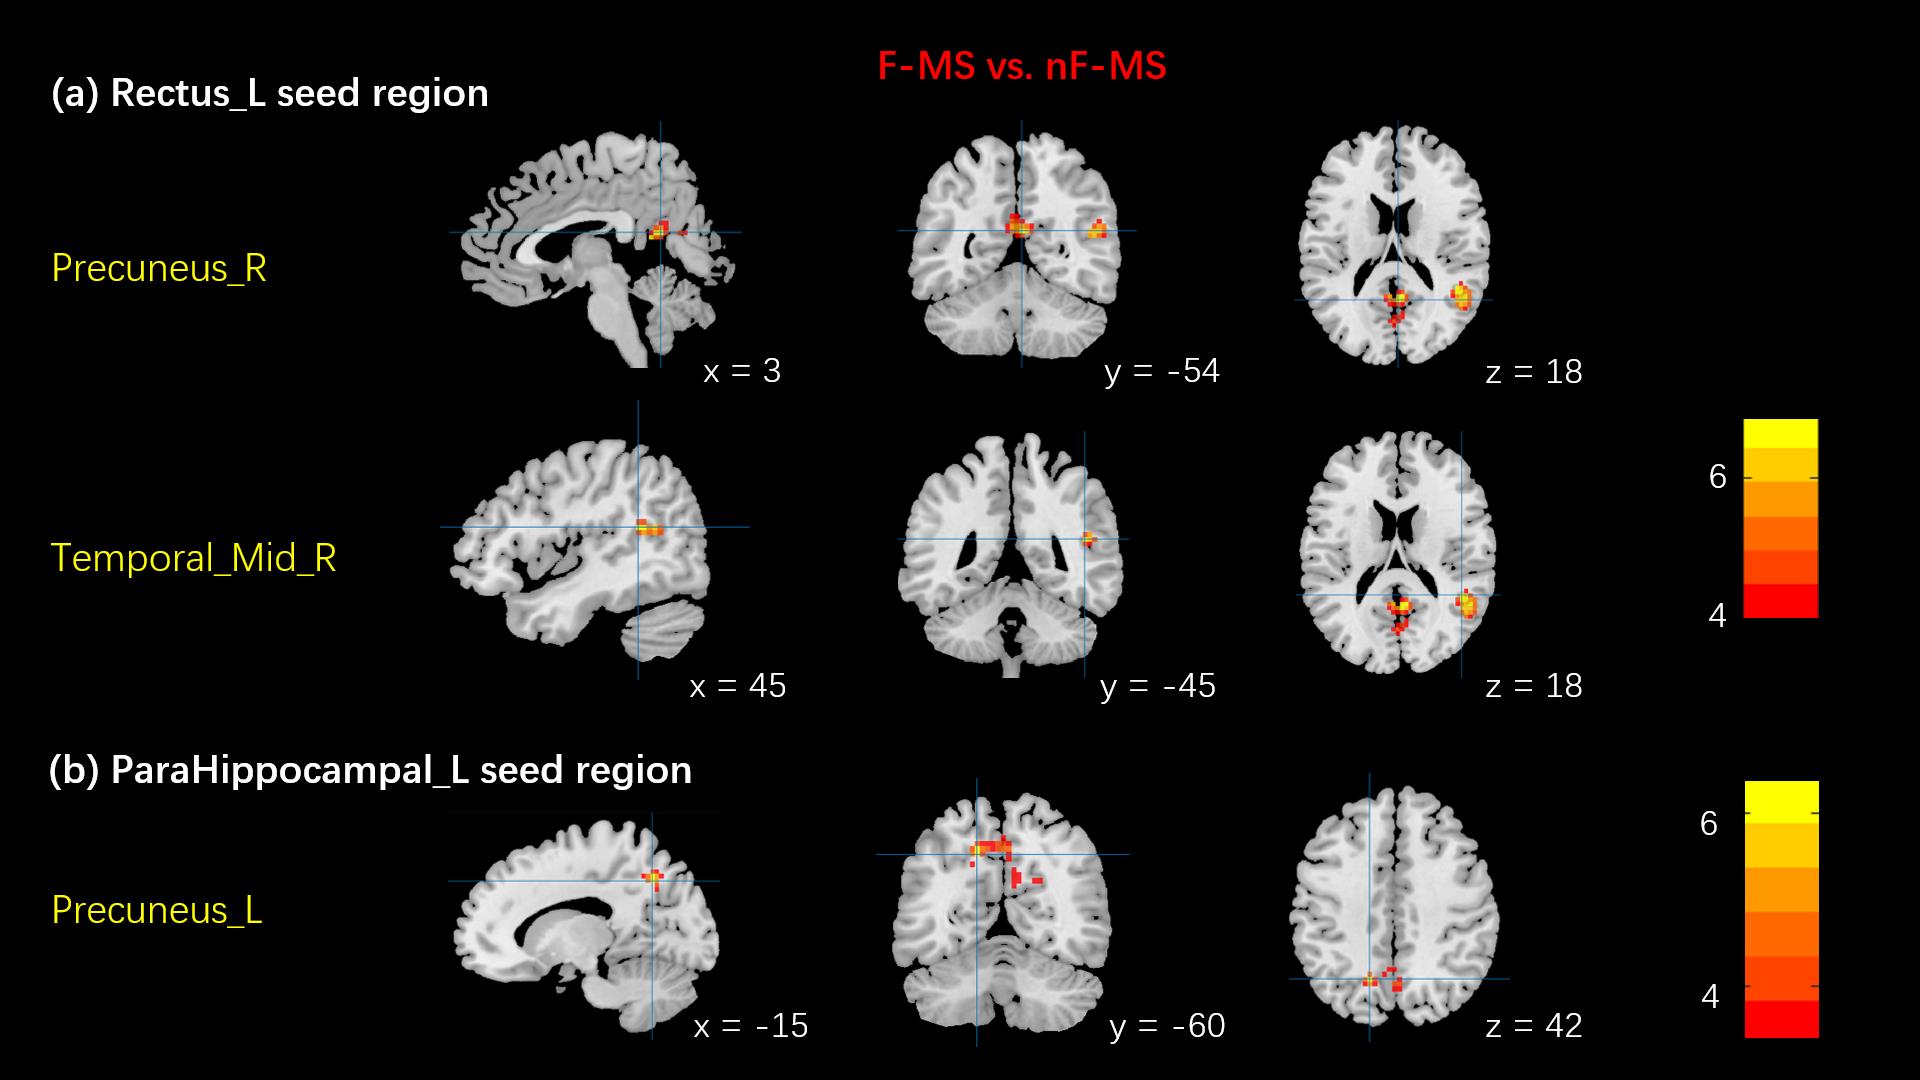
Compared to nF-MS patients, F-MS patients showed increased FC in the right middle temporal gyrus and the right precuneus with the left rectus (two-tailed Voxel P threshold = 0.001, Cluster P threshold = 0.05, Figure 1a). In addition, FC analyses revealed increased FC between the left precuneus and the left parahippocampal in F-MS compared to controls (two-tailed Voxel P Threshold = 0.005, Cluster P Threshold = 0.05, Figure 1b). Besides, no significant correlation between clinical characteristics and brain regions with abnormal FC.Discussion
In this study, we identified several abnormal increased FC regions of the DMN in F-MS compared to nF-MS. Elevated neuronal activity tends to have greater metabolic demand, this is facilitated by a tight coupling between neuronal activity and blood supply6. West K, et al used MRI scans to monitor global Cerebral metabolic rate of oxygen (CMRO2), a measure of oxygen metabolism throughout the brain that reflects resting cellular activity. It indicated higher CMRO2 in MS patients predicts increased fatigue7. Our research shows that the energy supply imbalance in resting states caused by enhanced neuronal activity is associated with MS-fatigue. In addition, fatigue can arise from an increase in the activity of the network, as a result of a compensatory mechanism that allows to maintain normal functioning but also produces fatigue8. The parahippocampal cortex plays an important role in contextual associations elicits activity. The precuneus and the rectus gyri have implications for higher-order cognitive function. Although our study did not show a statistical difference in cognitive function between the two groups, MoCA scores of the F-MS were mostly at normal baseline level (MoCA=26: 5/10) compared to nF-MS (MoCA=26: 1/10). We supposed that in order to maintain cognitive performance, compensatory recruitment of additional regions not usually contributing to a particular task may participate in cognitive function and lead to abnormal FC.Conclusion
Our results indicate that abnormal functional connectivity in brain regions associated with cognitive function within the DMN is a key factor leading to MS-related fatigue. This may contribute to explain the no-motor component of fatigue mechanism in MS and is expected to provide promising neuroimaging biomarkers for distinguishing F-MS from nF-MS. Furthermore, future study will recruit more patients to investigate the correlation between clinical characteristics and brain regions with abnormal FC.Acknowledgements
No acknowledgement found.References
1. Manjaly ZM, Harrison NA, Critchley HD, et al. Pathophysiological and cognitive mechanisms of fatigue in multiple sclerosis. J Neurol Neurosurg Psychiatry. 2019 Jun;90(6):642-651.
2. Høgestøl EA, Nygaard GO, Alnæs D, et al. Symptoms of fatigue and depression is reflected in altered default mode network connectivity in multiple sclerosis. PLoS One. 2019 Apr 1;14(4): e0210375.
3. Jaeger S, Paul F, Scheel M, et al. Multiple sclerosis-related fatigue: Altered resting-state functional connectivity of the ventral striatum and dorsolateral prefrontal cortex. Mult Scler. 2019 Apr;25(4):554-564.
4. Esposito F, Bertolino A, Scarabino T, et al. Independent component model of the default-mode brain function: Assessing the impact of active thinking. Brain Res Bull. 2006 Oct 16;70(4-6):263-9.
5. Herlofson K, Larsen JP. Measuring fatigue in patients with Parkinson's disease - the Fatigue Severity Scale. Eur J Neurol. 2002 Nov;9(6):595-600.
6. Phillips AA, Chan FH, Zheng MM, et al. Neurovascular coupling in humans: Physiology, methodological advances and clinical implications. J Cereb Blood Flow Metab. 2016 Apr;36(4):647-64.
7. West K, Sivakolundu D, Maruthy G, et al. Baseline cerebral metabolism predicts fatigue and cognition in Multiple Sclerosis patients. Neuroimage Clin. 2020;27:102281.
8. Manjaly ZM, Harrison NA, Critchley HD, et al. Pathophysiological and cognitive mechanisms of fatigue in multiple sclerosis. J Neurol Neurosurg Psychiatry. 2019 Jun;90(6):642-651.
Figures