0784
Improving the accuracy of multiple sclerosis classification via robust feature selection based on quantitative tractography1Department of Human Neurosciences, Sapienza University of Rome, Rome, Italy, 2Department of Neurology, Icahn School of Medicine at Mount Sinai, New York, NY, United States, 3Department of Computer Science, University of Verona, Verona, Italy, 4Department of Neuroscience, Rehabilitation, Ophthalmology, Genetics, Maternal and Child Health (DINOGMI), University of Genoa, Genoa, Italy, 5Department of Radiology, Icahn School of Medicine at Mount Sinai, New York, NY, United States, 6IRCCS Ospedale Policlinico San Martino, Genoa, Italy
Synopsis
Improving image-based classification accuracy in multiple sclerosis while characterizing biological relevant features remains an open challenge. To this aim we applied a robust feature selection (FS) procedure based on a leave-one-out cross-validation scheme on structural connectivity features derived from connectomes computed with convex optimization modelling for microstructure informed tractography. We computed classification accuracy for different classifiers (NN, KNN, SVM-LIN, SVM-RBF, RF) before and after the application of the FS procedure. The highest overall accuracy (91%) was obtained using the FS procedure on the whole connectome. The biological meaningfulness of the selected features is supported by their correlations with clinical scores.
Introduction
Although imaging-based machine learning approaches have been widely applied in multiple sclerosis (MS) for classification tasks, the insight they offer on the disease pathophysiology is limited, as the biological features behind individual classification are rarely characterized1-4. When classification is attempted based on biologically meaningful substrates, results are surprisingly unsatisfactory. For example, the only study attempting classification based on brain structural connectivity5 reached a classification accuracy lower than 80%4. This might be due to the known difficulties in accurately tracking streamlines in MS due to the presence of white matter lesions and microstructural damage6, as well as to pitfalls in the feature selection (FS) procedure7, that might fail in extracting the relevant information contained in the connectome. Here, in order to overcome these issues, we classified MS patients according to structural connectivity features derived from quantitative connectomes and selected through a robust FS procedure.Methods
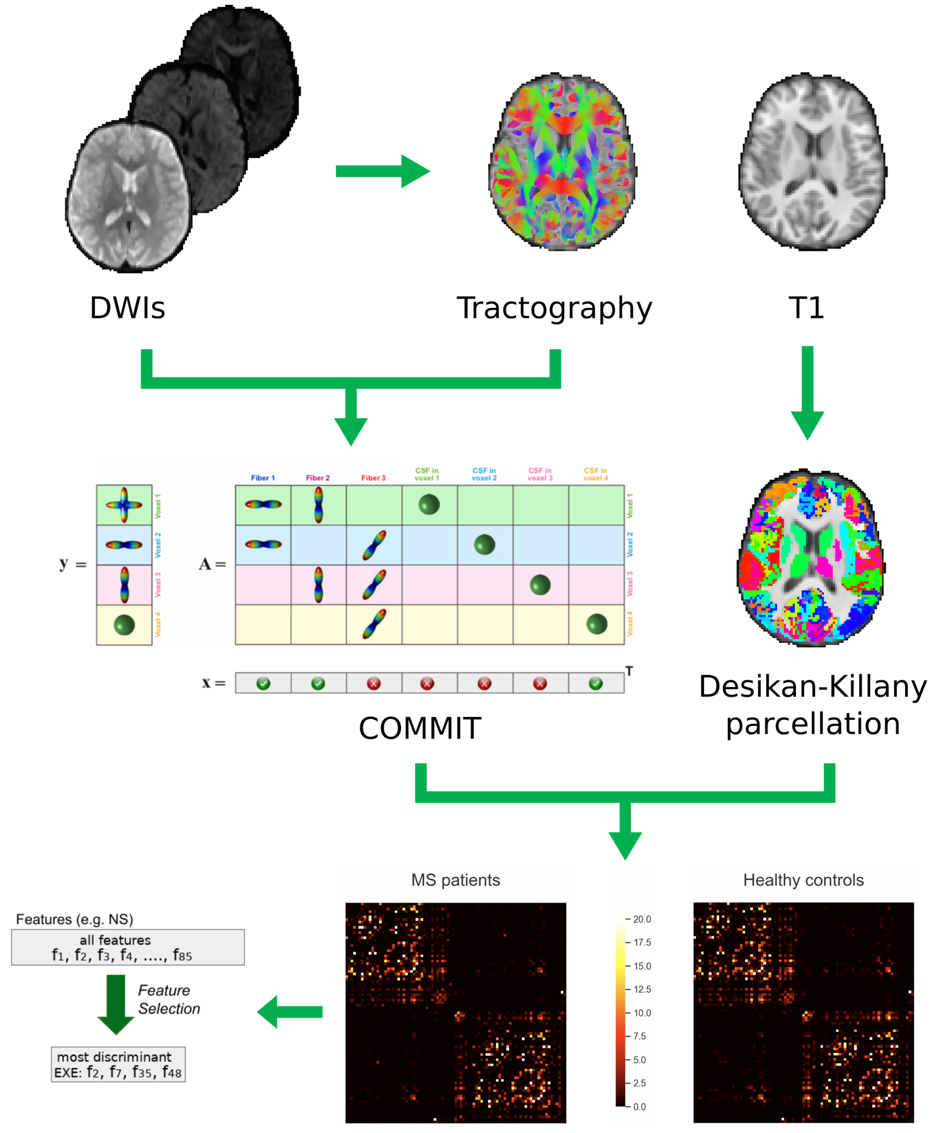
Fifty-five MS patients and twenty-four healthy controls underwent clinical examination and MRI on a Siemens Skyra 3T scanner with a 32-channel head coil. The MRI protocol included the following sequences: axial T2-weighted 3D; sagittal T1-weighted 3D magnetization-prepared rapid gradient echo; twice-refocused spin echo echo-planar imaging sequence for diffusion MRI with b values of 1000 and 2000 s/mm2 and 30 directions each (repeated for both phase acquisitions), in addition to six b=0 images. After lesion filling and cortical parcellation of the T1-weighted images in 85 regions of interest (ROIs)8, state-of-the-art processing steps were conducted on diffusion-weighted images to build the whole brain tractogram9, and the convex optimization modelling for microstructure informed tractography (COMMIT)10,11 was run to assign the intra-axonal signal fraction to each entry of the connectivity matrix and derive a more quantitative structural connectome8. For each node of the connectomes, node’s strength (NS) and local efficiency (LE) were derived using Brain Connectivity Toolbox12. The FS approach described below was then run on the entire set of connections (whole connectome (85x85-85)/2 features), and on the set of NS and LE (85 features each) separately. Our robust FS procedure was based on a leave-one-out (LOO) cross validation scheme13,14, with each feature considered as discriminative only when selected more than 50% of the times. To further increase the robustness of the results, we employed two different feature-selection schemes: LASSO15 and infinite feature selection (IFS)16. Only those features that were selected by both methods were considered as robust for our results. Striving to improve classification accuracy, we tested the LOO cross validation protocol and 5 different classifiers (NN, KNN, SVM-LIN, SVM-RBF and RF). In order to have a comparison with standard analyses, we also computed the accuracy of the different classifiers when applying the “Standard FS” procedure commonly applied in this field17. To confirm the meaningfulness of the selected features, we tested their correlation with clinical scales (bivariate Pearson correlations, Bonferroni corrected for multiple comparisons). Processing steps are summarized in Figure 1.Results
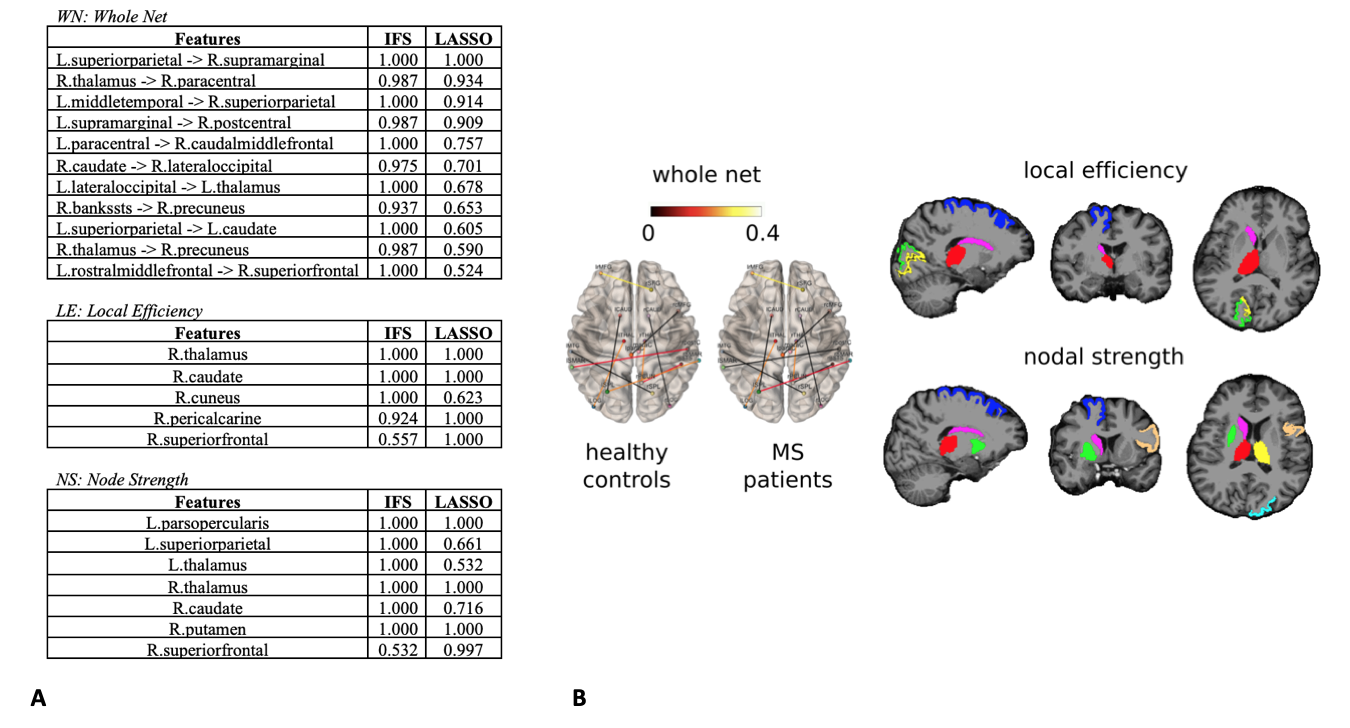
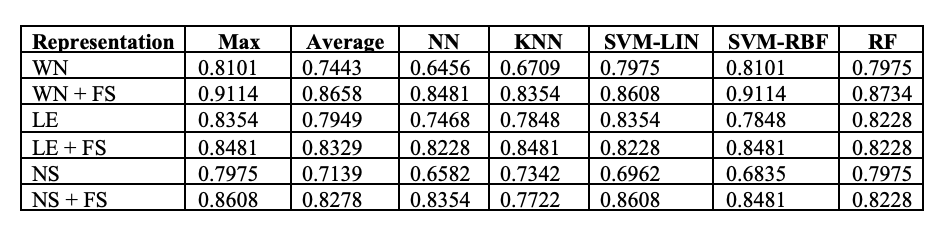
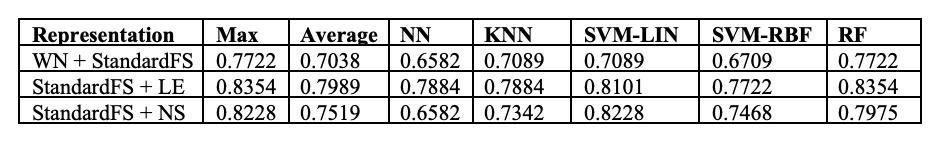
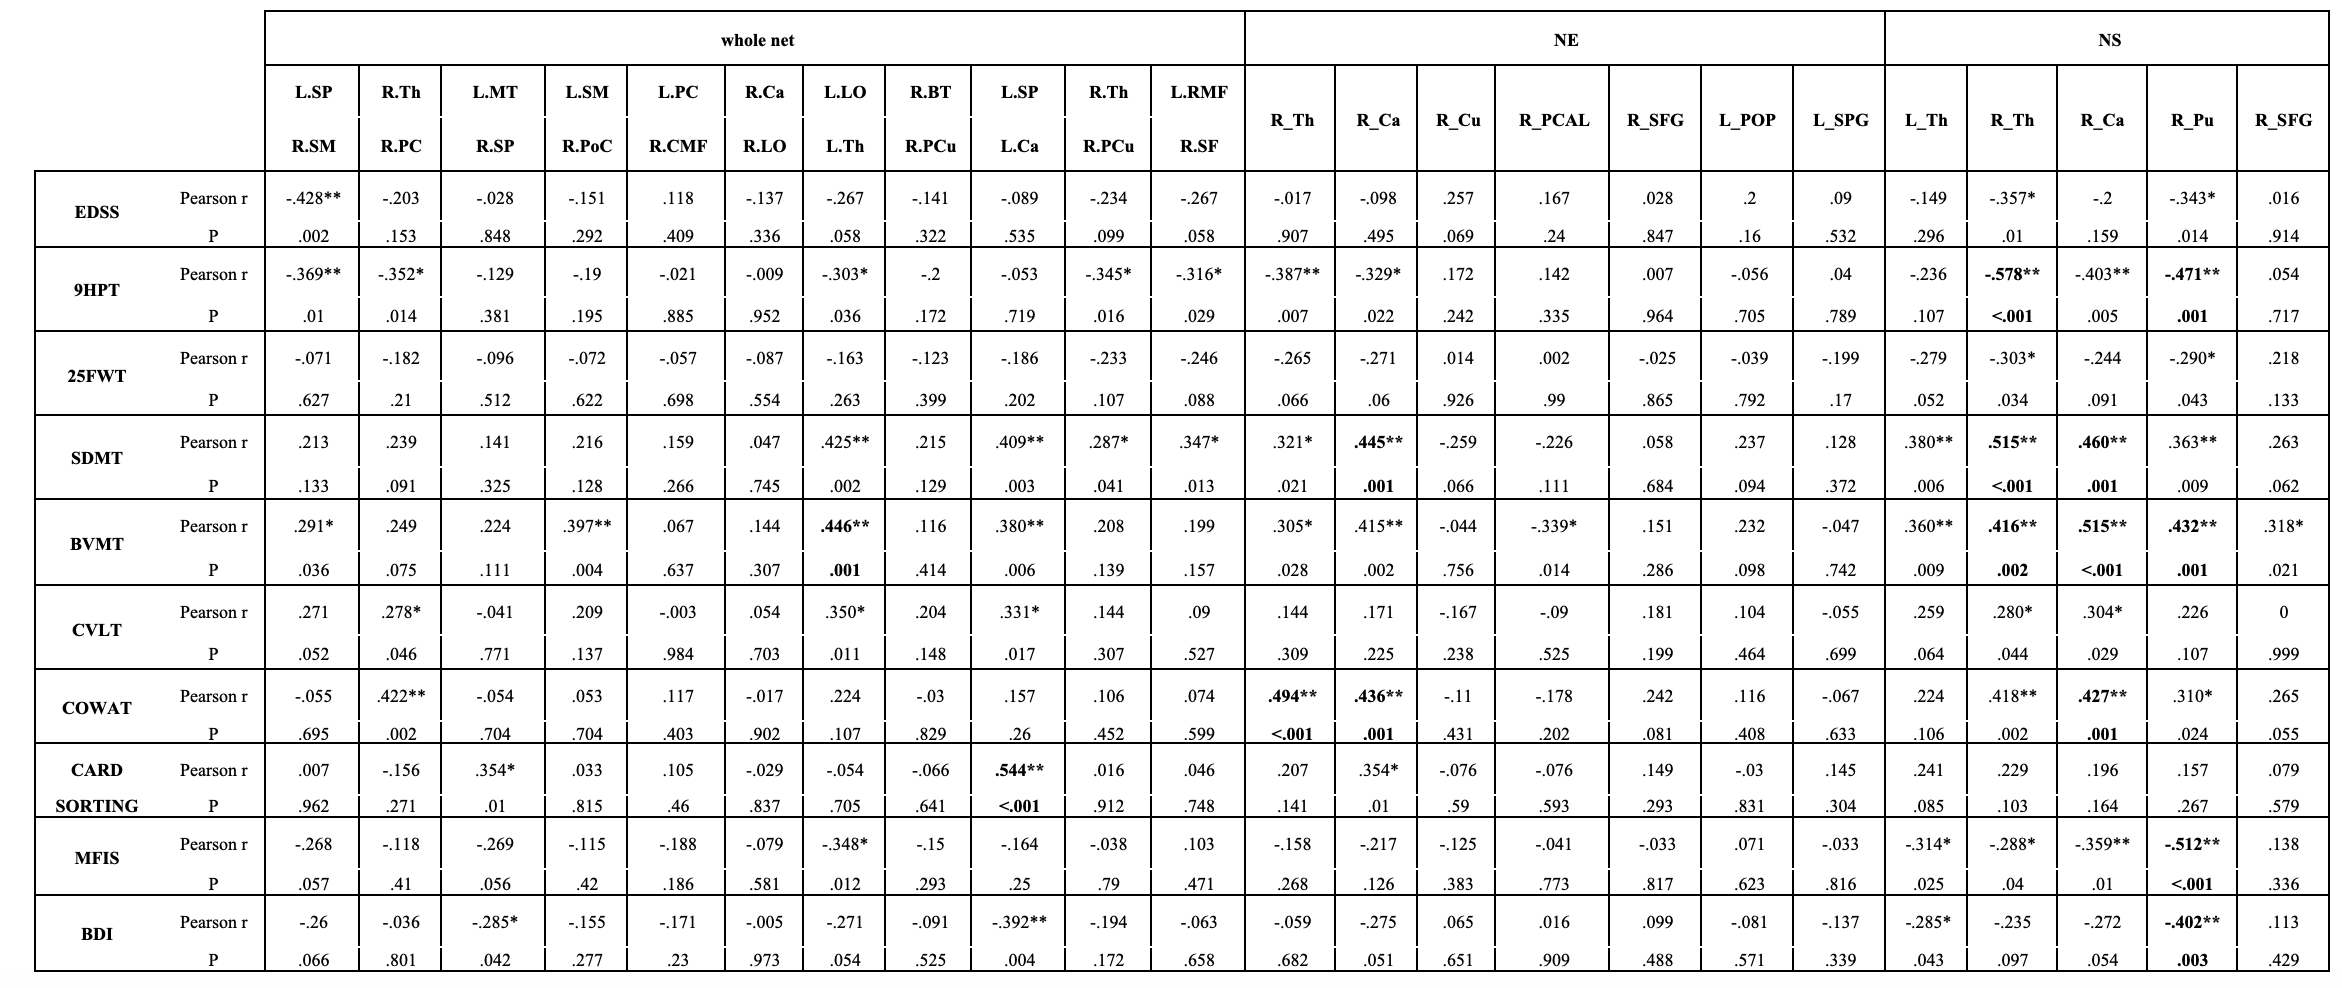
Features selected applying the proposed pipeline are shown in Figure 2. Classification results are shown in Figure 3. In Figure 4 we report the accuracy of the different classifiers applied to the whole connectome processed with Standard FS as well as LE/NS representations derived from the network pre-processed with Standard FS. Correlations between selected features and clinical scores are shown in Figure 5.Discussion
Our FS procedure offers two main advantages: (i) it reduces the dimensionality of the space of features (in our case from 3570 to 11 connections and from 85 nodes’ local properties to 5/7 for node strength and local efficiency respectively); (ii) it offers insights on which white matter tracts and grey matter nodes are more affected by the disease and, likely, represent the substrates of the observed clinical disability. We achieved a higher accuracy when employing the proposed FS methodology than when using the entire set of features (mean accuracy >82% for all tested classifiers), thus confirming the importance of reducing the dimensionality to improve classification. The largest accuracy increments as well as the highest overall accuracy were obtained by using the FS procedure on the whole connectome. This model reached a classification accuracy of 91%, a percentage considerably higher than the ones previously reported by classification works based on connectivity analysis which used diffusion and/or resting state derived features as input3,4. Finally, the standard FS procedure was able to improve the results obtained using all features only when NS was considered. Although this pipeline might be a good alternative compared to whole connectome if we classify using NS, the newly proposed procedure outperforms these results in all the investigated cases. Regarding the biological meaningfulness of the extracted features, those with higher selection percentage at both LASSO and IFS were more consistently associated with clinical scores, confirming that our approach was able to identify relevant indicators of the patients’ clinical status.Conclusions
Applying a robust FS procedure to input data derived from quantitative tractography, we were able to classify MS patients with excellent accuracy, while providing information on the white matter connections and grey matter regions more affected by MS pathology.Acknowledgements
No acknowledgement found.References
1. Rocca MA, Anzalone N, Storelli L, et al. Deep Learning on Conventional Magnetic Resonance Imaging Improves the Diagnosis of Multiple Sclerosis Mimics. Invest Radiol. 2021;56(4):252-260.
2. Yoo Y, Tang LYW, Brosch T, et al. Deep learning of joint myelin and T1w MRI features in normal-appearing brain tissue to distinguish between multiple sclerosis patients and healthy controls. NeuroImage Clin. 2017;17:169-178.
3. Saccà V, Sarica A, Novellino F, et al. Evaluation of machine learning algorithms performance for the prediction of early multiple sclerosis from resting-state FMRI connectivity data. Brain Imaging Behav. 2019;13(4):1103-1114.
4. Zurita M, Montalba C, Labbé T, et al. Characterization of relapsing-remitting multiple sclerosis patients using support vector machine classifications of functional and diffusion MRI data. NeuroImage Clin. 2018;20:724-730.
5. Sporns O, Tononi G, Kötter R. The Human Connectome: A Structural Description of the Human Brain. PLOS Comput Biol. 2005;1(4):e42.
6. Ozturk A, Smith SA, Gordon-Lipkin EM, et al. MRI of the corpus callosum in multiple sclerosis: association with disability. Mult Scler J. 2010;16(2):166-177.
7. Guyon I, Elisseeff A. An introduction to variable and feature selection. Kaelbling LP, ed. J Mach Learn Res. 2003;3(7-8):1157-1182.
8. Schiavi S, Petracca M, Battocchio M, et al. Sensory-motor network topology in multiple sclerosis: Structural connectivity analysis accounting for intrinsic density discrepancy. Hum Brain Mapp. 2020;41(11):2951-2963.
9. Zhang F, Daducci A, He Y, et al. Quantitative mapping of the brain’s structural connectivity using diffusion MRI tractography: a review. 2021. arXiv:2104.11644 [q-bio.QM]
10. Daducci A, Dal Palu A, Lemkaddem A, Thiran JP. A convex optimization framework for global tractography. In: Proceedings - International Symposium on Biomedical Imaging. 2013.
11. Daducci A, Canales-Rodríguez EJ, Zhang H, Dyrby TB, Alexander DC, Thiran J-P. Accelerated Microstructure Imaging via Convex Optimization (AMICO) from diffusion MRI data. Neuroimage. 2015;105:32-44.
12. Rubinov M, Sporns O. Complex network measures of brain connectivity: Uses and interpretations. Neuroimage. 2010;52(3):1059-1069.
13. Friedman J, Hastie T, Tibshirani R. The Elements of Statistical Learning. Vol 1. Springer series in statistics New York; 2001.
14. Kuncheva LI. A stability index for feature selection. In: Proceedings of the IASTED International Conference on Artificial Intelligence and Applications, AIA 2007.
15. Tibshirani R. Regression Shrinkage and Selection via the Lasso. J R Stat Soc Ser B. 1996;58(1):267-288.
16. Roffo G, Melzi S, Castellani U, Vinciarelli A, Cristani M. Infinite Feature Selection: a Graph-based Feature Filtering Approach. IEEE Trans Pattern Anal Mach Intell. 2020.
17. Buchanan CR, Bastin ME, Ritchie SJ, et al. The effect of network thresholding and weighting on structural brain networks in the UK Biobank. Neuroimage. 2020;211:116443.
Figures