0781
Microvascular Morphology Alteration Using Relaxation Rate Change with Gd-based MRI Contrast Agent in the Patient with Alzheimer’s Disease1Radiology, Kyung Hee University Hospital at Gangdong, Seoul, Korea, Republic of, 2Medicine, Kyung Hee University, Seoul, Korea, Republic of, 3Neurology, Kyung Hee University Hospital at Gangdong, Seoul, Korea, Republic of, 4Psychiatry, Kyung Hee University Hospital at Gangdong, Seoul, Korea, Republic of
Synopsis
To assess the cerebral microvascular alteration in the demented patients relative to a non-demented population using in vivo microvascular index maps by using Gd-based contrast agent at a 3T MRI system, we included 11 non-demented participants and 11 AD patients. Compared with the non-demented group, BVf and MvWI were significantly increased in the demented group. Both mVD and VSI were only significantly decreased in the demented group at the white matter hyperintensity (WMHI) area. BVf and MvWI were significantly positively correlated with age and VSI was significantly positively correlated with MMSE.
Background
Conventional MRI techniques do not demonstrate the microvascular alterations in mild and moderate Alzheimer’s disease (AD) and therefore, the diagnosis of microvascular pathology commonly relies on postmortem. Mapping of transverse relaxation rate differences between before and after injection of a contrast agent, and was applied to map the microvessel structures in the brain tumors (1), brain ischemic stroke (2), AD (3), and vascular dementia (4). Except for our recently published paper which was used in Gadolinium (Gd)-based contrast agent (4), most of the previous studies were performed using intravascular super-paramagnetic (SPION) contrast agents. Therefore, although these relaxation rate differences as well as the microvascular indices can provide useful quantitative metrics of in vivo vascular morphology (5), it should be beneficial to use a clinically approved contrast agent to directly apply in clinics.Purpose
Despite its potential in the assessment of microvascular pathology, to our knowledge, microvascular imaging has not been addressed in the diagnosis of AD in humanity. Therefore, the objective of this study was to assess the cerebral microvascular alteration in the demented patients relative to a non-demented population using in vivo microvascular index maps by using a Gd-based contrast agent at a 3T MRI system.Methods
Participants: Both 4 cognitively normal (CN) and 7 amnestic mild cognitive impairment (aMCI) subjects were defined as the non-demented group (non-demented) and 8 mild AD and 3 moderate AD patients were defined as the demented group (demented). Therefore, a total of 22 participants were included in this study.MRI acquisition: MRI data were acquired using a 3T scanner (Ingenia, Philips Healthcare, The Netherlands) in all participants. to map microvascular indices, a multi-echo (ME) turbo-spin-echo (TSE) sequence was scanned to calculate the R2 relaxation rates before and after contrast injection. Furthermore, a multi-echo gradient-echo (GRE) sequence was also run to calculate the R2* relaxation rates before and after contrast injection.
Imaging processing: The voxel-based R2* relaxation rates before (preR2*) and after (postR2*) contrast agent were calculated by fitting the exponential decay curves from multi-echo GRE images. ΔR2 was calculated by using the signal ratio before and after contrast injection obtained from multi-echo TSE images, which was proposed by Tropres et. al (6). The microvascular indices were mapped as the vessel size index (VSI), mean vessel diameter (mVD), microvascular density (Q) (7), blood volume fraction (BVf) (8), and microvessel-weighted imaging (MvWI) (9).
Statistical analyses: The two-sample t-test was used to compare those values between the groups. The correlation analysis was performed to evaluate the relationship between those values and the mini-mental state examination (MMSE) score.
Results
Compared with the non-demented group, BVf was significantly increased in the demented group at parahippocampal gyrus (p=0.033), gray matter area (p=0.008), and white matter area (p=0.010). MvWI was also significantly increased in the demented group at hippocampus (p=0.010), parahippocampal gyrus (p=0.010), presuneus (p=0.045), and globus pallidus (p=0.008). Both mVD and VSI were only significantly decreased in the demented group at the white matter hyperintensity (WMHI) area (p= 0.045 with mVD; p= 0.033 with VSI).BVf and MvWI were significantly positively correlated with age at some areas. VSI was significantly positively correlated with MMSE at caudate (rho= 0.475/ P=0.030) and corpus callosum (rho= 0.435/ P=0.049).
Conclusion
This is the first study to evaluate the cerebral microvascular alterations in Alzheimer's disease using the microvascular indices obtained with the relaxation rate difference before and after injection of the Gd-based contrast agent at 3T clinical MRI. We found that Q and MvWI increased in the demented patients and VSI in the caudate and corpus callosum positively correlated with the MMSE score, and BVf in the WMHI area was significantly decreased in the demented participants. We concluded that some microvascular indices may be used as an imaging biomarker to evaluate the alteration of the brain microstructure in AD. However, it is required to additional studies with a relatively large sample size.Acknowledgements
The research was supported by the Basic Science Research Program through the National Research Foundation of Korea (NRF) funded by the grant by the Korean Health Technology R&D Project, Ministry of Education, Republic of Korea [2016R1D1A1B03930720, G.H.J.] and the grant funded by the Ministry of Science, Republic of Korea [2020R1A2C100474912, G.H.J.].References
1.Farrar, C.T., et al., Neuro Oncol 2010;12, 341-350. 2.Kang, M., et al., Sci Rep 2020;10, 4989. 3.Zerbi, V., et al., Brain Struct Funct, 2013. 218(5): p. 1085-98. 4.Choi, H.-I., et al., Frontiers in Neurology 2020; 11, 1302. 5.Dennie, J., et al., Magn Reson Med 1998; 40, 793-799. 6.Tropres, I., et al., Magn Reson Med 2015;73, 325-341. 7.Xu, X., et al., Aging (Albany NY) 2020;12, 17224-17234. 8.Lemasson, B., et al., NMR Biomed 2011;24, 473-482. 9.Jung, H.S., et al., NMR Biomed 2016;29, 690-701.Figures
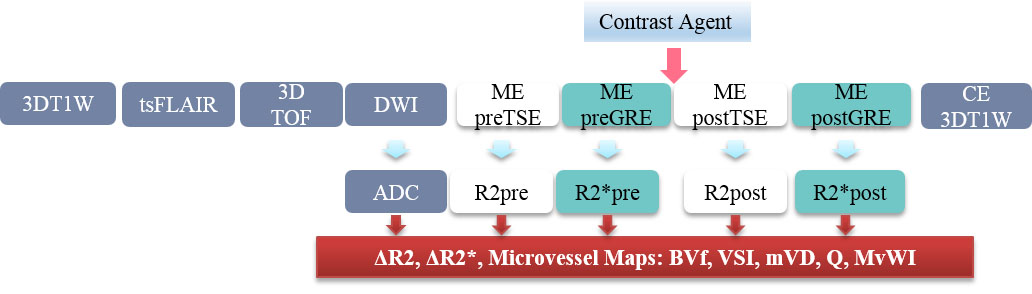
Figure 1. Scan protocol and imaging acquisition sequences
ME preSE, multi-echo (ME) spin-echo (SE) imaging before injection of contrast agent to map preR2 (relaxation rate); ME preGE, multi-echo gradient-echo (GE) imaging before injection of contrast agent to map preR2*; CE, contrast enhancement using Gd-based contrast agent (Gadovist, Bayer Schering Pharma AG, Berlin, Germany); R2 and R2* and ADC maps were calculated to map blood volume fraction (BVf), vessel size index (VSI), mean vessel diameter (mVD), mean vessel density (Q), and microvessel-weighted imaging (MvWI).