0780
Multimodal lesion characterization in multiple sclerosis: a pilot study1Department of Neuroscience, Rehabilitation, Ophthalmology, Genetics, Maternal and Child Health (DINOGMI), University of Genoa, Genoa, Italy, 2Advanced Clinical Imaging Technology, Siemens Healthcare AG, Lausanne, Switzerland, 3Department of Radiology, Lausanne University Hospital and University of Lausanne, Lausanne, Switzerland, 4LTS5, Ecole Polytechnique Fédérale de Lausanne (EPFL), Lausanne, Switzerland, 5HNSR, IRRCS Ospedale Policlinico San Martino, Genoa, Italy, 6Siemens Healthcare s.r.l, Milan, Italy, Milan, Italy, 7Department of Neuroradiology, IRCCS Ospedale Policlinico San Martino, Genoa, Italy, 8Dipartimento di Scienze della Salute (DISSAL), University of Genoa, Genoa, Italy, 9IRCCS Ospedale Policlinico San Martino, Genoa, Italy
Synopsis
Using a comprehensive multimodal quantitative MRI protocol, we study the relationships between different microstructural metrics inside lesional tissue and investigate the heterogeneous pathological processes underlying alterations visible as hyperintense plaques in FLAIR images. Our preliminary results suggest that, although all the metrics can detect differences between lesions and normal appearing white matter, not all are directly associated with clinical status. Moreover, many metrics are intercorrelated and should not be considered as independent information when analyzing clinical outcomes. Understanding the clinical value of these parameters can advance the understanding of complex microstructural processes in neurological diseases and informs MRI protocol designs.
Introduction
Multiple Sclerosis (MS) is a chronic inflammatory disease that is characterized by a broad spectrum of pathological processes including inflammation, demyelination, axonal loss, oedema and remyelination1–5. Thus, a multimodal MRI approach rather than using only one quantitative sequence in addition to standard T1, T2-weighted or FLAIR images is needed to better capture the heterogeneity of tissue alterations and obtain a more complete picture of the disease6. However, some measures might be correlated and give approximately the same information, so detecting which parameter provides complementary data is useful to design time- and information-efficient protocols7. In this pilot study, we set up a protocol which incorporates T1 and T2 mapping as well as multi-shell diffusion MRI (dMRI) to investigate the relationships between the microstructural metrics and assess their clinical relevance.Methods
Fifteen subjects with various MS course (10 female, aged 44.6±11.1, 9 relapsing-remitting, 5 progressive) were scanned at 3T (MAGNETOM Prisma, Siemens Healthcare, Erlangen, Germany) using the following sequences: 3D FLAIR (TR/TE/TI=5000/393/1800ms, resolution 0.4x0.4x1mm3, TA=6’37”); prototype 4.6x accelerated compressed sensing MP2RAGE8 (TR/TE/TI1/TI2= 5000/2.9/700/2500ms, resolution 1x1x1mm3, TA=3’40”); prototype mcGRASE9 (TR=1000ms, 32 TE in [10.36,331.52]ms, resolution 1.8x1.8x1.8mm3, CAIPIRINHA10 3x2, TA=9’39”); multi-shell dMRI with 107 directions and b-value up to 3000s/mm2 (TR/TE=4600/75ms, resolution 1.8x1.8x1.8mm3, TA=8’58”) and 12 measurements of b-value 0s/mm2 with reversed phase encoding.Figure 1 illustrates the native and derived images obtained from the protocol. FLAIR-hyperintense lesions were manually segmented using user-supervised local thresholding (Jim 7.0), while WM masks were obtained using the SPM11 CAT1212 toolbox and removing subcortical nuclei segmented through FIRST13. From the quantitative sequences, we derived the following metrics: averaged T1 and T1 z-scores14 from MP2RAGE; averaged T2 of intra+extra axonal space (T2_IE), myelin, intra+extra axonal and free water fractions (MWF, IEWF and FWF) from mcGRASE15. DMRIs were pre-processed using a combination of FSL16 and MRtrix317 following these steps: denoising18, removal of movement artifacts and susceptibility induced distortions19–21, N4-bias correction22.
We subsequently extracted intra-cellular and isotropic signal fractions (ICVF and ISOVF) and orientation dispersion index (OD) of the neurites orientation dispersion and density image (NODDI)23 model using AMICO24 as well as intra-axonal diffusivity (SMT-diff) and signal fraction (SMT-intra), mean and transversal diffusivities (SMT-extramd and SMT-extratrans) of multicompartment spherical mean technique (SMT)25 using Kaden’s official toolbox. Finally, lesions and normal appearing white matter (NAWM) masks were rigidly registered26,27 on each metric specific space to extract mean values of each of them.
Statistical tests were carried out using SPSS. We first evaluated if all the microstructural metrics were able to distinguish between the segmented lesions and NAWM tissues through a generalized linear model for repeated measures using age, sex, and phenotype as confounding factors. Then, we investigated the relationship between metrics inside lesions via linear regression. Finally, we assessed the relationship of each microstructural metric with the expanded disability status score (EDSS) through partial correlations accounting for age, sex, and phenotype as confounding factors.
Results and Discussion
Table 1 reports the metric comparisons of NAWM vs. intra-lesional regions. Although our sample is composed of 15 subjects, all metrics exhibit significant differences between the two tissues. Moreover, all of them except IEWF and SMT-diff are still significant after Bonferroni corrections (p<0.05/13=0.0038). We thereby observe higher ICVF, OD, SMT-intra and MWF as well as lower ISOVF, SMT-extramd, SMT-extratrans, FWF, T2_IE, T1 and T1 z-scores in NAWM compared to lesioned tissue. This is in line with the understanding that lesion tissue has more free water and fewer axons than NAWM.In Figure 2 and Table 3, we report a summary of the relationships between microstructural metrics inside lesions. We do not show the intra-model relationships as they are not informative. As we analyzed 530 lesions, R2<0.3 was interpreted as a mild association, 0.3<R2<0.5 medium and R2>0.5 strong according to Cohen’s guidelines to account for effect size28. We found that an increase of FWF is related to increase in ISOVF, T1 values, SMT-extramd and SMT-extratrans diffusivities; increase in MWF is related to increase in ICVF and SMT-intra; T2_IE positively correlates with SMT-extratrans diffusivity; decrease of T1 values are related to increase in ICVF and SMT-intra and increase in SMT-extratrans diffusivity. Moreover, looking only at dMRI metrics, we observed the expected relationships between ICVF and SMT-diff, SMT-extratrans and SMT-intra as well as ISOVF and SMT-extramd and SMT-extratrans diffusivities. Interestingly, T1 z-scores were not associated with other metrics, highlighting the complementary information obtained with this method. In Figure 2, we color-coded the points by phenotype, and we used different symbols for different subjects; however, no clusters were apparent at visual inspection, suggesting that those relationships alone can neither distinguish between phenotypes nor identify single subjects.
Table 3 reports the results of partial correlations between EDSS, and the metrics computed in lesions and NAWM. Interestingly, in this small dataset, only T1 z-scores showed statistically significant association with the clinical metric in both tissues, confirming the utility of this technique for personalized detection and characterization of brain pathology.
Conclusions
Our preliminary results indicate that all studied metrics can detect differences between lesions and NAWM and may be proved useful to characterize pathology and guide therapy. Some of them are intercorrelated and should not be considered as independent when analyzing clinical outcomes.Acknowledgements
No acknowledgement found.References
1. D. TB, John P, M. RR, Richard R, Sverre M, Lars B. Axonal Transection in the Lesions of Multiple Sclerosis. N Engl J Med. 1998;338(5):278-285. doi:10.1056/NEJM199801293380502
2. Evangelou N, Konz D, Esiri MM, Smith S, Palace J, Matthews PM. Regional axonal loss in the corpus callosum correlates with cerebral white matter lesion volume and distribution in multiple sclerosis. Brain. 2000;123 ( Pt 9:1845-1849.
3. Evangelou N, Esiri MM, Smith S, Palace J, Matthews PM. Quantitative pathological evidence for axonal loss in normal appearing white matter in multiple sclerosis. Ann Neurol. 2000;47(3):391-395. doi:10.1002/1531-8249(200003)47:3<391::AID-ANA20>3.0.CO;2-J
4. Lassmann H, Brück W, Lucchinetti C. Heterogeneity of multiple sclerosis pathogenesis: implications for diagnosis and therapy. Trends Mol Med. 2001;7(3):115-121. doi:https://doi.org/10.1016/S1471-4914(00)01909-2
5. Lassmann H. Multiple Sclerosis Pathology. Cold Spring Harb Perspect Med. 2018;8(3). doi:10.1101/cshperspect.a028936
6. Granziera C, Wuerfel J, Barkhof F, et al. Quantitative magnetic resonance imaging towards clinical application in multiple sclerosis. Brain. 2021;144(5):1296-1311. doi:10.1093/brain/awab029
7. Lu PJ, Barakovic M, Weigel M, et al. GAMER-MRI in Multiple Sclerosis Identifies the Diffusion-Based Microstructural Measures That Are Most Sensitive to Focal Damage: A Deep-Learning-Based Analysis and Clinico-Biological Validation. Front Neurosci. 2021. doi:10.3389/fnins.2021.647535
8. Mussard E, Hilbert T, Forman C, Meuli R, Thiran JP, Kober T. Accelerated MP2RAGE imaging using Cartesian phyllotaxis readout and compressed sensing reconstruction. Magn Reson Med. 2020. doi:10.1002/mrm.28244
9. Piredda GF, Hilbert T, Canales-Rodríguez EJ, et al. Fast and high-resolution myelin water imaging: Accelerating multi-echo GRASE with CAIPIRINHA. Magn Reson Med. 2021. doi:10.1002/mrm.28427
10. Breuer FA, Blaimer M, Mueller MF, et al. Controlled aliasing in volumetric parallel imaging (2D CAIPIRINHA). Magn Reson Med. 2006. doi:10.1002/mrm.20787
11. Ashburner J. SPM: A history. Neuroimage. 2012;62(2):791-800. doi:https://doi.org/10.1016/j.neuroimage.2011.10.025
12. Gaser, C., Dahnke R. CAT-a computational anatomy toolbox for the analysis of structural MRI data. HBM. 2016:336–348.
13. Patenaude B, Smith SM, Kennedy DN, Jenkinson M. A Bayesian model of shape and appearance for subcortical brain segmentation. Neuroimage. 2011. doi:10.1016/j.neuroimage.2011.02.046
14. Piredda GF, Hilbert T, Granziera C, et al. Quantitative brain relaxation atlases for personalized detection and characterization of brain pathology. Magn Reson Med. 2020;83(1):337-351. doi:https://doi.org/10.1002/mrm.27927
15. Canales-Rodríguez EJ, Pizzolato M, Piredda GF, et al. Comparison of non-parametric T2 relaxometry methods for myelin water quantification. Med Image Anal. 2021;69:101959. doi:https://doi.org/10.1016/j.media.2021.101959
16. Smith SM, Jenkinson M, Woolrich MW, et al. Advances in functional and structural MR image analysis and implementation as FSL. In: NeuroImage. ; 2004. doi:10.1016/j.neuroimage.2004.07.051
17. Tournier J-D, Smith R, Raffelt D, et al. MRtrix3: A fast, flexible and open software framework for medical image processing and visualisation. Neuroimage. 2019;202:116137. doi:https://doi.org/10.1016/j.neuroimage.2019.116137
18. Cordero-Grande L, Christiaens D, Hutter J, Price AN, Hajnal J V. Complex diffusion-weighted image estimation via matrix recovery under general noise models. Neuroimage. 2019. doi:10.1016/j.neuroimage.2019.06.039
19. Andersson JLR, Graham MS, Zsoldos E, Sotiropoulos SN. Incorporating outlier detection and replacement into a non-parametric framework for movement and distortion correction of diffusion MR images. Neuroimage. 2016;141:556-572. doi:https://doi.org/10.1016/j.neuroimage.2016.06.058
20. Andersson JLR, Sotiropoulos SN. An integrated approach to correction for off-resonance effects and subject movement in diffusion MR imaging. Neuroimage. 2016;125:1063-1078. doi:10.1016/J.NEUROIMAGE.2015.10.019
21. Andersson JLR, Skare S, Ashburner J. How to correct susceptibility distortions in spin-echo echo-planar images: application to diffusion tensor imaging. Neuroimage. 2003;20(2):870-888. doi:https://doi.org/10.1016/S1053-8119(03)00336-7
22. Tustison NJ, Avants BB, Cook PA, et al. N4ITK: improved N3 bias correction. IEEE Trans Med Imaging. 2010;29(6):1310-1320. doi:10.1109/TMI.2010.2046908
23. Zhang H, Schneider T, Wheeler-Kingshott CA, Alexander DC. {NODDI}: {P}ractical in vivo neurite orientation dispersion and density imaging of the human brain. Neuroimage. 2012;61(4):1000-1016. doi:http://dx.doi.org/10.1016/j.neuroimage.2012.03.072
24. Daducci A, Canales-Rodríguez EJ, Zhang H, Dyrby TB, Alexander DC, Thiran J-P. Accelerated Microstructure Imaging via Convex Optimization (AMICO) from diffusion MRI data. Neuroimage. 2015;105:32-44. doi:http://dx.doi.org/10.1016/j.neuroimage.2014.10.026
25. Kaden E, Kelm ND, Carson RP, Does MD, Alexander DC. Multi-compartment microscopic diffusion imaging. Neuroimage. 2016;139:346-359. doi:https://doi.org/10.1016/j.neuroimage.2016.06.002
26. Greve DN, Fischl B. Accurate and robust brain image alignment using boundary-based registration. Neuroimage. 2009;48(1):63-72. doi:https://doi.org/10.1016/j.neuroimage.2009.06.060
27. Jenkinson M, Bannister P, Brady M, Smith S. Improved Optimization for the Robust and Accurate Linear Registration and Motion Correction of Brain Images. Neuroimage. 2002;17(2):825-841. doi:https://doi.org/10.1006/nimg.2002.1132
28. Cohen J. Statistical Power Analysis for the Behavioural Sciences (2nd Ed.). New York: Lawrence Erlbaum. In: Statistical Power Anaylsis for the Behavioural Science (2nd Edition). ; 1988.
Figures
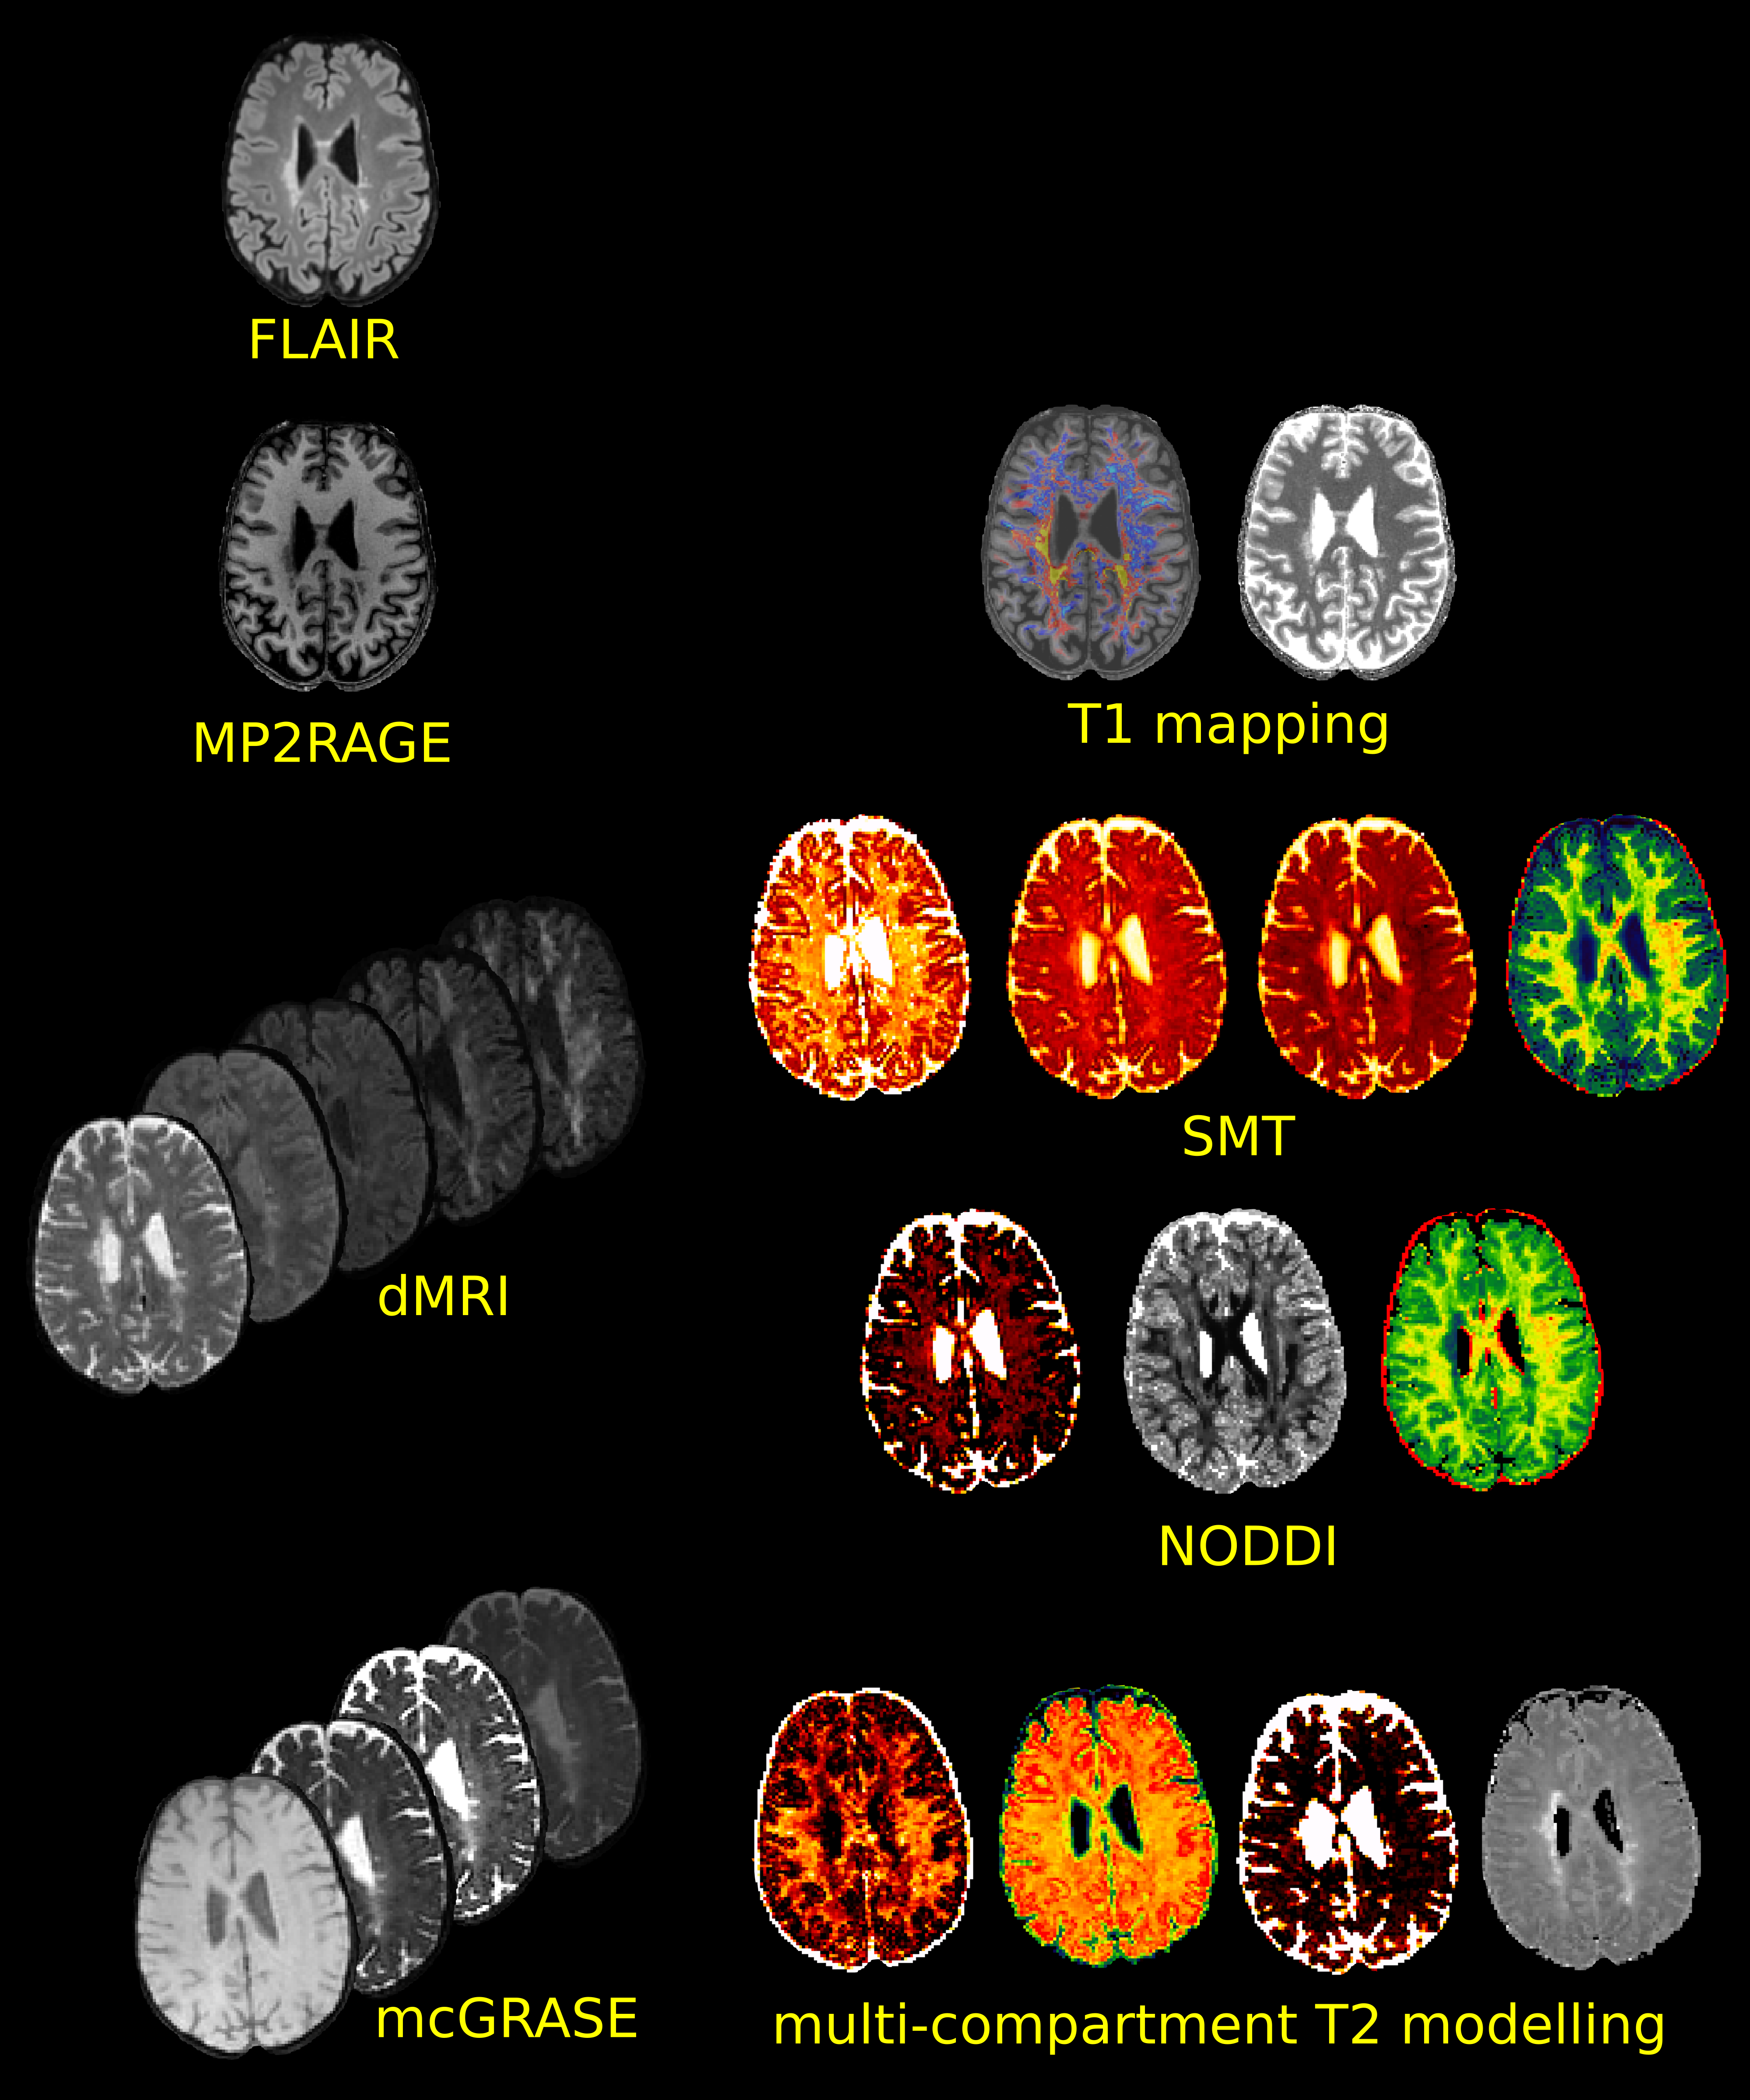
Figure 1: Acquired images on the left and reconstructed microstructural maps used in our protocol. FLAIR images served for lesions segmentation; MP2RAGE to derive averaged T1 and T1 z-scores maps, dMRIs to fit the NODDI and SMT models; mcGRASE to derive myelin, free water and intra+extra axonal water fraction maps as well as averaged intra+extra axonal T2 using multi-compartment T2 modelling.

Table 1: Results of generalised Linear Model for repeated measures accounting for age, sex and phenotype as confounding factor. Statistically significant results after Bonferroni correction are highlighted in bold.
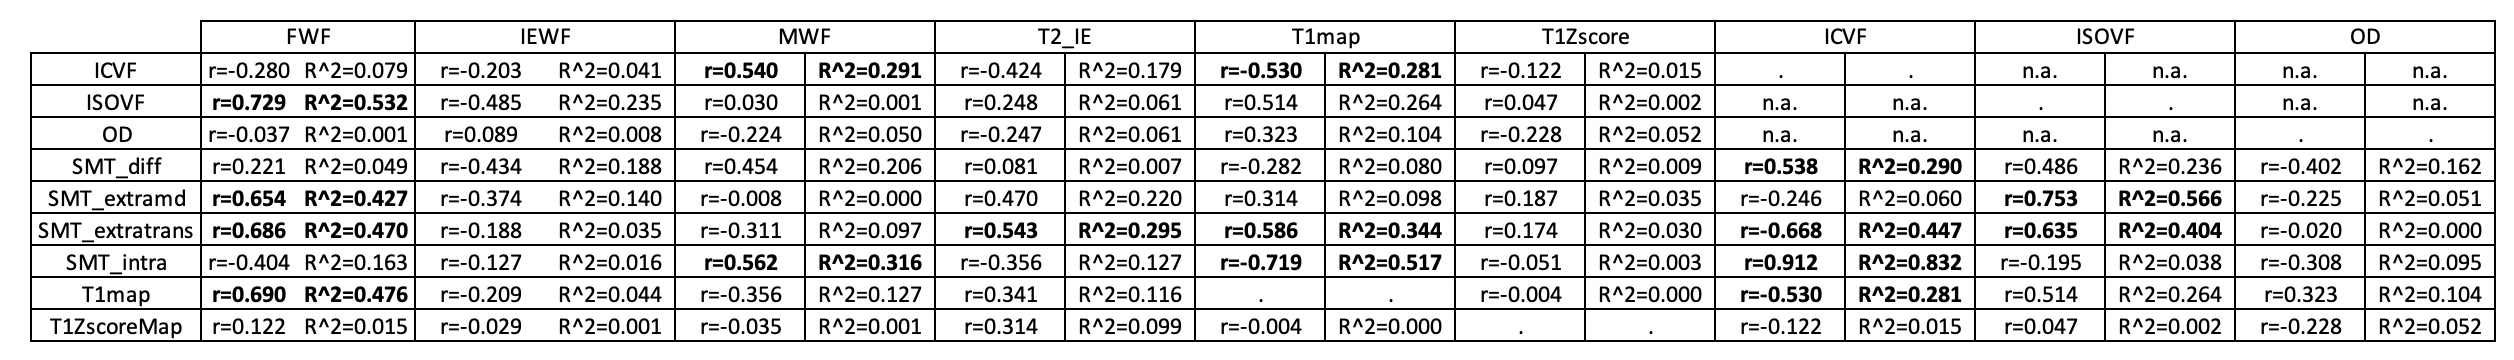
Table 2: Summary of the regression results to identify associations between the microstructural metrics of different models. For each entry, r is the Pearson’s coefficient and R^2=r2. Values highlighted in bold are those resulted in medium or strong association accounting for Cohen’s effect size and are also shown as scatter plots in Figure 2.
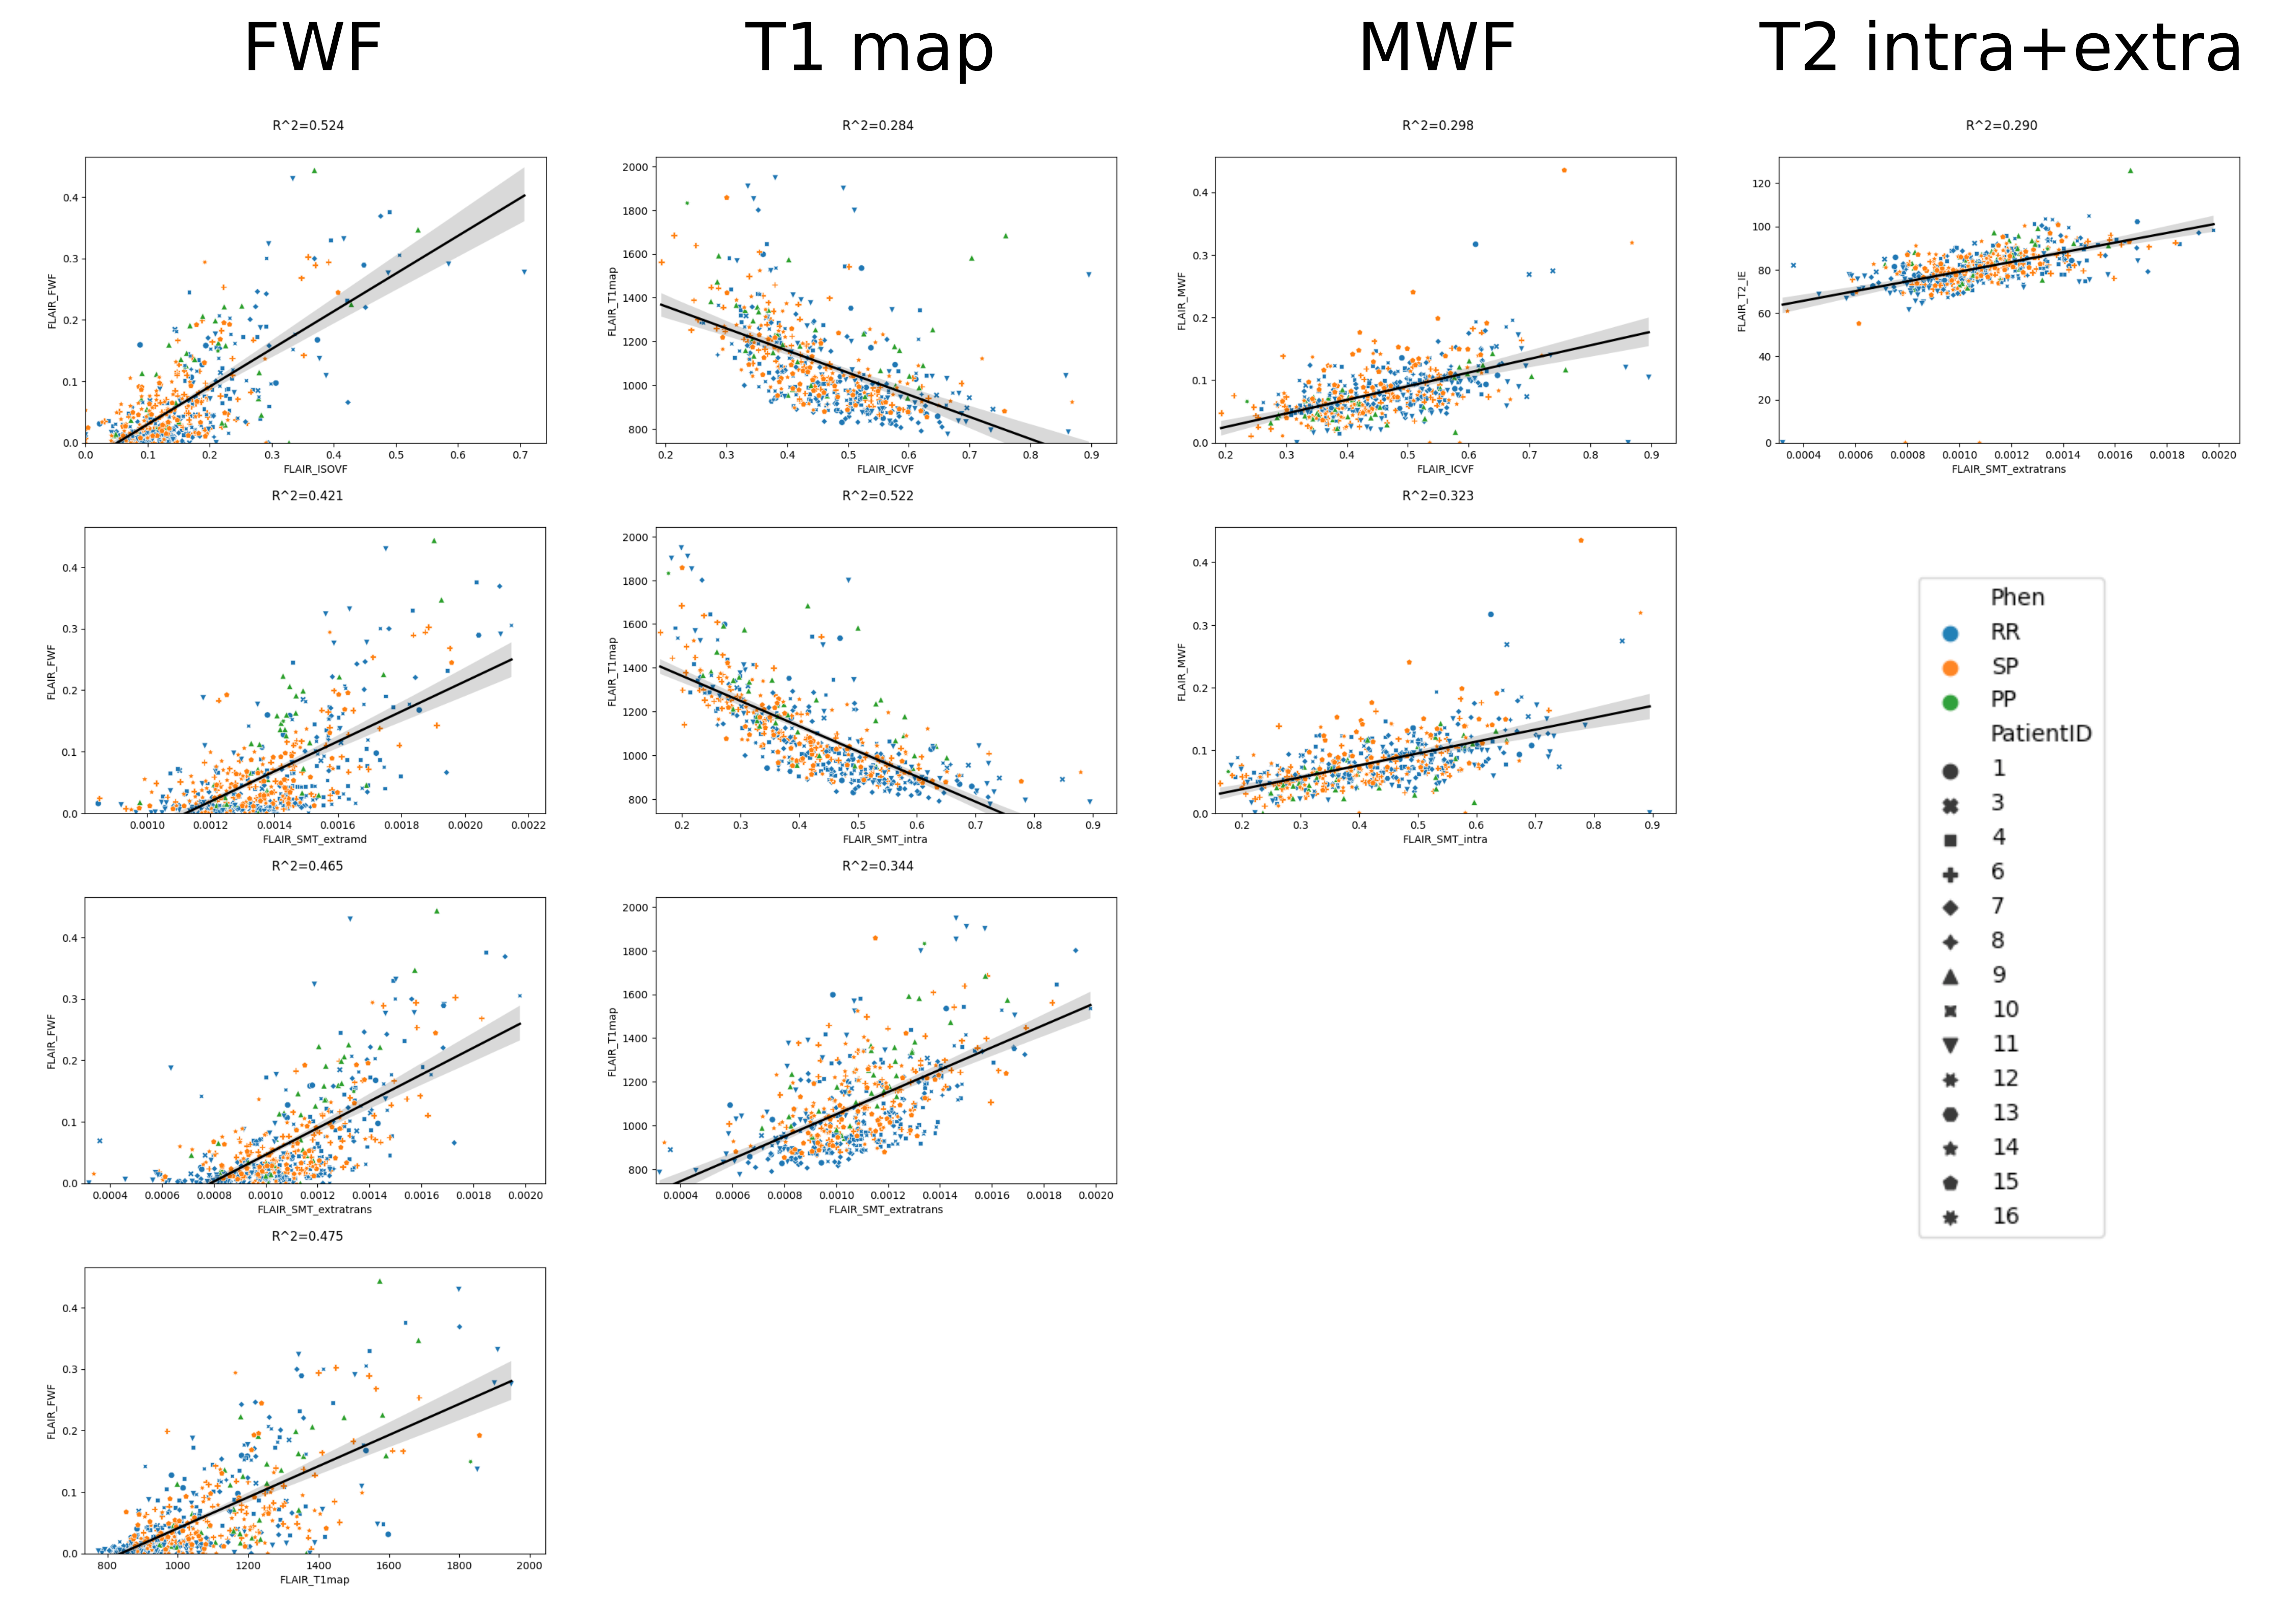
Figure 2: Scatter plots of strong relationships between microstructural metrics highlighted in Table 2. Points are color-coded by phenotype (RR=relapsing-remitting, PP=primary progressive, SP=secondary progressive) and marked differently for each subject involved in our study. Overall regression line is displayed in black with 95% confidence interval in grey.
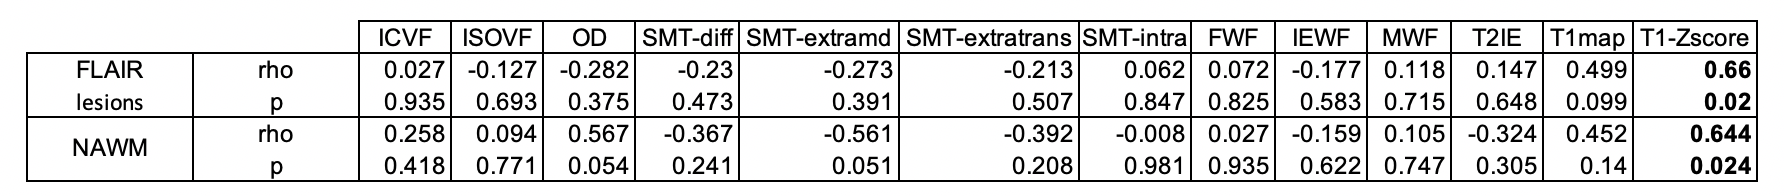
Table 3: Partial correlations between microstructural metrics and the expanded disability status score (EDSS), accounting for age, sex and phenotype as confounding factors. Statistically significant results are highlighted in bold.