0776
Classification of MS patients into disability levels using deep learning approaches based solely on routinely-acquired MRI1Multiple Sclerosis Centre of Catalonia (Cemcat), Department of Neurology/Neuroimmunology, Hospital Universitari Vall d’Hebron, Universitat Autònoma de Barcelona, Barcelona, Spain, 2Section of Neuroradiology, Department of Radiology (IDI), Vall d'Hebron University Hospital, Spain. Universitat Autònoma de Barcelona, Barcelona, Spain, 3Research institute of Computer Vision and Robotics, University of Girona, Girona, Spain
Synopsis
The ability of existing MRI biomarkers to predict MS patients’ prognosis is limited and inaccurate to be used at the individual level. We aimed to assess the ability of Convolutional Neural Networks (CNNs) to classify relapse-onset MS patients into non-disabled and markedly disabled using only MRI images. T1w and T2w-FLAIR images of 538 MS patients were used to train and test two CNN approaches which were compared also with (conventional) logistic regression models. The results showed that the CNN models performed better, having the intrinsic potential to improve after the inclusion of regional priors and other valuable clinical data.
Introduction
Multiple sclerosis (MS) is the main non-traumatic cause of irreversible disability in young adults, although its course can be highly variable among individuals1. Structural Magnetic Resonance Imaging (MRI) and the biomarkers extracted from it, such as brain lesion and grey matter volumes, are known to be good measurements to predict patients’ prognosis2-4.The combination of MRI and convolutional neural networks (CNNs) may help extract image features which cannot be detected through conventional summary statistics, but which are crucial for accurate future clinical prediction5-6. Furthermore, CNN analysis of routinely-acquired MRI data may help perform accurate patient classifications useful for screening purposes, for instance to select potential candidates for clinical trials.
In this study, we aimed to evaluate the ability of CNNs to stratify patients based on their disability level, i.e. non-disabled vs markedly disabled, using only routinely-acquired MRI. We also compared the performance of our CNNs with that of logistic regression (LR) models built using brain tissue and lesion volumetric features. Finally, we aimed to understand which anatomical regions the CNNs focus on to make predictions, through the computation of attention maps.
Methods
Subjects: 991 MRI scans from 538 patients with relapse-onset MS who were close to one of both ends of the Expanded Disability Status Scale (EDSS) were included. MRI scans were matched with the first EDSS score obtained within the following six months after the MRI acquisition, and stratified in 2 groups: no-disability (NoD): EDSS=[0.0-1.5]; and marked disability (D): EDSS=[4.0-9.0]. Patients’ characteristics are summarised in Table 1.MRI acquisition and processing: Images were acquired on 5 different scanners (all Siemens), at two magnetic field strengths (1.5T and 3T). T1-weighted (T1w) and T2-weighted FLAIR (T2w-FLAIR) sequences were pre-processed with bias normalisation7, skull-stripped8, registered to MNI152 space and intensity normalised.
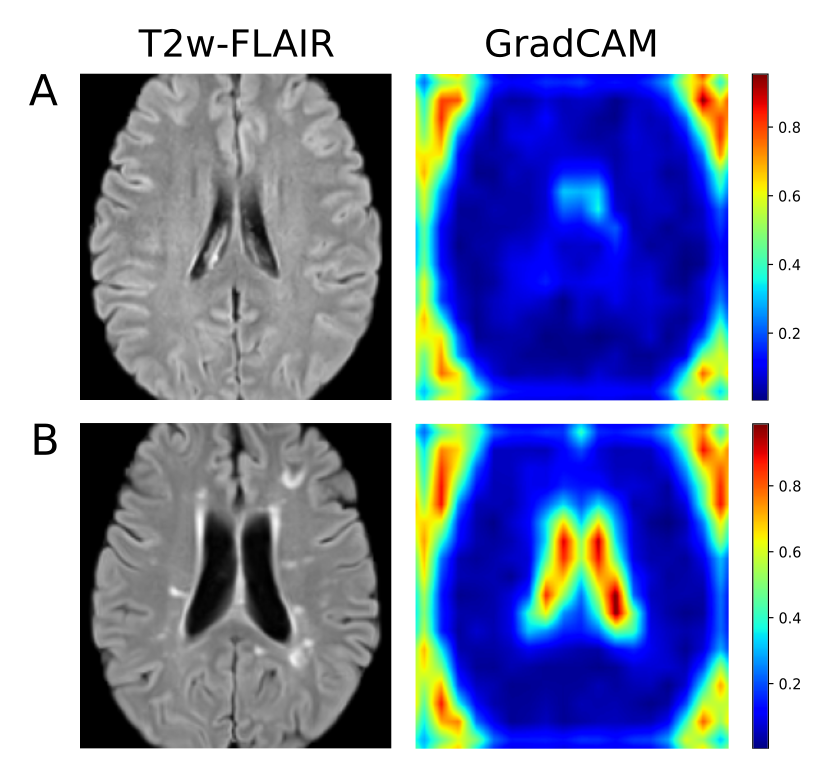
Two different CNN architectures were used to perform the NoD-D classification task (Figure 1). The first one is a 2D approach using the ResNet-349 model pretrained with the ImageNet10 database and fine-tuned for our classification task, whose final output per scan was calculated using the mean value of the different 2D slices predictions. The second one is a 3D CNN model based on residual convolutional 3D layers as previously described10, followed by fully connected layers to perform the classification. Additionally, attention maps11 were computed from the activations of the last convolutional block to analyse the main regions the CNN focused on to make predictions. In both CNN approaches, the central 40 brain slices of T1w and T2w-FLAIR sequences were taken as inputs of the training process.
LR models were built with lesion, white and grey matter, lateral ventricles and total intracranial volumes as explanatory (input) variables. Whole-brain lesion volumes were extracted using LST12 and tissue volumes using FastSurfer13.
All 991 scans were treated as independent pieces of information. Cross-validation was performed dividing the scans into three subsets containing NoD/D cases as: 100/60 (training), 25/17 (validation), and 14/14 (testing); 100 different tests were performed overall, using 100 random samples of N=230 scans taken from the whole cohort, always ensuring that, for each sample, the same subject did not appear in more than one subset.
Model-specific accuracies and areas under the ROC curve (AUC) were computed to assess each model’s performance. The three approaches were compared pairwise through permutation tests for paired data (2000 permutations/test).
Results
Of all approaches, the 2D CNN showed the highest accuracy (mean=0.77, SD=0.07) and AUC (mean=0.84, SD=0.07), followed by the 3D CNN approach and the LR model (Table 2). Pairwise permutation tests showed significant differences for all comparisons (Figure 2). As shown in Figure 3, the attention maps revealed that CNNs put a higher focus on the ventricles than on other brain regions when identifying subjects with marked disability.Discussion
Our study shows that deep learning approaches are able to capture image features that allow the stratification of NoD and D patients significantly better than traditional LR approaches. The 2D CNN model provided the highest accuracy, proving that the features from a pretrained model were good enough to be used in such a classification task. The 3D CNN model was specifically trained using our training data sets. Although results are comparable to those of the 2D CNN model, one should consider that the use of more training samples, specially of class D, could improve the learning process and the obtained accuracies. Interestingly, the attention maps revealed that the CNNs focused on general predictor-regions, such as lateral ventricles. No other brain locations were highlighted as ‘important’ for prediction, possibly because no priors were introduced into these models. We plan to explore this in our future work.Conclusion
In this study, we demonstrated the potential of deep learning-based models applied to routinely-acquired structural MRI images to classify relapse-onset MS patients into non-disabled and markedly disabled. Future work will study the inclusion of regional priors into the CNNs and also the integration of other valuable clinical and demographic variables into the deep learning models. Our study paves the way for the development of robust automatic patient classification tools which may be extremely useful to plan large-scale therapeutic interventions.Acknowledgements
P. Carbonell-Mirabent: his yearly salary is supported by a grant from Biogen to Fundacio privada Cemcat for statistical analysis.
A. Cobo-Calvo: has received grant from Instituto de Salud Carlos III, Spain; JR19/00007.
G. Arrambide: has received compensation for consulting services or participation in advisory boards from Sanofi and Merck; research support from Novartis; travel expenses for scientific meetings from Novartis, Roche, and ECTRIMS; and speaking honoraria from Stendhal, Sanofi, Merck. G. Arrambide is a member of the executive committee of the International Women in Multiple Sclerosis (iWiMS) network.
Á. Vidal-Jordana: has engaged in consulting and/or participated as speaker in events organized by Roche, Biogen, and Sanofi.
M. Comabella: has received compensation for consulting services and speaking honoraria from Bayer Schering Pharma, Merk Serono, Biogen-Idec, Teva Pharmaceuticals, Sanofi-Aventis, and Novartis.
B. Rodríguez-Acevedo: has received honoraria for consulting services from Wellspect.
C. Nos: has received funding for travel from Biogen Idec and F. Hoffmann-La Roche, Ltd.and speaker honoraria from Novartis.
C. Auger: has received speaking honoraria from Novartis, Biogen and Stendhal.
J. Río: has received speaking honoraria and personal compensation for participating on Advisory Boards from Biogen-Idec, Genzyme, Merck- Serono, Mylan, Novartis, Roche, Teva, and Sanofi-Aventis.
J. Sastre-Garriga: has received compensation for participating on Advisory Boards,speaking honoraria and travel expenses for scientific meetings, consulting services or research support from Celgene, Novartis, Biogen, Merck, and Genzyme.
X. Montalban: has received speaking honoraria and travel expenses for participation in scientific meetings, has been a steering committee member of clinical trials or participated in advisory boards of clinical trials in the past with Actelion, Amirall, Bayer, Biogen, Celgene, Genzyme, Hoffmann-La Roche, Novartis, Oryzon Genomics, Sanofi-Genzyme and Teva Pharmaceutical.
A. Rovira: serves on scientific advisory boards for Novartis, Sanofi-Genzyme, Synthetic MRI, Tensor medical, Roche, Biogen, and OLEA Medical, and has received speaker honoraria from Sanofi-Genzyme, Merck-Serono, Teva Pharmaceutical Industries Ltd, Novartis, Roche and Biogen.
M. Tintoré: has received compensation for consulting services and speaking honoraria from Almirall, Bayer Schering Pharma, Biogen-Idec, Genzyme, Merck-Serono, Novartis, Roche, Sanofi-Aventis, and Teva Pharmaceuticals. MT is co-editor of Multiple Sclerosis Journal- ETC.
D. Pareto: has received speaking honoraria from Novartis and Sanofi Genzyme, and has a research contract with Biogen Idec.
C. Tur: is currently being funded by a Junior Leader La Caixa Fellowship. The project that gave rise to these results received the support of a fellowship from ”la Caixa” Foundation (ID 100010434). The fellowship code is LCF/BQ/PI20/11760008. She has also received the 2021 Merck’s Award for the Investigation in Multiple Sclerosis (Spain). In 2015, she received an ECTRIMS Post-doctoral Research Fellowship and has received funding from the UK MS Society (grant number 77). She has also received speaker honoraria from Roche and Novartis.
None of the above influenced data acquisition and analysis, result interpretation and the decision to submit this work in its present form to a conference.
References
- Thompson AJ, Baranzini SE, Geurts J, Hemmer B, Ciccarelli O. Multiple sclerosis. Lancet 2018;391:1622-1636.
- Fisniku LK, Brex PA, Altmann DR, Miszkiel KA, Benton CE, Lanyon R, Thompson AJ, Miller DH. Disability and T2 MRI lesions: a 20-year follow-up of patients with relapse onset of multiple sclerosis. Brain. 2008 Mar;131(Pt 3):808-17.
- Calabrese, M., Castellaro, M.: Cortical gray matter MR imaging in multiple sclerosis. Neuroimaging Clin. (2017) 27(2), 301–312.
- Haider L, Chung K, Birch G, Eshaghi A, Mangesius S, Prados F, Tur C, Ciccarelli O, Barkhof F, Chard D. Linear brain atrophy measures in multiple sclerosis and clinically isolated syndromes: a 30-year follow-up. J Neurol Neurosurg Psychiatry. 2021 Mar 30:jnnp-2020-325421.
- Tousignant, A., Lemaître, P., Precup, D., Arnold, D.L., Arbel, T.. Prediction of Disease Progression in Multiple Sclerosis Patients using Deep Learning Analysis of MRI Data. Proceedings of The 2nd International Conference on Medical Imaging with Deep Learning, inProceedings of Machine Learning Research (2019) 102:483-492.
- Roca P, Attye A, Colas L, Tucholka A, Rubini P, Cackowski S, Ding J, Budzik JF, Renard F, Doyle S, Barbier EL, Bousaid I, Casey R, Vukusic S, Lassau N, Verclytte S, Cotton F; OFSEP Investigators; Steering Committee; Investigators; Imaging group. Artificial intelligence to predict clinical disability in patients with multiple sclerosis using FLAIR MRI. Diagn Interv Imaging. 2020 Dec;101(12):795-802.
- Tustison NJ, Avants BB, Cook PA, Zheng Y, Egan A, Yushkevich PA, Gee JC. N4ITK: improved N3 bias correction. IEEE Trans Med Imaging. 2010 Jun;29(6):1310-20.
- Isensee F, Schell M, Pflueger I, Brugnara G, Bonekamp D, Neuberger U, Wick A, Schlemmer HP, Heiland S, Wick W, Bendszus M, Maier-Hein KH, Kickingereder P. Automated brain extraction of multisequence MRI using artificial neural networks. Hum Brain Mapp. 2019 Dec 1;40(17):4952-4964.
- K. He, X. Zhang, S. Ren and J. Sun, "Deep Residual Learning for Image Recognition," 2016 IEEE Conference on Computer Vision and Pattern Recognition (CVPR), 2016, pp. 770-778.
- Deng J, Dong W, Socher R, Li L-J, Li K, Fei-Fei L. Imagenet: A large-scale hierarchical image database. In: 2009 IEEE conference on computer vision and pattern recognition. 2009. p. 248–55.
- R. R. Selvaraju, M. Cogswell, A. Das, R. Vedantam, D. Parikh and D. Batra, "Grad-CAM: Visual Explanations from Deep Networks via Gradient-Based Localization," 2017 IEEE International Conference on Computer Vision (ICCV), 2017, pp. 618-626.
- Schmidt P, Gaser C, Arsic M, Buck D, Förschler A, Berthele A, Hoshi M, Ilg R, Schmid VJ, Zimmer C, Hemmer B, Mühlau M. An automated tool for detection of FLAIR-hyperintense white-matter lesions in Multiple Sclerosis. Neuroimage. 2012 Feb 15;59(4):3774-83.
- Henschel L, Conjeti S, Estrada S, Diers K, Fischl B, Reuter M, FastSurfer - A fast and accurate deep learning based neuroimaging pipeline, NeuroImage 219 (2020), 117012.
Figures
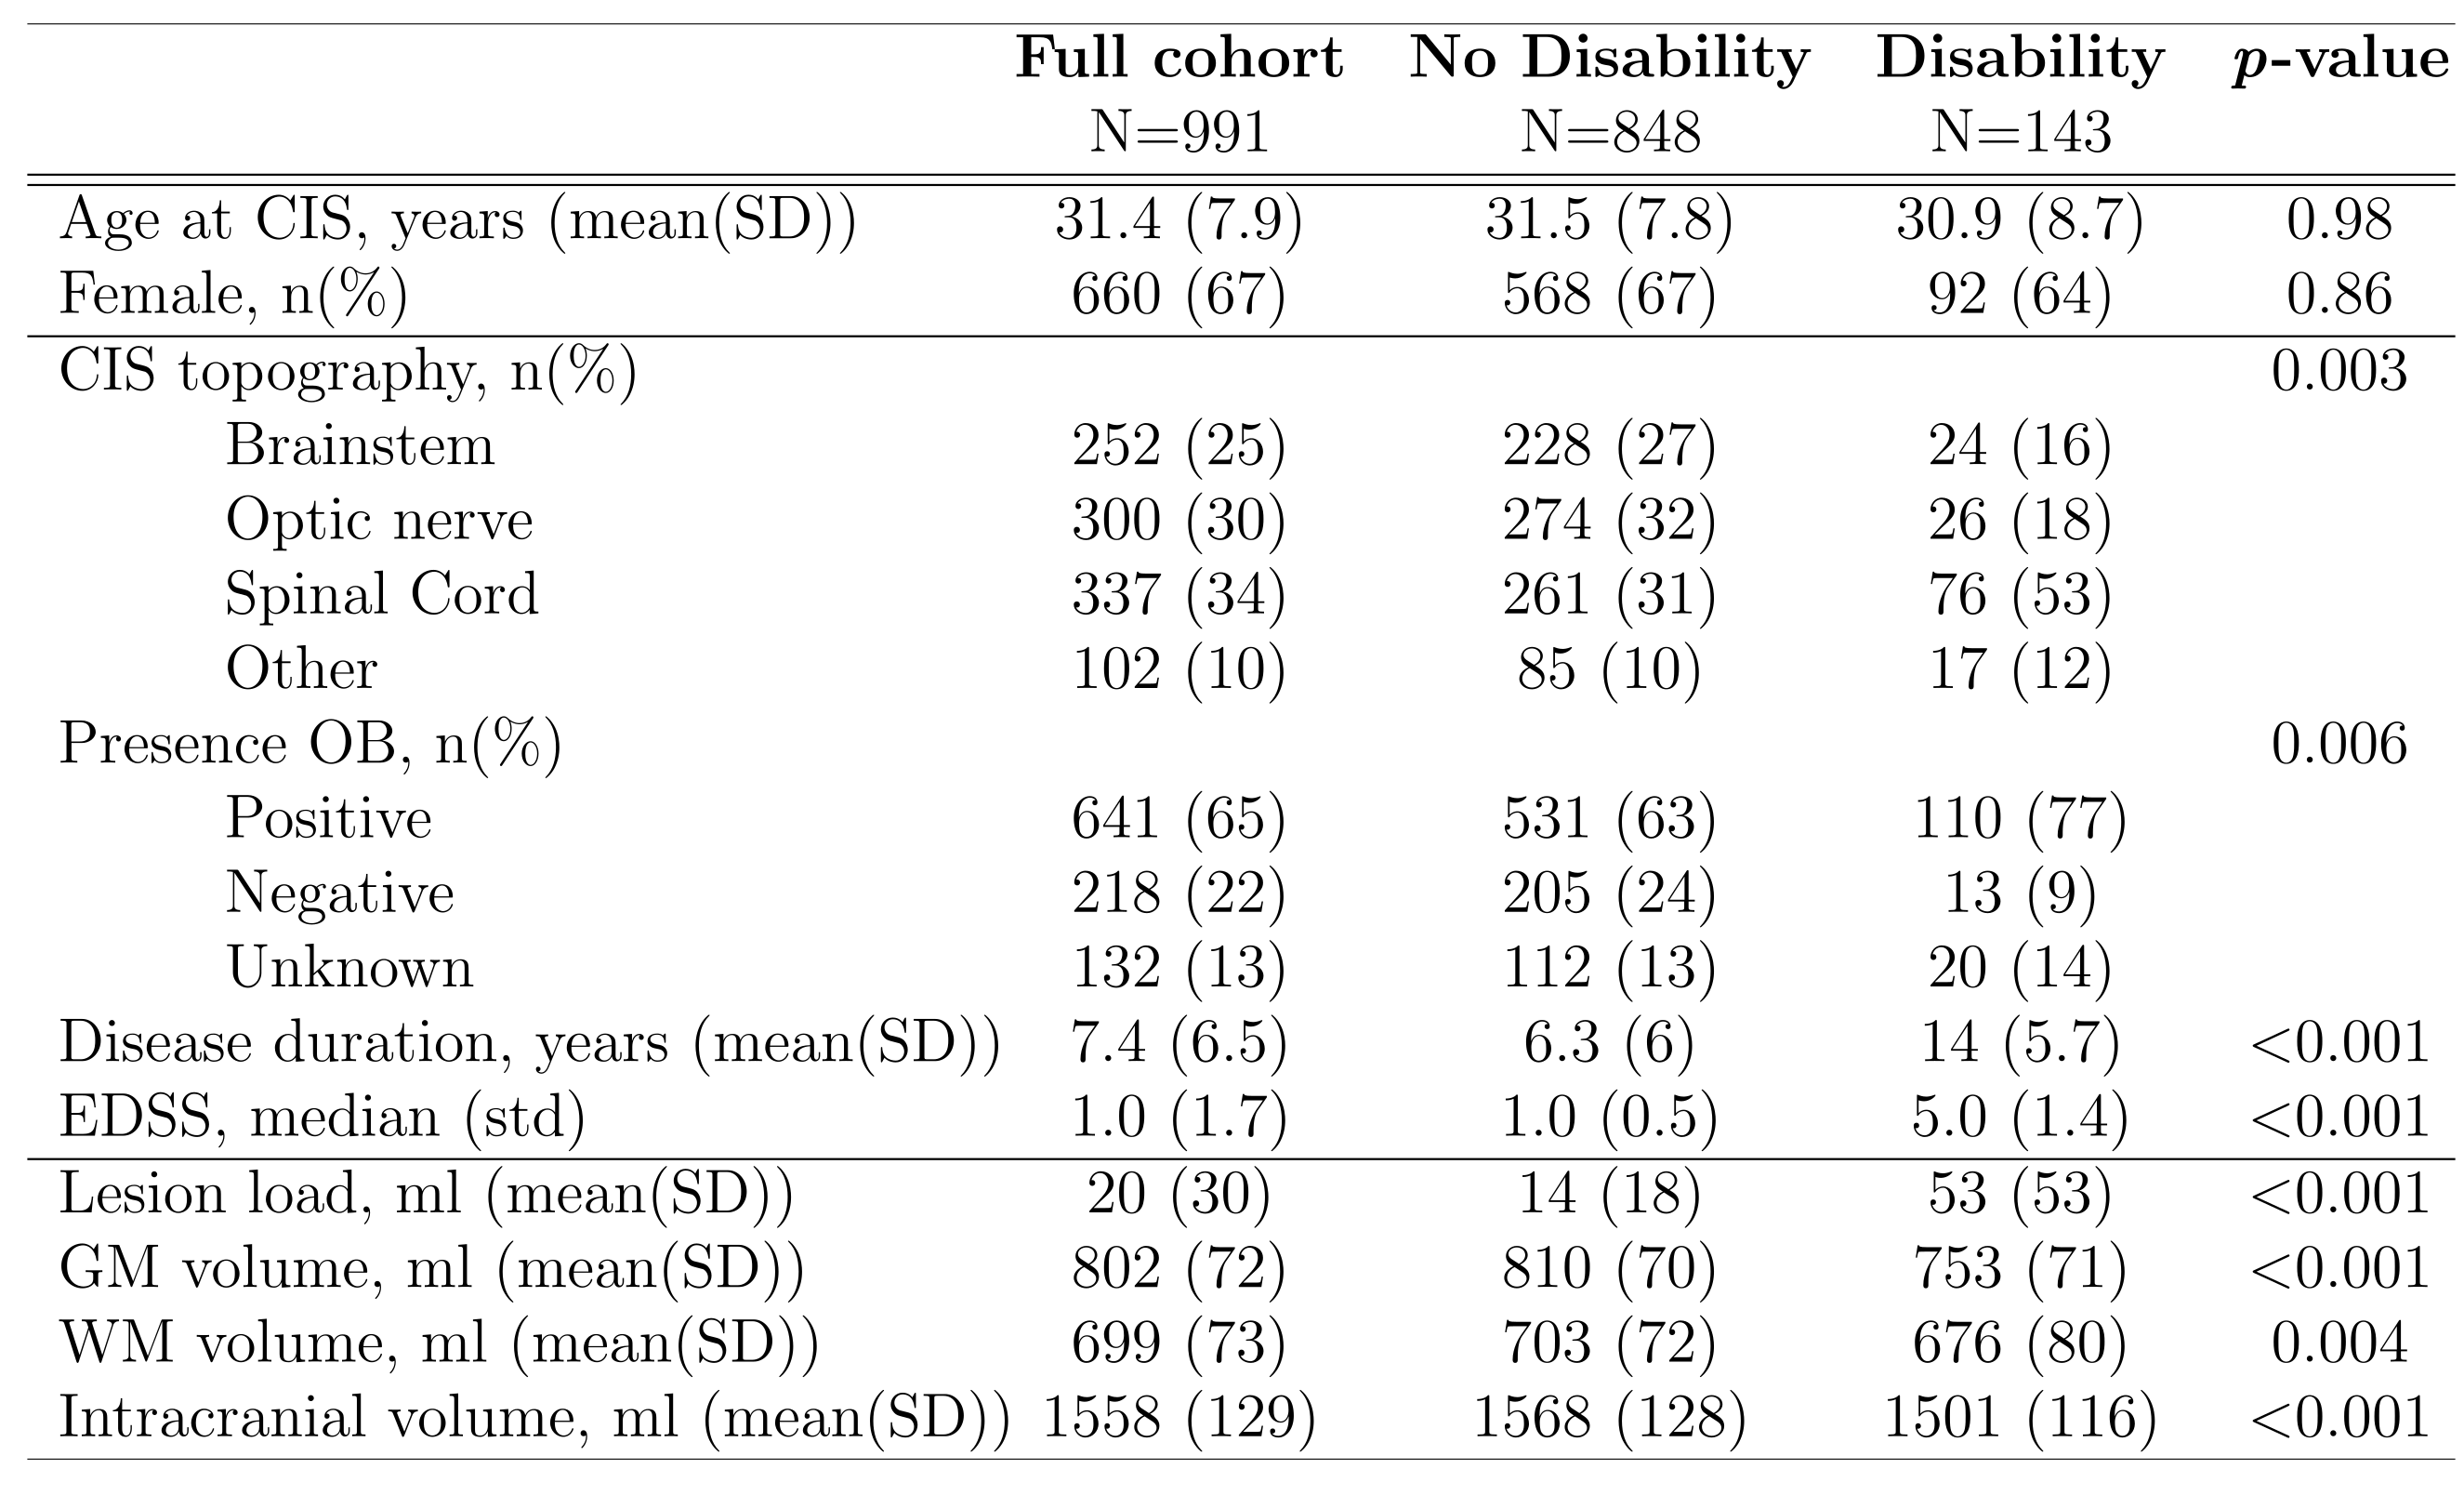
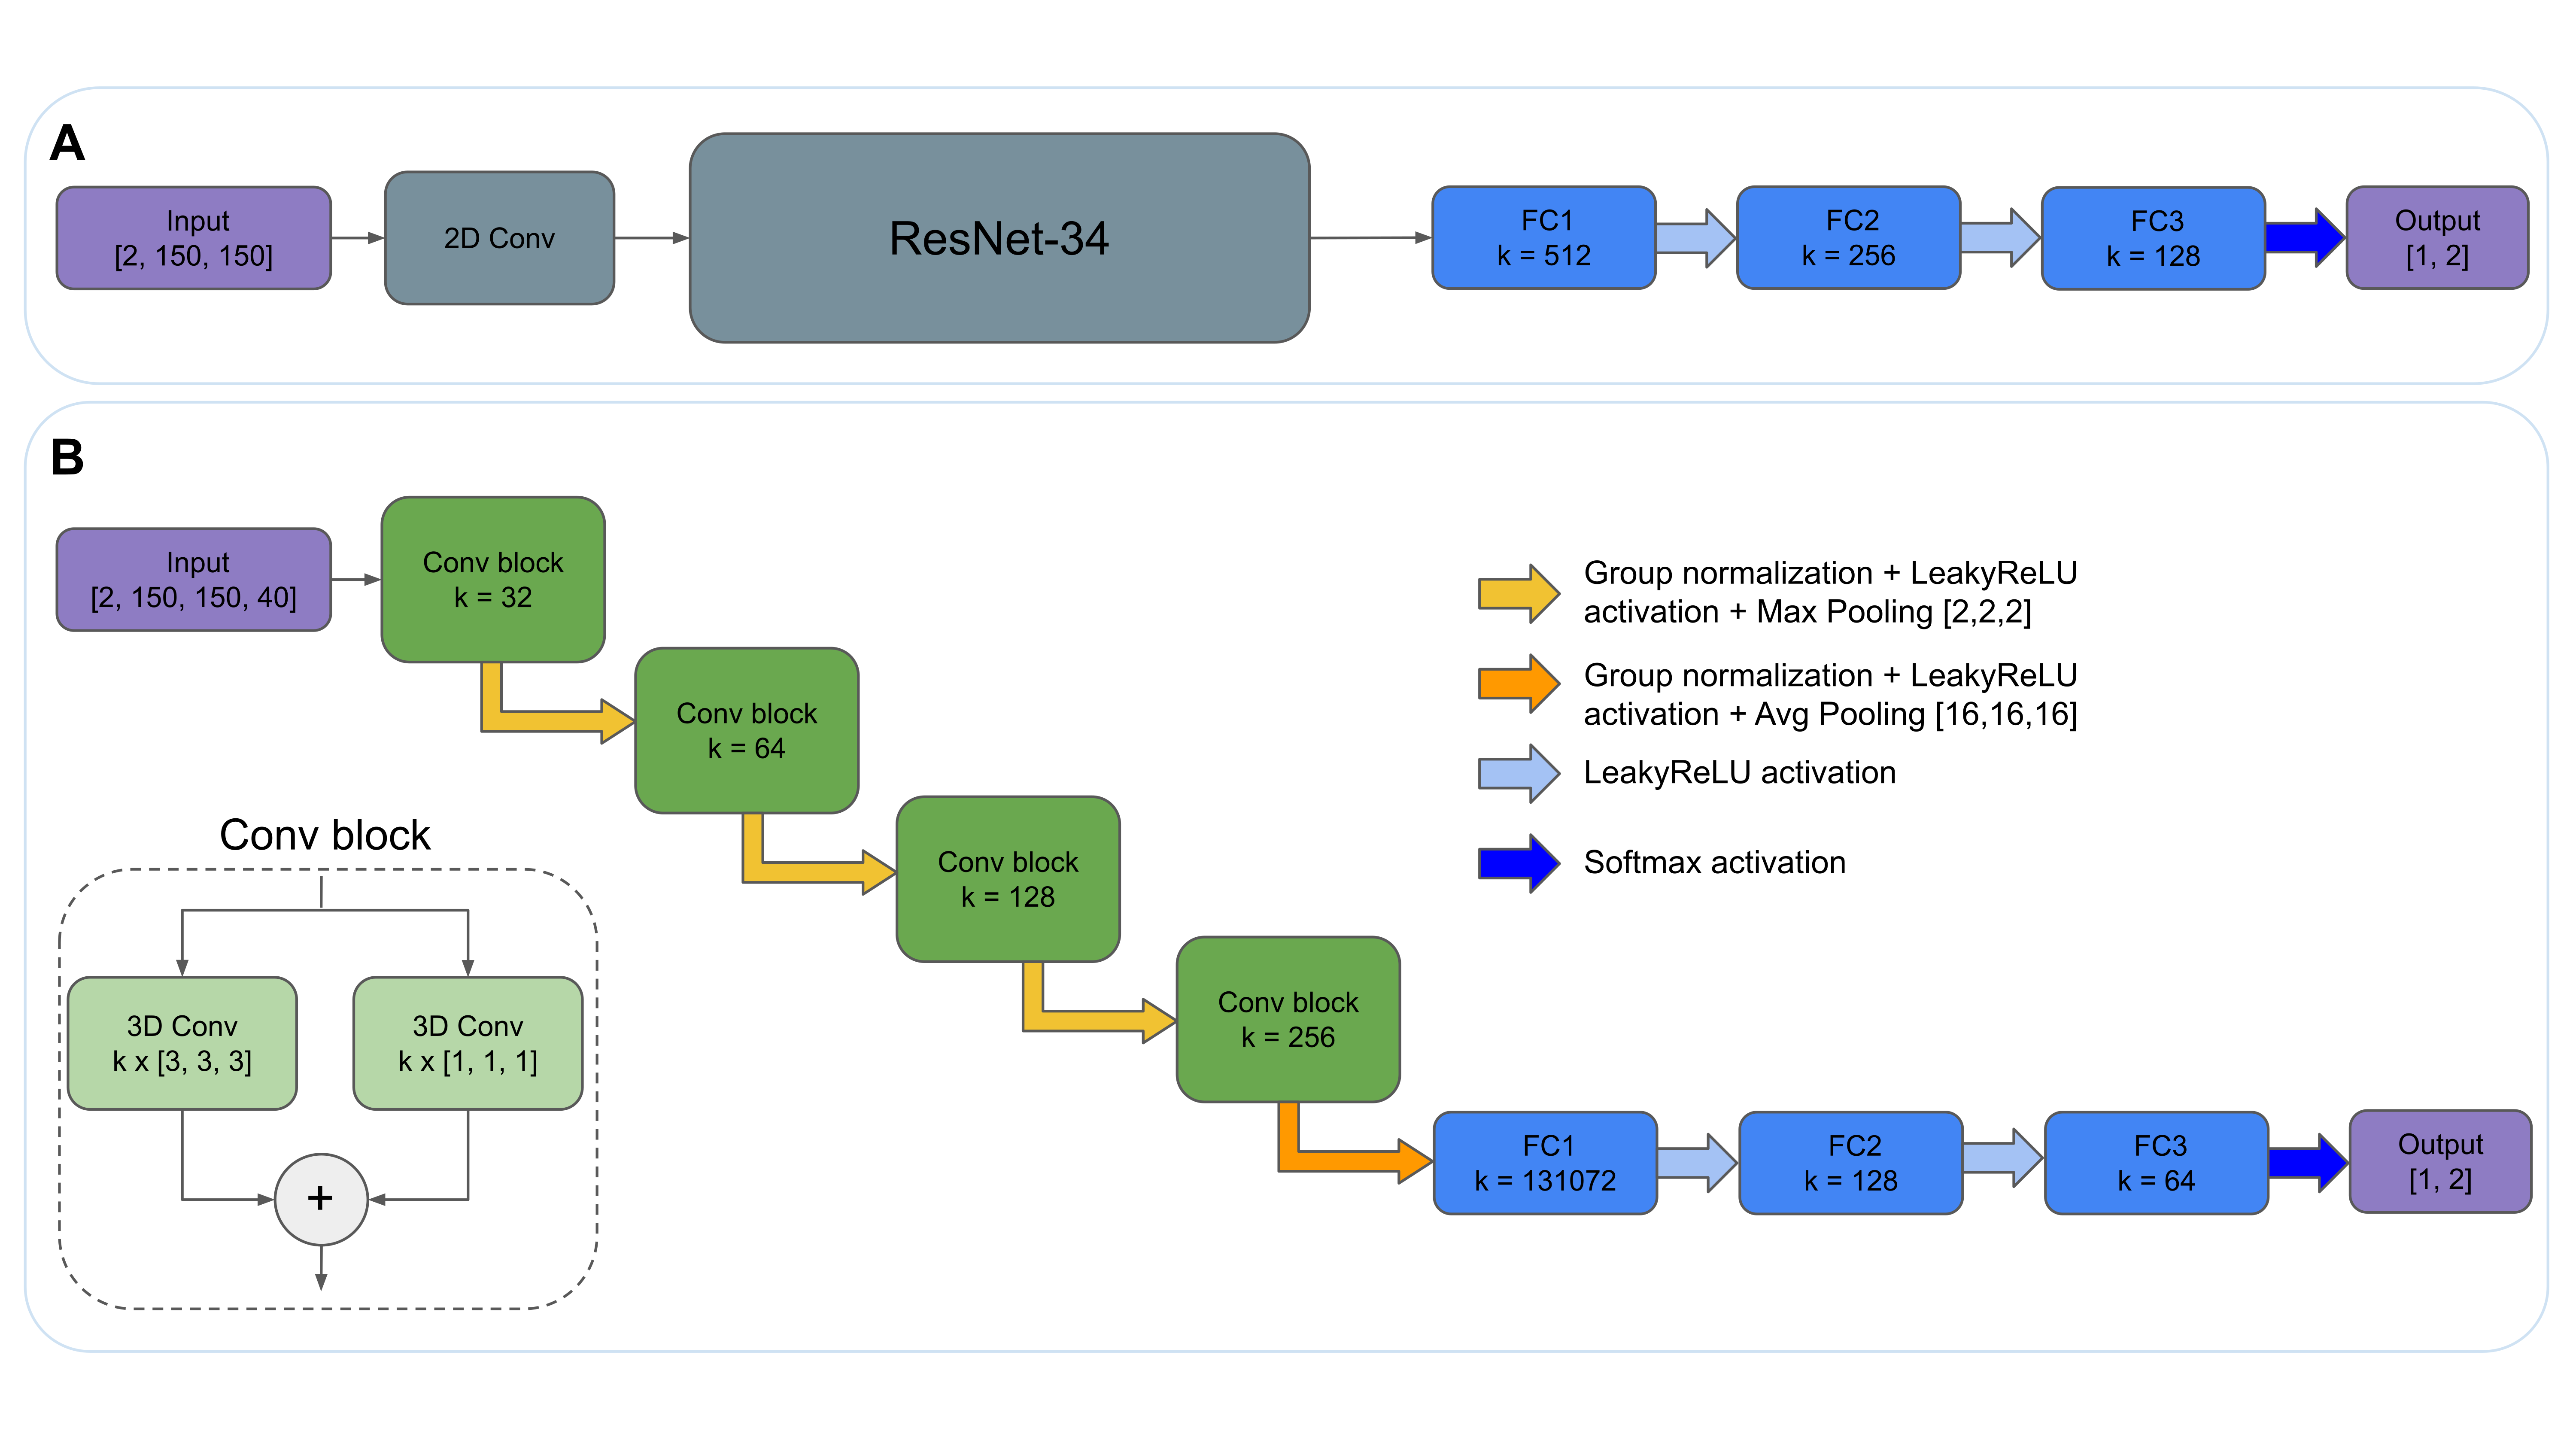
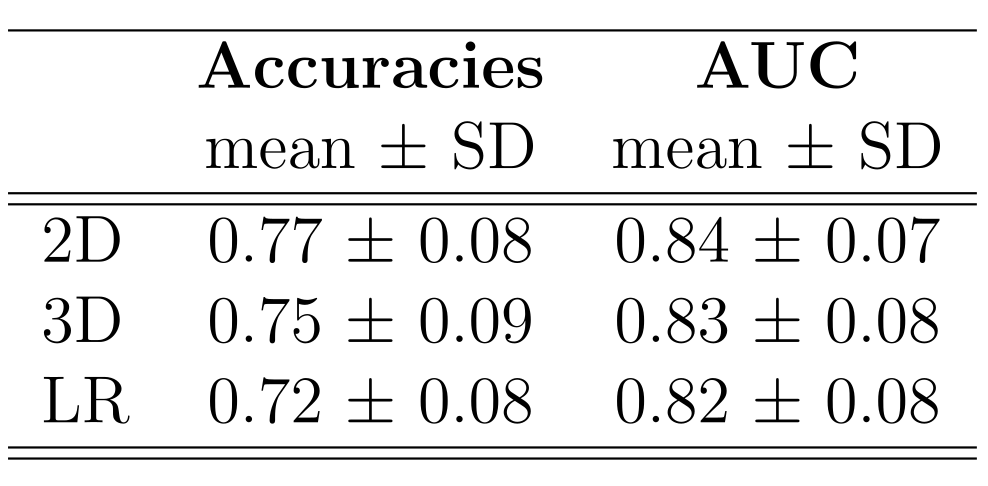
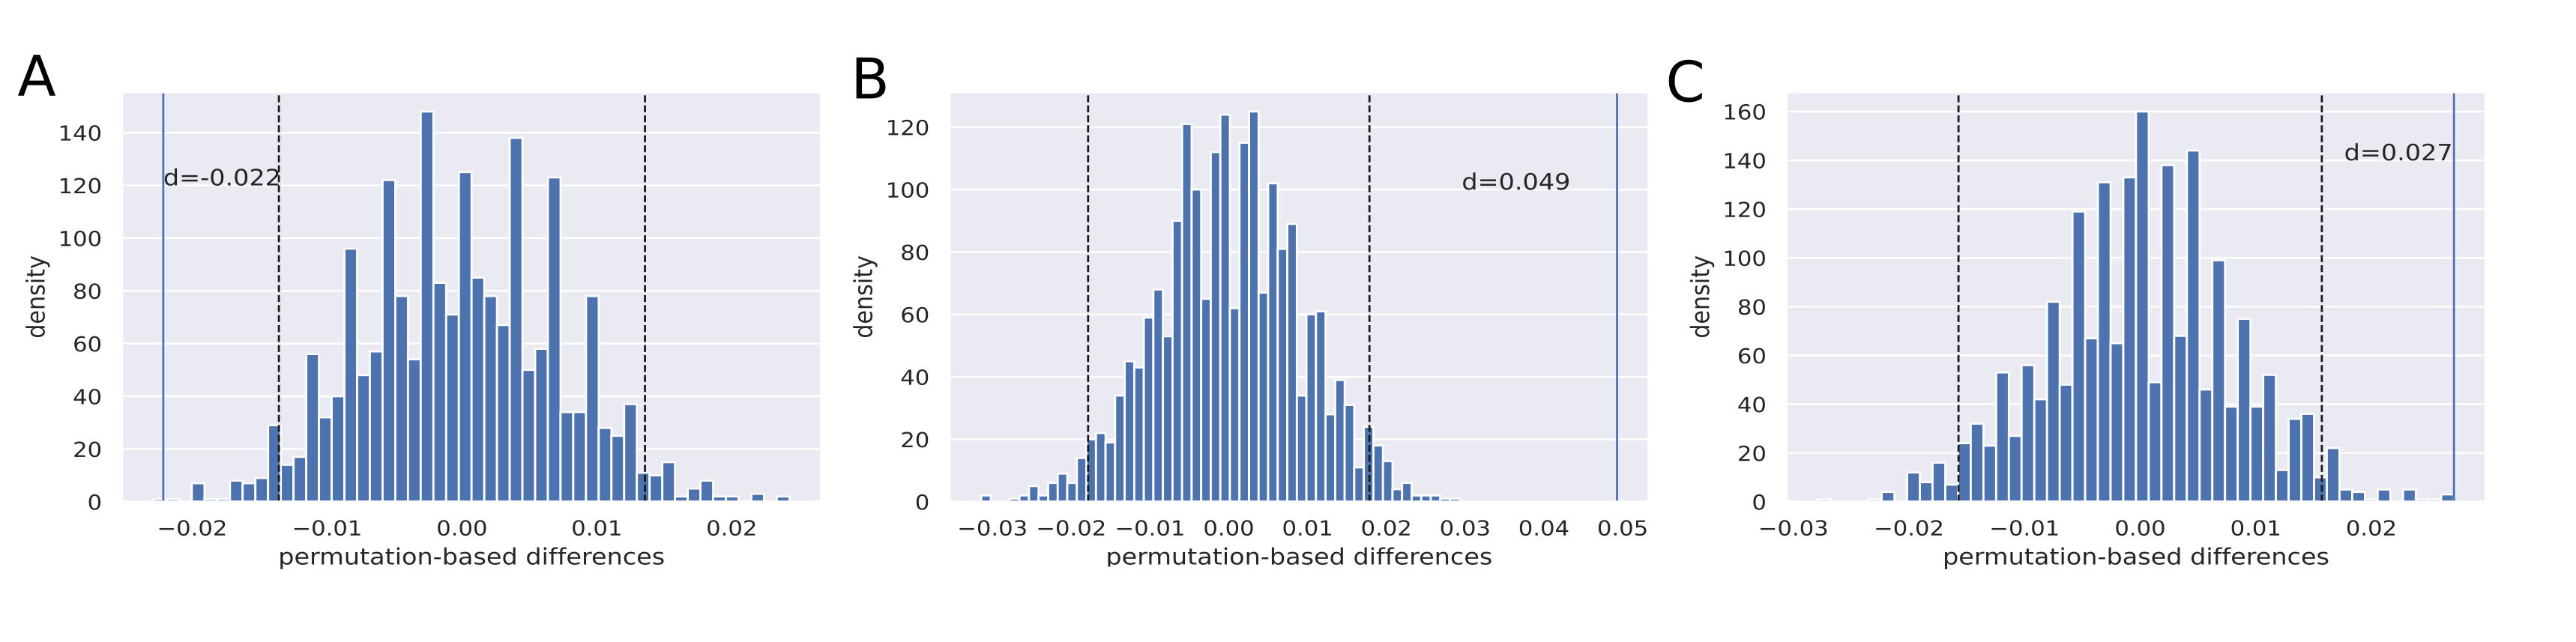
Figure 2: Distributions of the paired permutation-based differences. Dashed lines denote the limits of the 95% CI; d denotes the observed mean distance between the accuracies of model 1 and model 2. If d appears outside the limits of the CI, we assume that the difference between the 2 models is significant. (A) 3D model (model 1) vs 2D model (model 2) (p=0.003); (B) 2D model (model 1) vs LR (model 2) (p<0.0005), and (C) 3D model (model 1) vs LR (model 2) (p=0.001).