0774
Resolve fiber crossings using orientation distribution function (ODF) of decomposed sub-voxel paramagnetic and diamagnetic susceptibility1Electrical Engineering and Computer Sciences, University of California, Berkeley, Berkeley, CA, United States, 2Max Planck Institute for Human Cognitive and Brain Sciences, Leipzig, Germany, 3Max Planck Institute for Evolutionary Anthropology, Leipzig, Germany, 4Taï Chimpanzee Project, Centre Suisse de Recherches Scientifiques en Côte d’Ivoire, Abidjan, Cote D'ivoire, 5Helen Wills Neuroscience Institute, University of California, Berkeley, Berkeley, CA, United States
Synopsis
DECOMPOSE-QSM was applied on high angular-resolution multi-echo gradient-echo data of a chimpanzee brain to evaluate its ability in resolving orientation mixture of substructure fiber bundles. The orientation distribution function (ODF) of the separated paramagnetic and diamagnetic susceptibility provides smooth transitions of multiple fiber orientations. Additionally, the paramagnetic maps from DECOMPOSE show a potential to resolve fiber crossings in deep gray matter regions.
Introduction
Diffusion tensor and susceptibility tensor have been used to study brain fiber structures1,2. The structural anisotropy in both models is characterized by a rank-2 tensor. However, within the regular MRI resolution (~1mm voxel size), fiber structures might not align together in one direction. Many methods to achieve high angular resolution within one voxel have been developed, such as q-space imaging3, q-ball imaging4,5, or higher-order tensor imaging6. Higher-order diffusion and susceptibility tenors together provide complementary information of the microstructure of white matter7. However, one voxel may contain both paramagnetic and diamagnetic susceptibility (with respect to the reference susceptibility species), thus compromising the susceptibility characterization. The recently introduced DECOMPOSE-QSM8, is able to decompose the sub-voxel paramagnetic and diamagnetic susceptibility sources. Herein, we investigate if DECOMPOSE can improve the separation of fiber orientations using high angular-resolution (61 orientations) susceptibility data. Orientation distribution function (ODF) analysis is adopted visualize the fiber orientations within one voxel. While the meaning of the multimodal ODF remains to be resolved, we loosely call them “fiber orientations” here.Methods
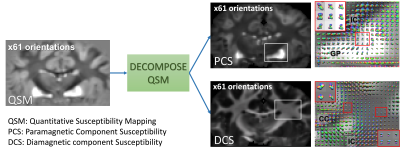
Multi-Echo Gradient-Echo (ME-GRE) ex vivo brain data of a wild chimpanzee, died from natural causes, was acquired on a 3T MAGNETOM Skyra Connectom scanner (Siemens Healthineers, Erlangen, Germany) at 61 sample orientations. Parameters are TE1/TE2/dTE/TE12=3.54/6.98/3.75/44.48ms, TR=50ms, and 1mm isotropic native spatial resolution. Phase of multi-orientation ME-GRE data was unwrapped using the Laplacian based method, then filtered using V-SHARP followed by the STAR-QSM algorithm9 to calculate QSM for each echo. Paramagnetic component susceptibility (PCS) and diamagnetic component susceptibility (DCS) maps were produced using DECOMPOSE8. GRE magnitude images of all orientations were registered to a reference volume using rigid transformation FLIRT in FSL10. The transformation matrix was applied on local tissue phase, QSM, PCS and DCS. PCS, DCS, echo-averaged local phase, echo-averaged QSM are used to draw ODF of each voxel using DSI studio11. Figure 1 illustrates the processing pipeline.Results
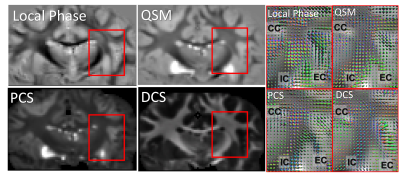
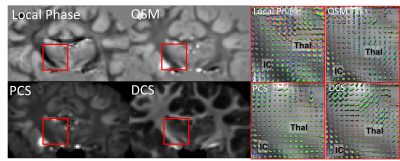
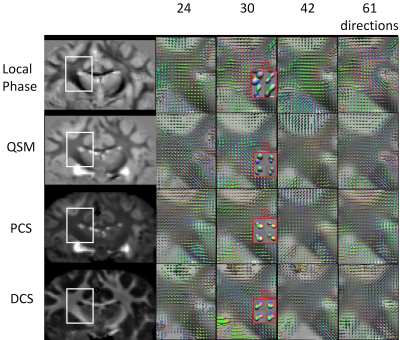
ODF reconstructed from local phase, QSM, PCS and DCS all reveal multimodal distributions at the region where external capsule (EC) and IC merge with cortical WM fibers (Figure 2). The PCS and DCS-based ODF shows more coherent paths of fibers going through the crossing area. Tissue-phase-based ODF contains more sudden transitions from one region to another. QSM-based ODF approximately appears to be the combination of PCS and DCS-based ODF. Since DECOMPOSE separates out the positive and negative sources, at regions with high iron content or complex iron and white matter composition, for example in deep grey matter, PCS and DCS-based ODF has the potential to resolve the fiber orientations of sub-nuclei (Figure 3). Additionally, fibers going through thalamus region can be tracked from DCS (Figure 3). Further investigations included the dependency of ODF results on the number of orientations. As shown in Figure 4, with as few as 30 orientations, DCS-ODF starts to have clear fiber crossing indications that are consistent with results from 61 orientations. In comparison, all the other contrasts show little fiber crossing information with 30 orientations.Discussion
Our data and analysis revealed several unique findings. First, all contrasts (local phase, QSM, PCS and DCS) show the ability to reveal multimodal orientation distribution within a voxel. The exact biological and physical meanings of these orientations remain to be resolved. Second, the DECOMPOSE-based maps provide more coherent orientations among all contrasts included here. This likely indicates that decomposing paramagnetic and diamagnetic susceptibility within a voxel provides more accurate estimation of these orientations. Diamagnetic susceptibility mainly originates from myelin, thus smooth tracts from DCS-ODF can be beneficial for studying brain axonal fiber structures. Third, the paramagnetic susceptibility component surprisingly also shows multimodal rather than a spherical shape. We may, therefore, use PCS-ODF to study the complex fiber structure in deep grep matter. DCS and PCS reflect varying compositions of certain fibers: Some fibers are iron rich, and others might be myelin rich. Thus, the iron-rich fibers tend to show up in PCS-ODF, whereas myelin-rich fibers are reflected in DCS-ODF. This observation suggests that PCS-ODF and DCS-ODF should be analyzed and observed together as they provide complementary information. Further modeling and validations are needed to fully investigate the effect of integrating DECOMPOSE in susceptibility based ODF analysis.Acknowledgements
This work was supported in part by the Alzheimer's Drug Discovery Foundation through grant GC-201810-2017383 and by the EU through grant H2020-MSCA-ITN-2018 (“INSPiRE-MED”). Research reported in this publication was in part supported by the National Institute of Aging of the National Institutes of Health under Award Number R01AG070826. The content is solely the responsibility of the authors and does not necessarily represent the official views of the National Institutes of Health.References
(1) Liu, C. Susceptibility Tensor Imaging. Magn. Reson. Med. Off. J. Soc. Magn. Reson. Med. Soc. Magn. Reson. Med. 2010, 63 (6), 1471–1477. https://doi.org/10.1002/mrm.22482.
(2) Li, W.; Liu, C.; Duong, T. Q.; Zijl, P. C. M. van; Li, X. Susceptibility Tensor Imaging (STI) of the Brain. NMR Biomed. 2017, 30 (4), e3540. https://doi.org/10.1002/nbm.3540.
(3) King, M. D.; Houseman, J.; Roussel, S. A.; Van Bruggen, N.; Williams, S. R.; Gadian, D. G. Q-Space Imaging of the Brain. Magn. Reson. Med. 1994, 32 (6), 707–713. https://doi.org/10.1002/mrm.1910320605.
(4) Tuch, D. S. Q-Ball Imaging. Magn. Reson. Med. 2004, 52 (6), 1358–1372. https://doi.org/10.1002/mrm.20279.
(5) Mukherjee, P.; Hess, C. P.; Xu, D.; Han, E. T.; Kelley, D. A.; Vigneron, D. B. Development and Initial Evaluation of 7-T q-Ball Imaging of the Human Brain. Magn. Reson. Imaging 2008, 26 (2), 171–180. https://doi.org/10.1016/j.mri.2007.05.011.
(6) Liu, C.; Mang, S. C.; Moseley, M. E. In Vivo Generalized Diffusion Tensor Imaging (GDTI) Using Higher-Order Tensors (HOT). Magn. Reson. Med. Off. J. Soc. Magn. Reson. Med. Soc. Magn. Reson. Med. 2010, 63 (1), 243–252. https://doi.org/10.1002/mrm.22192.
(7) Liu, C.; Murphy, N.; Li, W. Probing White-Matter Microstructure with Higher-Order Diffusion Tensors and Susceptibility Tensor MRI. Front. Integr. Neurosci. 2013, 7. https://doi.org/10.3389/fnint.2013.00011.
(8) Chen, J.; Gong, N.-J.; Chaim, K. T.; Otaduy, M. C. G.; Liu, C. Decompose Quantitative Susceptibility Mapping (QSM) to Sub-Voxel Diamagnetic and Paramagnetic Components Based on Gradient-Echo MRI Data. NeuroImage 2021, 242, 118477. https://doi.org/10.1016/j.neuroimage.2021.118477.
(9) STISuite; https://people.eecs.berkeley.edu/~chunlei.liu/software.html.
(10) Jenkinson, M.; Beckmann, C. F.; Behrens, T. E. J.; Woolrich, M. W.; Smith, S. M. FSL. NeuroImage 2012, 62 (2), 782–790. https://doi.org/10.1016/j.neuroimage.2011.09.015.
(11) Yeh, F. DSI Studio. 2021. https://doi.org/10.5281/zenodo.4764264.
Figures


