0773
Diffusion-filtered imaging: Towards tissue-specific diffusion-MRI contrasts by combinations of tensor-valued diffusion encoding1Clinical Sciences Lund, Lund University, Lund, Sweden, 2Radiology, Brigham and Women's Hospital, Boston, MA, United States
Synopsis
Diffusion weighted imaging has been used both as a radiological tool that provides a simple biomarker without quantitative qualities, and more recent efforts have endeavored to make it quantitative by fitting of biophysical models or representations. In this work, we explore the novel radiological contrasts that can be generated by introducing tensor-valued diffusion encoding. Unlike most model-based approaches, these contrasts can be produced by rapid acquisition schemes and they produce novel contrasts that may contribute new diagnostic and radiological biomarkers.
Introduction
Diffusion MRI is frequently used in radiology to generate images that can be interpreted in light of radiological experience. The introduction of advanced diffusion encoding modalities (e.g. double diffusion encoding, oscillating gradients and tensor-valued encoding) have primarily been used to fit biophysical models or representations to yield specific quantities. As an alternative, we aim to utilize tensor-valued diffusion encoding and simple arithmetic operations to directly generate images with valuable contrast. To capture the meaning of the yielded contrasts, we visualize them as 'diffusivity filters' in a space that spans diffusivity vs. anisotropy. We denote the approach as 'diffusion-filtered imaging.'Theory
We define four dMRI signal contrasts based on combinations of diffusion encoding b-tensors. Although we perform no fitting, we conceptualize the contrasts as 'signal pass filters' in the diffusion domain in analogy to low/high-pass filters in the frequency domain. We consider a system of fully dispersed domains [Callaghan79], each described by its radial and axial diffusivity $$$(D_{||}$$$ and $$$D_{\perp}$$$ with mean diffusivity $$$D=(D_{||}+2D_{\perp})/3)$$$, such that the powder-averaged signal is [Eriksson15]$$S(b_{\mathrm{L}},b_{\mathrm{S}})/S_0=\sqrt{\pi/4/A}~\exp(-b_{\mathrm{L}}D_{\perp}-b_{\mathrm{S}}D)~\mathrm{erf}(\sqrt{A})$$where $$$A=b_{\mathrm{L}}(D_{||}-D_{\perp})$$$, and $$$b_{\mathrm{S}},~b_{\mathrm{L}}$$$ are the b-values from spherical and linear b-tensor encoding (STE and LTE). For simplicity, we will assume an 'in vivo brain'-premise $$$(D\approx1~\mathrm{μm^2/ms},~D_{||}/D_{\perp}\in[1~500])$$$ and we normalize signal to $$$S_0$$$ to avoid transmit/receive-bias and T2 shine-through.$$$~~~$$$'Conventional' dMRI contrast is used as a familiar reference, represented by LTE at $$$b=1~\mathrm{ms/μm^2}$$$. At low b-values, this signal depends solely on the diffusivity, according to$$S_{\mathrm{conv}}(b_{\mathrm{L}})/S_0\approx\exp(-b_{\mathrm{L}}D).$$
$$$~~~$$$The 'aniso-pass filter,' indirectly employed in several studies [Eriksson13], is achieved by subtracting STE from LTE signal at a common high b-value (e.g. $$$b=2~\mathrm{ms/μm}^2$$$ [Szczepankiewicz19a]), such that the signal difference reflects the microscopic diffusion anisotropy, according to$$S_{\mathrm{aniso}}(b_{\mathrm{L}}=b_{\mathrm{S}})/S_0=\sqrt{\pi/4/A}~\exp(-b_{\mathrm{L}}D_{\perp})~\mathrm{erf}(\sqrt{A})-\exp(-b_{\mathrm{S}}D).$$
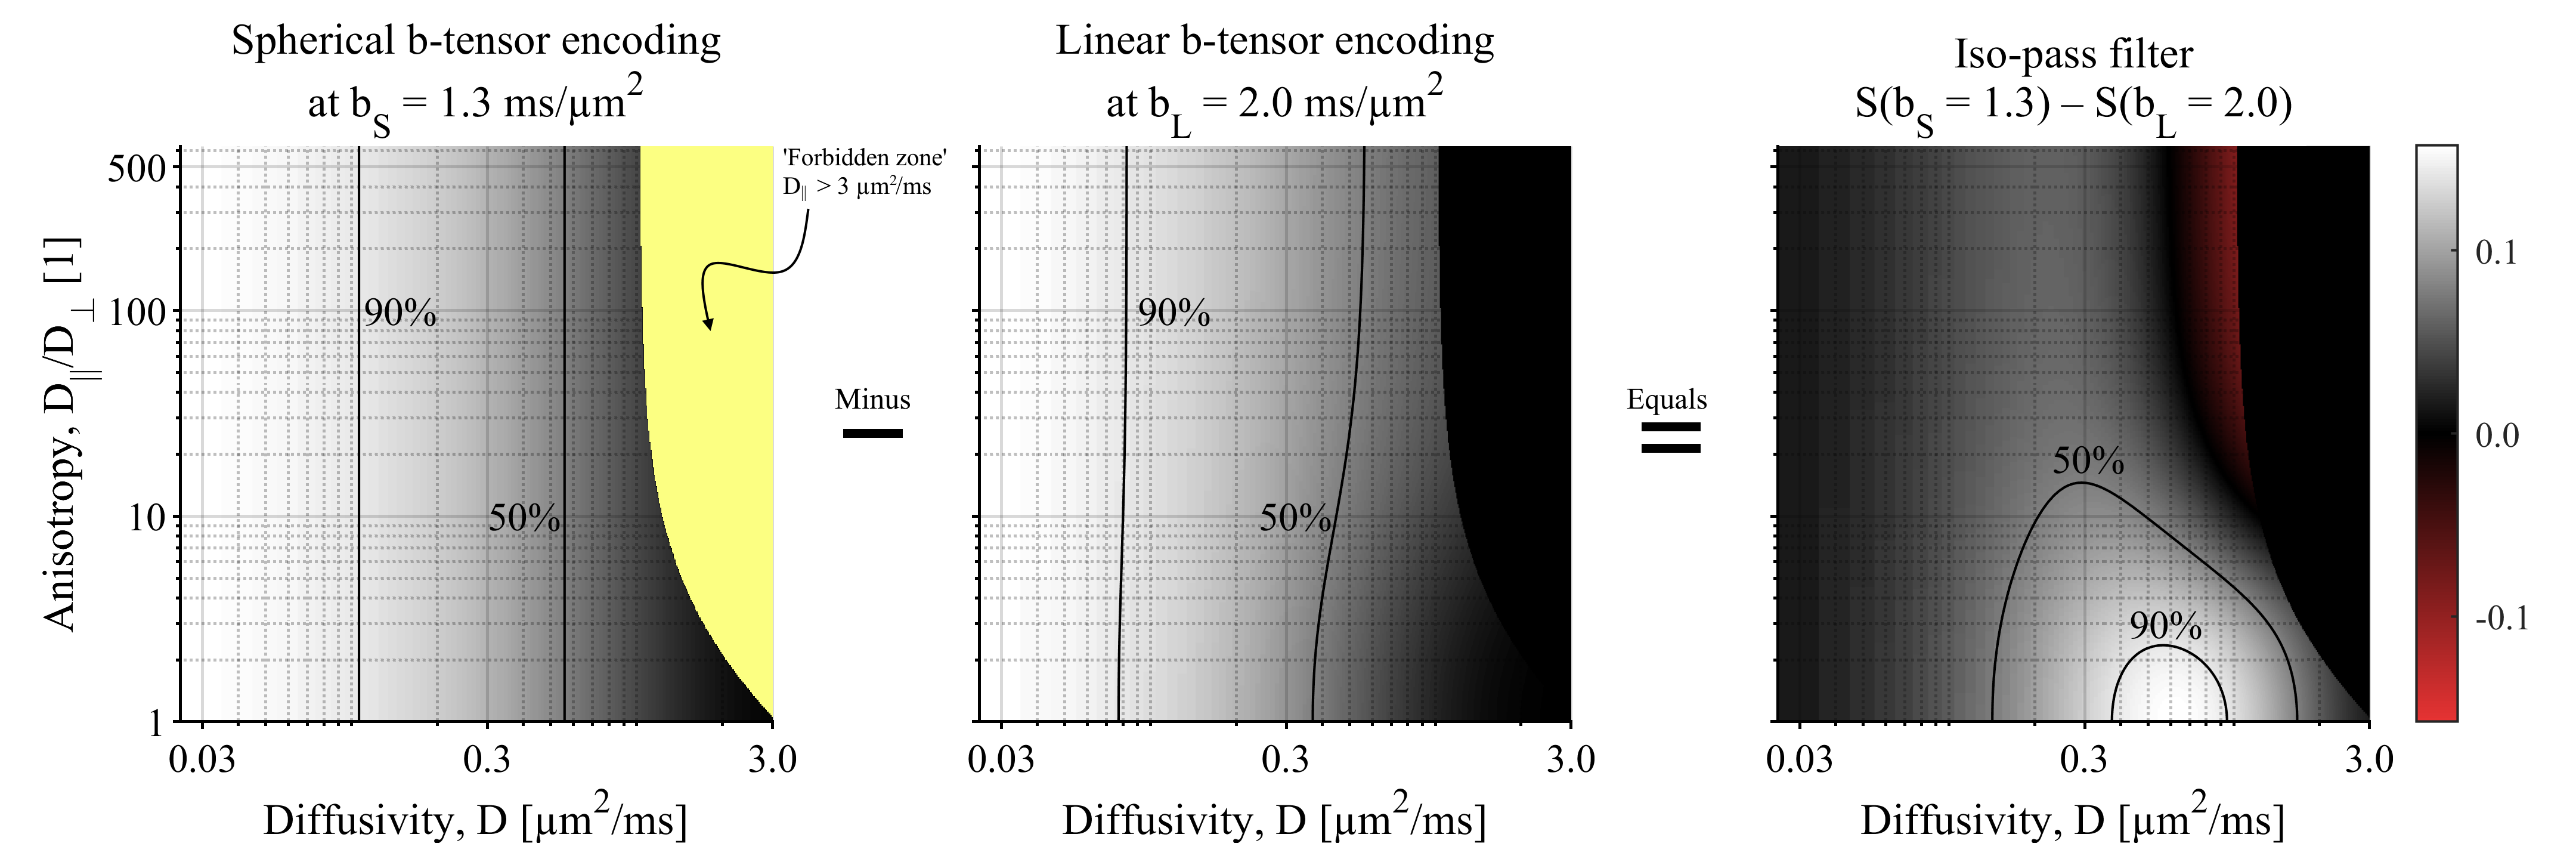
$$$~~~$$$The 'iso-pass filter,' introduced in this work, is generated by subtracting LTE from STE signals at different b-values. The b-values are selected such that the signal$$S_{\mathrm{iso}}(b_{\mathrm{S}},b_{\mathrm{L}})/S_0=\exp(-b_{\mathrm{S}}D)-\sqrt{\pi/4/A}~\exp(-b_{\mathrm{L}}D_{\perp})~\mathrm{erf}(\sqrt{A})$$is close to zero in anisotropic tissues. Thereby the signal will emphasize domains with isotropic diffusion. Naturally, the optimal b-values will depend on the tissue characteristics, but we can establish empirically and from theory that the combination $$$b_{\mathrm{L}}=2~\mathrm{ms/μm}^2$$$ and $$$b_{\mathrm{S}}=1.3~\mathrm{ms/μm}^2$$$ yields the sought contrast in brain.
$$$~~~$$$Finally, the 'dot-pass filter' is achieved by attenuating all but the slowest diffusing components [Tax20]. We do this by using STE at ultra-high encoding strength (e.g. $$$b_{\mathrm{S}}=4~\mathrm{ms/μm}^2$$$ [Vis21]), such that components with relevant diffusivity are removed whereas the dot-fraction remains $$$(0\approx\exp(-bD)\ll\exp(-bD_{\mathrm{dot}})\approx1)$$$. Under these conditions, the remaining signal approaches the dot-signal-fraction $$$(f_{\mathrm{dot}})$$$ [Tax20], according to$$S_{\mathrm{dot}}(b_{\mathrm{S}})/S_0=(1-f_{\mathrm{dot}})\exp(-b_{\mathrm{S}}D)+f_{\mathrm{dot}}\exp(-b_{\mathrm{S}}D_{\mathrm{dot}})\approx f_{\mathrm{dot}}.$$
$$$~~~$$$To support the interpretation of resulting contrasts, we visualize the filters in terms of the remaining signal in the diffusivity-vs.-anisotropy space $$$(D\in[0~3]~\mathrm{μm^2/ms}$$$ vs. $$$D_{||}/D_{\perp}\in[1~500])$$$. As a guiding example, Fig.1 shows the constituent parts, and calculation of, the 'iso-pass filter.'
Methods
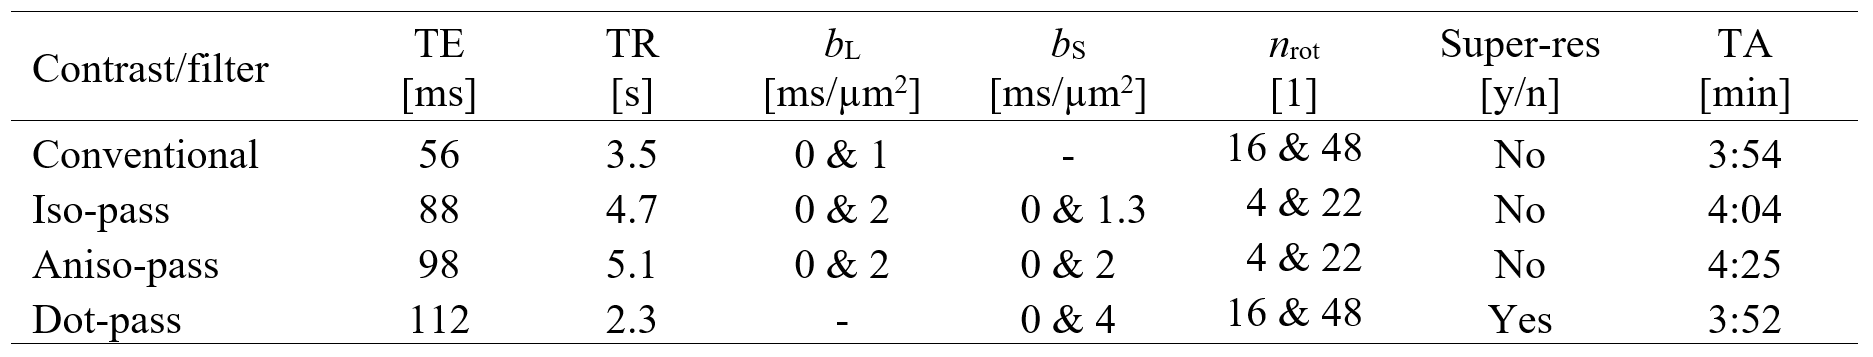
Data was acquired in three healthy volunteers at a 3T MAGNETOM Prisma scanner (Siemens Healthcare, Erlangen, Germany) using a prototype spin-echo with EPI-readout that enables tensor-valued diffusion encoding [Szczepankiewicz19b]. Each filter type was set up with individualized imaging parameters detailed in Table 1. Common parameters were: whole-brain coverage, 2 mm isotopic resolution, and in/through-plane acceleration of 2×2 (GRAPPA). To suppress noise-floor effects at ultra-high b, data for the dot-pass filter was acquired at 2×2×9 mm3 and reconstructed at 2 mm iso using the super-resolution reconstruction described by [Vis21]. Data was denoised [Cordero19] and degibbsed [Kellner16] using MRtrix3 [Tournier19].Results
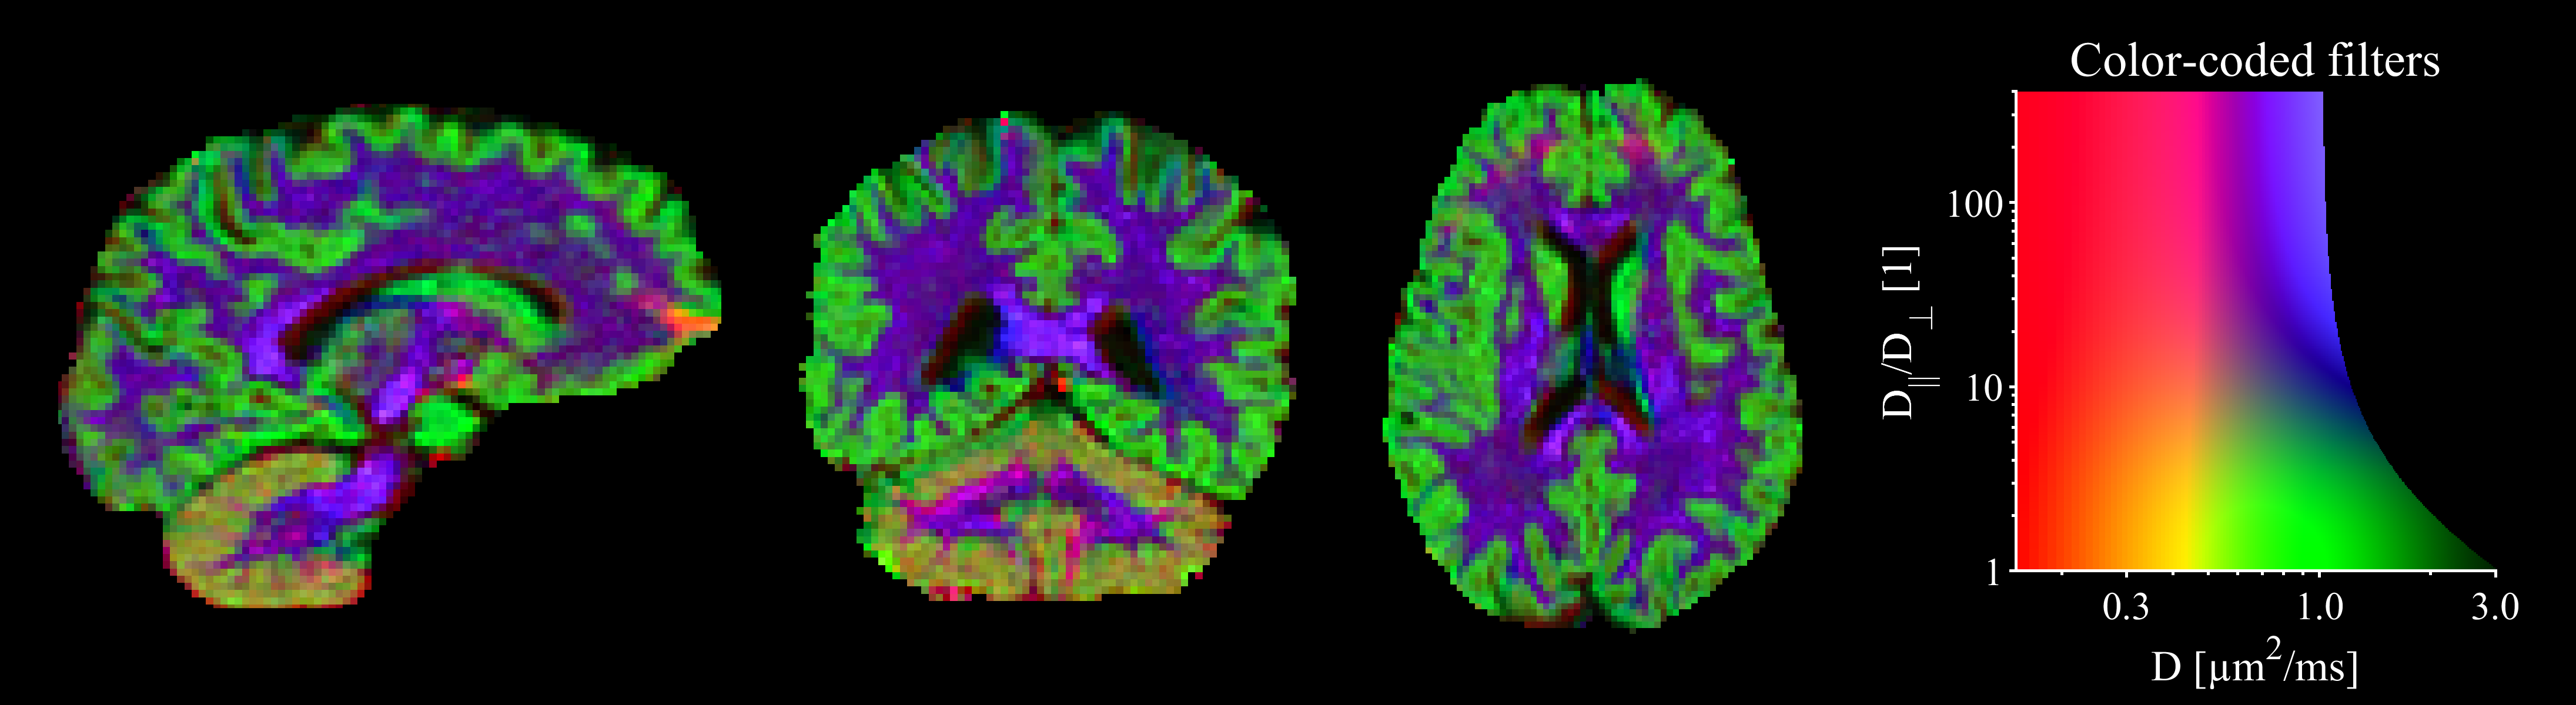
The four contrasts/filters considered herein are shown in Fig.2. The aniso- and iso-pass filters offer contrasts that distinguish gray and white matter, as was expected from the design of the filters. The dot-pass filter is homogeneous throughout the brain parenchyma with the marked exception of cerebellar cortex where the dot-pass filtered signal is prominently elevated. Fig.2 also shows corresponding filter plots which illustrates how signals originating from environments with different diffusion and anisotropy levels are either attenuated (filtered) or retained. We see that conventional encoding is non-specific, whereas aniso-, iso-, and dot-pass filters render signal only from isolated/specific regions of the space.$$$~~~$$$A closer inspection of the iso-pass filter (Fig.3) shows that the combination of b-values should be carefully selected to achieve optimal contrast. Finally, Fig.4 shows that the contrasts can be color-coded and combined in a single image for a complementary visualization of the brain tissues.
Discussion and conclusions
We demonstrated multiple informative dMRI contrasts obtained by simple operations applied to data acquired with tensor-valued diffusion encoding. The meaning of the contrasts is visualized as filters, which to our knowledge, is a novel way of depicting the effect of diffusion weighting. Taken together, the filter construction and visualization may be considered a 'diffusion-filtered imaging' approach.$$$~~~$$$We also propose the novel 'iso-pass filter,' which complements previously described aniso- [Eriksson13] and dot-pass filters [Tax20]. Notably, $$$S_{\mathrm{iso}}$$$ is dissimilar to $$$S_{\mathrm{dot}}$$$ (Fig.1). Therefore, the iso-pass and dot-pass filters contribute complementary information (demonstrated by comparing cerebral and cerebellar cortices in Fig.2 and 4).
$$$~~~$$$The potential value of these contrasts is that they complement conventional dMRI and facilitate more specific, albeit non-quantitative, signal maps that are attractive for clinical/radiological applications. This is further enabled by the short acquisition time and negligible processing time.
Acknowledgements
We thank Siemens Healthcare (Erlangen, Germany) for access to the pulse sequence programming environment. This study was supported by the Swedish Prostate Cancer Federation.References
Callaghan PT, Jolley KW & Lelievre J 1979. Diffusion of Water in the Endosperm Tissue of Wheat Grains as Studied by Pulsed Field Gradient Nuclear Magnetic Resonance. Biophysical Journal 28, 133-141.
Cordero-Grande L, Christiaens D, Hutter J, Price AN & Hajnal JV 2019. Complex diffusion-weighted image estimation via matrix recovery under general noise models. Neuroimage 200, 391-404.
Eriksson S, Lasič S, Nilsson M, Westin CF & Topgaard D 2015. NMR diffusion-encoding with axial symmetry and variable anisotropy: Distinguishing between prolate and oblate microscopic diffusion tensors with unknown orientation distribution. J Chem Phys 142, 104201.
Eriksson S, Lasič S & Topgaard D 2013. Isotropic diffusion weighting in PGSE NMR by magic-angle spinning of the q-vector. J Magn Reson 226, 13-8.
Jeurissen B, Tournier JD, Dhollander T, Connelly A & Sijbers J 2014. Multi-tissue constrained spherical deconvolution for improved analysis of multi-shell diffusion MRI data. Neuroimage 103, 411-426.
Kellner E, Dhital B, Kiselev VG & Reisert M 2016. Gibbs-ringing artifact removal based on local subvoxel-shifts. Magn Reson Med 76, 1574-1581.
Szczepankiewicz F, Hoge S & Westin CF 2019a. Linear, planar and spherical tensor-valued diffusion MRI data by free waveform encoding in healthy brain, water, oil and liquid crystals. Data Brief 25, 104208.
Szczepankiewicz F, Sjölund J, Ståhlberg F, Lätt J & Nilsson M 2019b. Tensor-valued diffusion encoding for diffusional variance decomposition (DIVIDE): Technical feasibility in clinical MRI systems. PLoS One 14, e0214238.
Szczepankiewicz F, Van Westen D, Englund E, et al. 2016. The link between diffusion MRI and tumor heterogeneity: Mapping cell eccentricity and density by diffusional variance decomposition (DIVIDE). Neuroimage 142, 522-532.
Tax CMW, Szczepankiewicz F, Nilsson M & Jones DK 2020. The dot-compartment revealed? Diffusion MRI with ultra-strong gradients and spherical tensor encoding in the living human brain. Neuroimage 116534.
Tournier JD, Smith R, Raffelt D, et al. 2019. MRtrix3: A fast, flexible and open software framework for medical image processing and visualisation. Neuroimage 202, 116137.
Figures