0772
In vivo quantitative laminar R2* and susceptibility imaging at 0.3 mm in-plane resolution
Jiaen Liu1, Peter van Gelderen2, Xu Li3,4, Jacco A. de Zwart2, Kuo-Wei Lai4,5, Jeremias Sulam5, Erin S. Beck6, Serhat V. Okar2, Peter C.M. van Zijl3,4, Daniel S. Reich2, and Jeff H. Duyn2
1Advanced Imaging Research Center, UT Southwestern Medical Center, Dallas, TX, United States, 2National Institute of Neurological Disorders and Stroke, National Institutes of Health, Bethesda, MD, United States, 3Department of Radiology and Radiological Sciences, Johns Hopkins University, Baltimore, MD, United States, 4F.M. Kirby Research Center for Functional Brain Imaging, Kennedy Krieger Institute, Baltimore, MD, United States, 5Department of Biomedical Engineering, Johns Hopkins University, Baltimore, MD, United States, 6Department of Neurology, Icahn School of Medicine at Mount Sinai, New York, NY, United States
1Advanced Imaging Research Center, UT Southwestern Medical Center, Dallas, TX, United States, 2National Institute of Neurological Disorders and Stroke, National Institutes of Health, Bethesda, MD, United States, 3Department of Radiology and Radiological Sciences, Johns Hopkins University, Baltimore, MD, United States, 4F.M. Kirby Research Center for Functional Brain Imaging, Kennedy Krieger Institute, Baltimore, MD, United States, 5Department of Biomedical Engineering, Johns Hopkins University, Baltimore, MD, United States, 6Department of Neurology, Icahn School of Medicine at Mount Sinai, New York, NY, United States
Synopsis
High resolution submillimeter MRI of myelin and iron may enhance our capability to define neural diseases more accurately and at an earlier stage. Susceptibility-weighted MRI methods are intrinsically sensitive to myelin and iron and benefit from the increased contrast-to-noise ratio at 7 T. In this study, we systematically investigated R2* and susceptibility distributions in cortical layers of healthy subjects with 0.3 mm in-plane resolution and 0.4 mm slice thickness. This effort was facilitated by a robust navigator-based motion- and B0-corrected GRE sequence.
Introduction
Myelin and iron play critical roles in maintaining structural integrity and normal function of the brain. Histology has shown heterogeneous distribution of myelin and iron organized in layers at various cortical depths. In vivo imaging of these fine-scale structures at the mesoscopic scale (<0.5 mm), approaching that of histology, can potentially improve characterization of neurological diseases, such as Alzheimer’s disease1, multiple sclerosis2 and epilepsy3, and, if so, lead to more effective treatment planning. In this study, we quantified layer-specific R2* and magnetic susceptibility (χ), both of which are sensitive to myelin and iron, using 0.3x0.3x0.4 mm3 T2*-weighted (T2*w) MRI at 7 T. A navigator-based motion and B0 correction method was used to improve the robustness of high-resolution MRI data4.Methods
Data acquisition and image reconstructionExperiments were performed on a 7 T MRI scanner (Magnetom, Siemens) with a 32-channel head RF receiver array (Nova Medical). Eleven healthy subjects were recruited with signed consent under an IRB-approved protocol. High-resolution dual-echo T2*w data were acquired with 3D GRE. To correct for head motion and B0 fluctuation, a series of volumetric navigator images was obtained using a multi-shot 3D EPI readout at a shorter echo time than that of the T2*w acquisition4. The T2*w data were acquired with the following parameters: resolution=0.3x0.3x0.4 mm3, TE1/TE2/TR=18/39/74 ms, flip angle=14°, bandwidth=54 Hz/pixel, FOV=240x180x32 mm3, SENSE rate=2x1, scan time=35.5 mins. Spatial and temporal resolution of the navigator were 5x5.6x3.2 mm and 0.4 s, respectively. Subjects were asked to stay relaxed during the scans.
T2*w complex images were reconstructed with either correction of motion and spatially linear B0 fluctuation (Correction mode)4,5 or only correction of global average B0 fluctuation (Non-correction mode). T2*w magnitude image was calculated as the mean of magnitude images across echoes. Quantitative susceptibility mapping (QSM) was performed on the T2*w complex data using the JHU/KKI QSM toolbox6–8 including the following steps: Laplacian phase unwrapping 9, combined LBV10 and VSHARP11 for background field removal, and dipole inversion regularized by a learned proximal convolutional neural network (LP-CNN)12.
Data analysis
Blinded review of T2*w images was performed by two experienced image readers. ROIs corresponding to superficial, middle (Line of Gennari), and deep layers were manually segmented in the primary visual cortex based on T2*w image intensity. R2* was quantified using nonlinear least square complex fitting. Potential effect of cortical orientation on R2* and χ was investigated in each ROI using a mixed-effect linear model of y=a1cos(2θ)+a2sin(2θ)+c with subject representing the random effect on a1, a2, and c. Here, θ denotes the angle between normal direction of cortical ribbon and B0, and was calculated using the LAYNII toolbox13.
Results
T2*w magnitude and susceptibility examples in Fig. 1A demonstrate delineation of anatomical details that necessitate high spatial resolution. Correction of motion and B0 fluctuation increased the image quality and delineation of cortical layers, as shown in Figs. 1B and 2. Reducing resolution renders the line of Gennari difficult to observe both visually (Fig. 3) and quantitatively (Fig. 4). At the subject level, ROI-averaged R2* values are distinct at different depths in the primary visual cortex (Fig. 4A). This effect was reduced or diminished without correction and at lower spatial resolution. Similarly, lower resolution reduced χ difference between cortical depths and led to more negative values (Fig. 4B), potentially due to partial volume effect from whiter matter region. Unlike R2*, the ROI-averaged χ distributions exhibit more overlap between different depths. At the group level, a cortex-to-field orientation dependency in the form of cos(2θ) was observed in χ with a peak-to-peak difference of 0.02 ppm (p-values < 1x10⁻⁵) (Fig. 5) but not in R2* (p-values > 0.2).Discussion and Conclusion
In this study, R2* and χ at different layers in the primary visual cortex were investigated with high-resolution MRI at 7 T, enabled by a navigator-based motion- and B0-corrected GRE sequence. Consistent with prior work, distinct R2* and χ were observed between layers. A significant orientation effect (~ 0.02 ppm) was found in cortical χ with sources to be determined in future studies. In vivo high-resolution imaging of R2* and χ, which are related to myelin and iron distribution, can potentially contribute to novel biomarkers sensitive to subtle early-stage pathological changes in neurological disorders and degeneration.Acknowledgements
This work was supported in part by the intramural research program of NINDS, NCRR and NIBIB (P41EB031771) and the startup funding of J.L.References
1. Kenkhuis, B. et al. 7T MRI allows detection of disturbed cortical lamination of the medial temporal lobe in patients with Alzheimer’s disease. Neuroimage Clin 21, 101665 (2019).2. Kilsdonk, I. D. et al. Increased cortical grey matter lesion detection in multiple sclerosis with 7 T MRI: a post-mortem verification study. Brain 139, 1472–1481 (2016).
3. Bartolini, E. et al. Ultra-High-Field Targeted Imaging of Focal Cortical Dysplasia: The Intracortical Black Line Sign in Type IIb. American Journal of Neuroradiology (2019).
4. Liu, J., van Gelderen, P., de Zwart, J. A. & Duyn, J. H. Reducing motion sensitivity in 3D high-resolution T2*-weighted MRI by navigator-based motion and nonlinear magnetic field correction. Neuroimage 206, 116332 (2020).
5. Gretsch, F., Marques, J. P. & Gallichan, D. Investigating the accuracy of FatNav-derived estimates of temporal B0 changes and their application to retrospective correction of high-resolution 3D GRE of the human brain at 7T. Magn Reson Med 80, 585–597 (2018).
6. Bao, L., Li, X., Cai, C., Chen, Z. & van Zijl, P. C. M. Quantitative Susceptibility Mapping Using Structural Feature Based Collaborative Reconstruction (SFCR) in the Human Brain. IEEE Trans Med Imaging 35, 2040–2050 (2016).
7. van Bergen, J. M. G. et al. Quantitative Susceptibility Mapping Suggests Altered Brain Iron in Premanifest Huntington Disease. AJNR Am J Neuroradiol 37, 789–796 (2016).
8. Li, X. et al. Multi-atlas tool for automated segmentation of brain gray matter nuclei and quantification of their magnetic susceptibility. Neuroimage 191, 337–349 (2019).
9. Schofield, M. A. & Zhu, Y. Fast phase unwrapping algorithm for interferometric applications. Opt. Lett., OL 28, 1194–1196 (2003).
10. Zhou, D., Liu, T., Spincemaille, P. & Wang, Y. Background field removal by solving the Laplacian boundary value problem. NMR in Biomedicine 27, 312–319 (2014).
11. Wu, B., Li, W., Guidon, A. & Liu, C. Whole brain susceptibility mapping using compressed sensing. Magn Reson Med 67, 137–147 (2012).
12. Lai, K.-W., Aggarwal, M., van Zijl, P., Li, X. & Sulam, J. Learned Proximal Networks for Quantitative Susceptibility Mapping. arXiv:2008.05024 [cs, eess] (2020).
13. Huber, L. (Renzo) et al. LayNii: A software suite for layer-fMRI. NeuroImage 237, 118091 (2021).
Figures

Fig. 1 (A) One slice of T2*-weighted (T2*w) magnitude and susceptibility data
shows excellent details of fine-scale
anatomies. SWM:
superficial white matter; Put: putamen; Hipp: hippocampus; Gennari: line of
Gennari. (B) Comparison of image quality between correction and non-correction
modes. Yellow arrows point to
line of Gennari and red arrows to the hippocampus.

Fig. 2 Distribution
of average quality score from blinded review by image readers before and after
correction. Evaluation criteria are 4–no artifact, 3–minimal artifact not
affecting structural delineation of intra-cortical or subcortical anatomy, 2–moderate
artifact slightly affecting structural delineation, and 1–severe artifact rendering
it difficult to visualize these fine-scale structures.

Fig. 3 At a
lower isotropic 0.8 mm resolution, the T2*w magnitude image has lost
the capability to delineate the line of Gennari at the intermediate depth of
the primary visual cortex. Images with isotropic 0.5 mm and 0.8 mm resolution
were obtained by downsampling the original 0.3x0.3x0.4 mm3
resolution data.
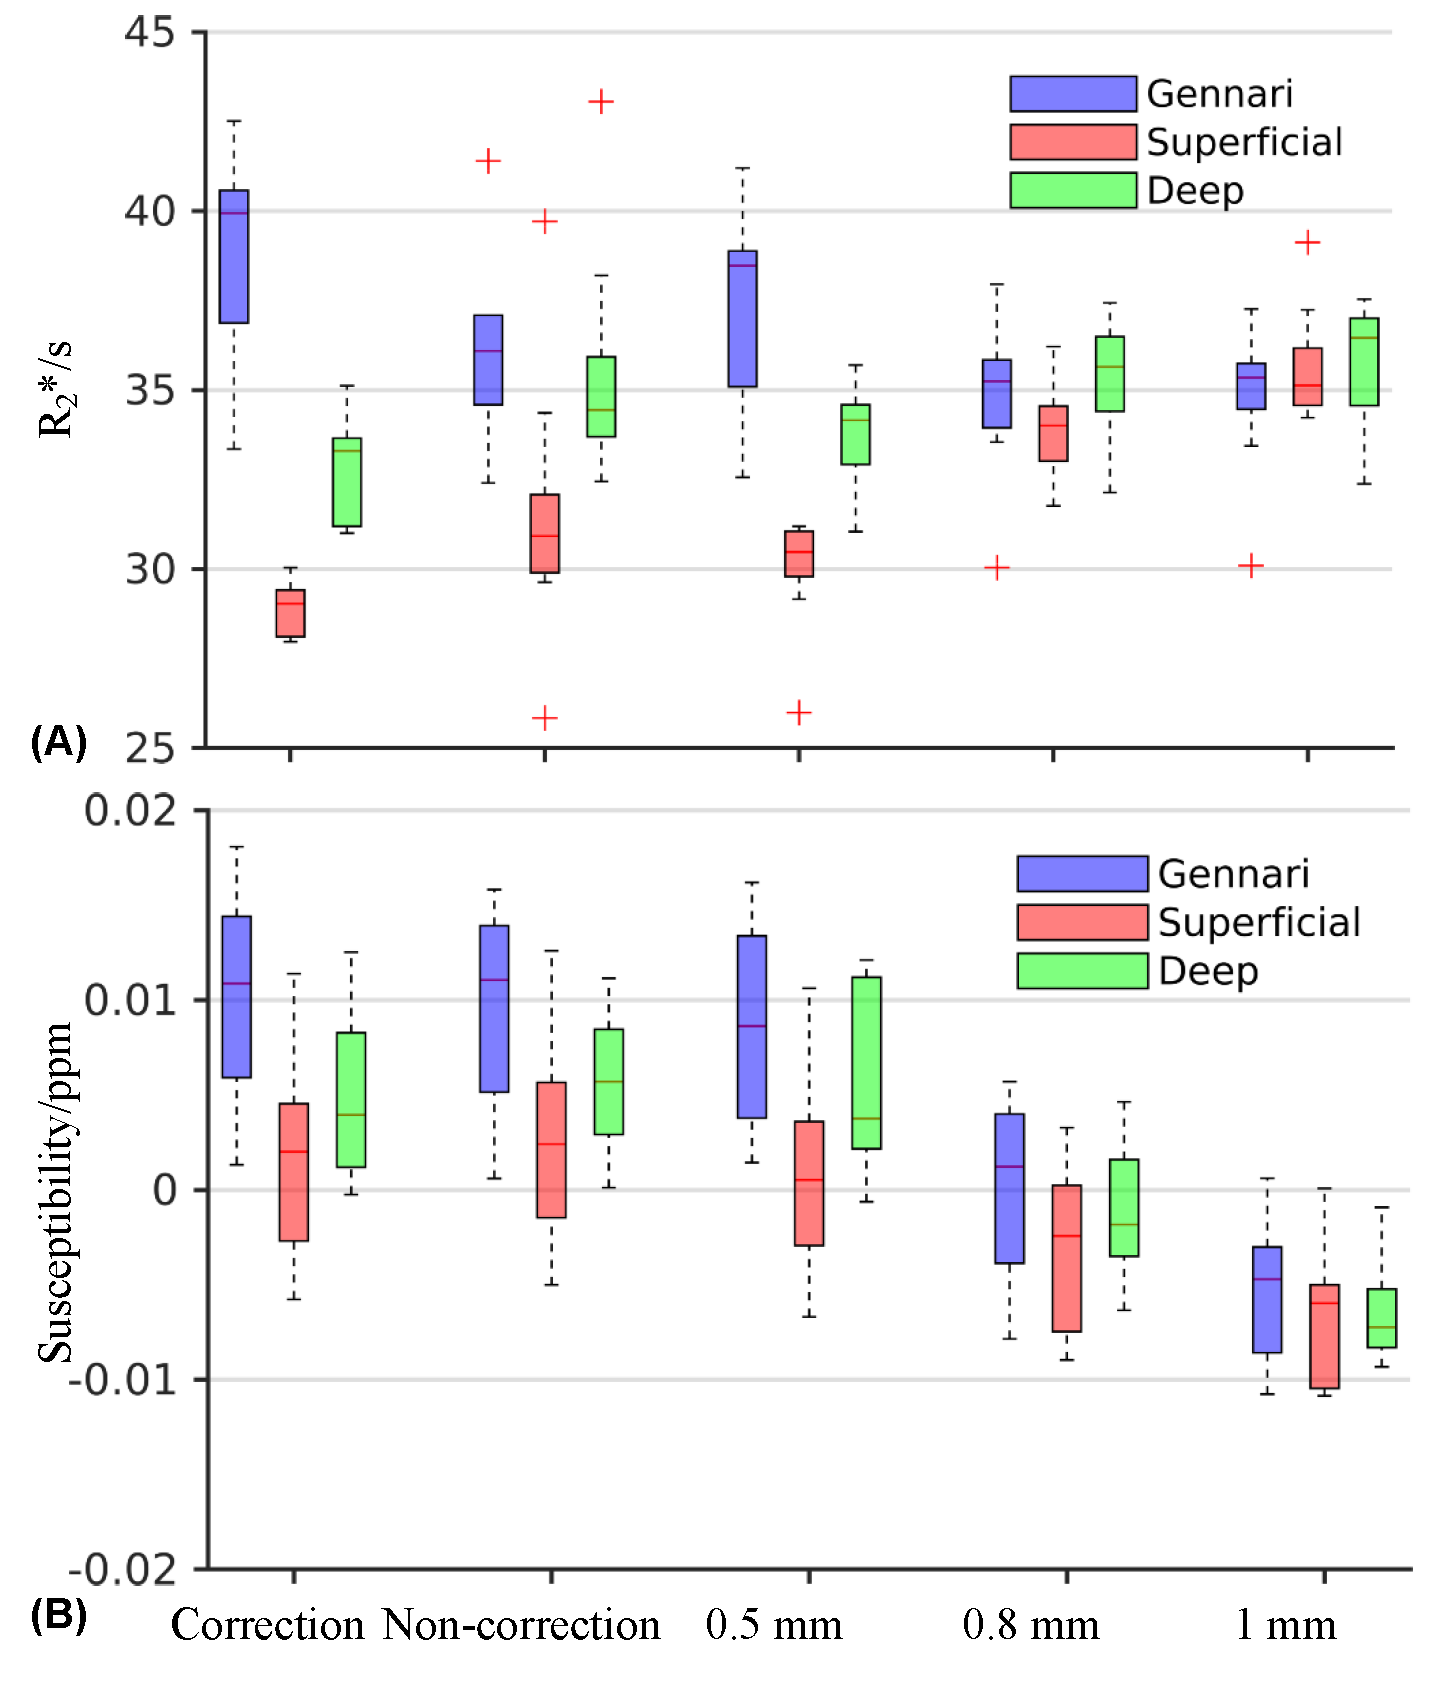
Fig. 4
Effect of correction and resolution on R2* (A) and susceptibility
(B) at different depths in the primary visual cortex. The box plots contain
ROI-averaged R2* and susceptibility from each subject as a function
of correction mode and spatial resolution. The first two columns are presented
in the original 0.3x0.3x0.4 mm3 resolution.
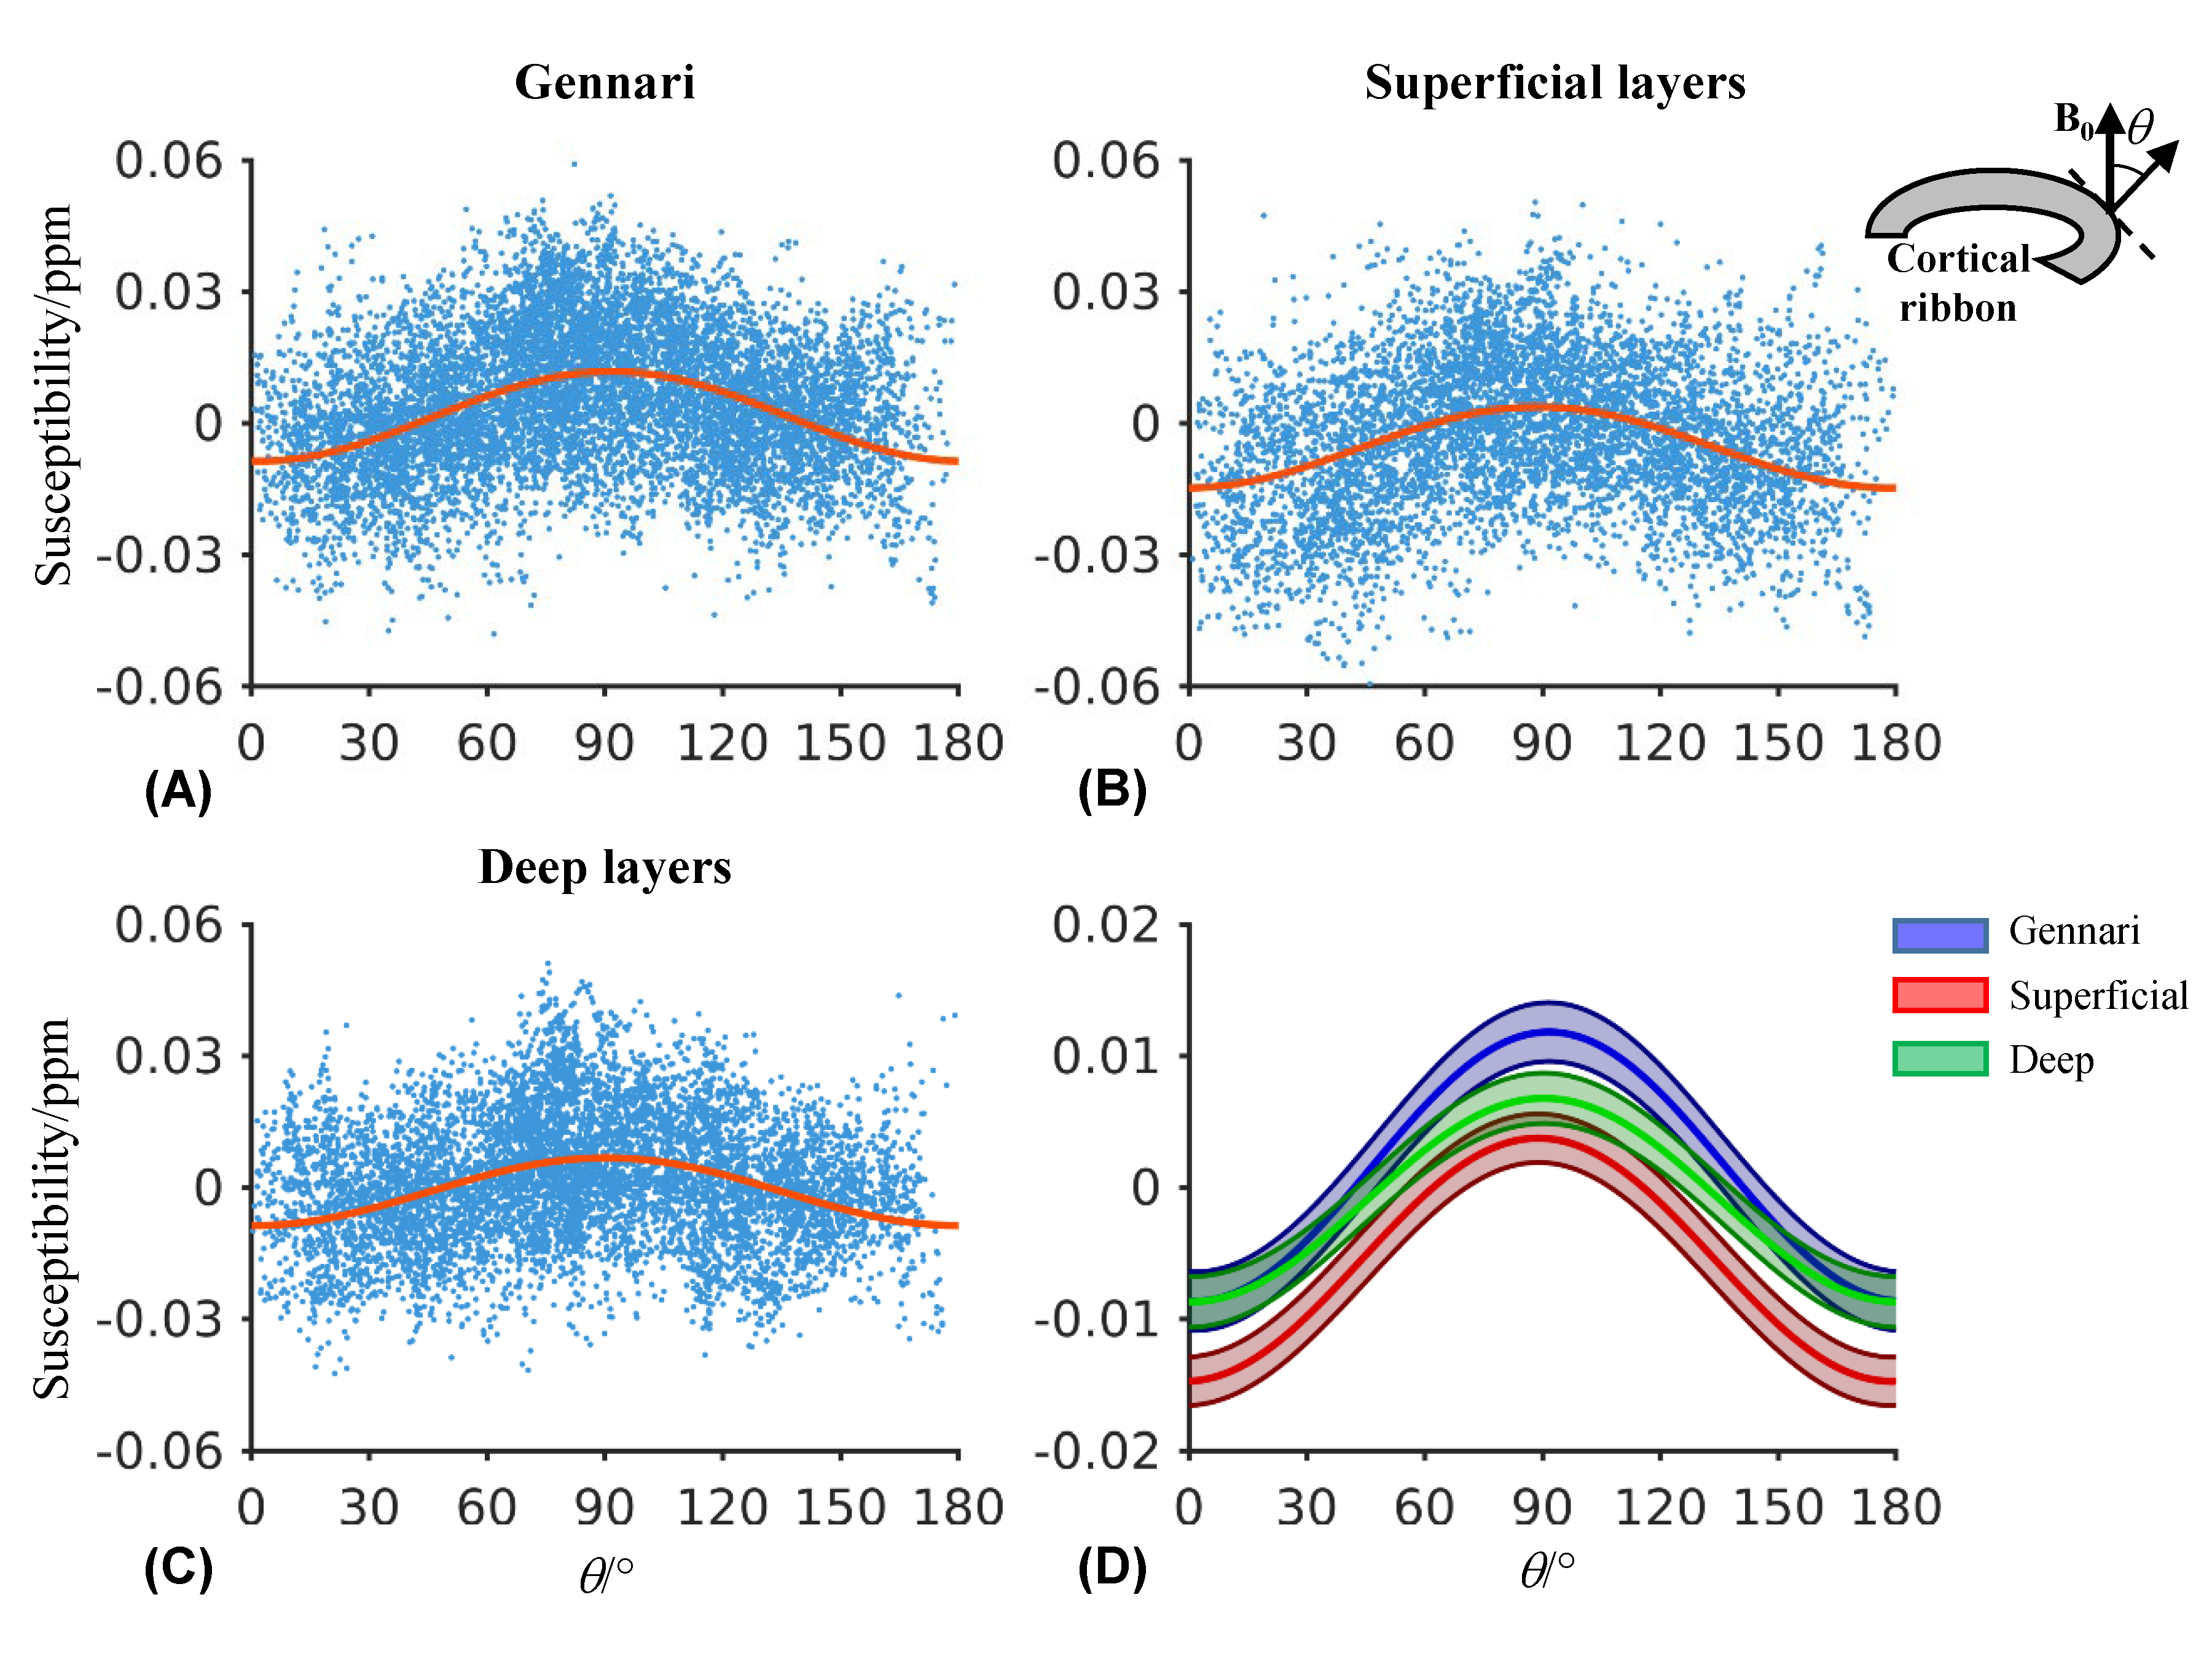
Fig. 5 Susceptibility
shows significant cortical orientation effect. (A-C) Measured voxel-wise (dot)
and group average (line) susceptibility in the ROIs corresponding to different
depths of the primary visual cortex as a function of cortical orientation
relative to B0. (D) Group-average and its standard deviation (color
band) of susceptibility. A significant orientation dependency was observed with
p-values < 1x10⁻⁵ in the coefficient of cos(2θ) for all ROIs.
DOI: https://doi.org/10.58530/2022/0772