0771
chi-separation using multi-orientation data in invivo and exvivo brains: Visualization of histology up to the resolution of 350 μm1Department of Electrical and Computer Engineering, Seoul National University, Seoul, Korea, Republic of, 2National Primate Research Center, Cheongju, Korea, Republic of, 3Korea Radioisotope center for pharmaceuticals, Seoul, Korea, Republic of, 4Chonnam National University Medical School, Gwangju, Korea, Republic of, 5Chonnam National University Hwasun Hospital and Medical School, Gwangju, Korea, Republic of, 6Kangwon National University Hospital, Chuncheon, Korea, Republic of
Synopsis
Recently, the susceptibility source separation method, χ-separation, was suggested to separate paramagnetic and diamagnetic susceptibility distributions in the brain, potentially providing quantitative information of paramagnetic iron and diamagnetic myelin. However, the ill-posed nature of dipole-inversion has hindered accurate estimation and direct comparison with histology. Here, we extended the model for multi-orientation GRE, resolving the ill-posedness. The new model is applied to in-vivo and ex-vivo, revealing exquisite details of susceptibility distribution. When the results are compared to iron and myelin histology, great similarities are observed, suggesting the potentials of χ-separation for non-invasively acquiring three-dimensional histological information of iron and myelin.
Introduction
Recently, the magnetic susceptibility source separation methods1–3 have been developed to separate the contribution of positive and negative susceptibility sources. One of the methods, χ-separation2, has successfully visualized the distribution of two main susceptibility contributors in the brain (i.e., paramagnetic iron and diamagnetic myelin). Therefore, χ-separation potentially provides powerful information to study the brain physiology and pathology related to these two substances. Due to the ill-posed nature of susceptibility mapping, however, the χ-separation maps retain streaking artifacts, that are commonly observed in quantitative susceptibility mapping (QSM)4,5 (Fig. 1a,d,g). These artifacts hamper accurate estimation of the susceptibility sources. In this study, we extended χ-separation to utilize multiple head orientation datasets, resolving the ill-posedness and generating high-quality χ-separation maps. This new method is applied to in-vivo and ex-vivo brains and compared with iron and myelin histology. The new χ-separation maps delineate exquisite details of subcortical structures (e.g., subthalamic nuclei, U-fiber, and substantia nigra), potentially complementing conventional histology by non-invasively acquiring three-dimensional information of iron and myelin.Methods
Multi-orientation χ-separationWhen assuming isotropic susceptibility effects on both magnitude6 and phase7 of an MRI signal, the conventional χ-separation method2 can be extended for multi-orientation data as the following:
$$argmin_{\chi_{pos}.\chi_{neg}}\left\|\begin{bmatrix}\triangle{f_1}\\\triangle{f_2}\\{\vdots}\\\triangle{f_N}\end{bmatrix}-\begin{bmatrix}D_1&D_1\\D_2&D_2\\{\vdots}&{\vdots}\\D_N&D_N\end{bmatrix}\begin{bmatrix}\chi_{pos}\\\chi_{neg}\\\end{bmatrix}\right\| ^2+\left\|\begin{bmatrix}R'_{2,1}\\{R'_{2,2}}\\{\vdots}\\R'_{2,N}\end{bmatrix}-\begin{bmatrix}\overline{D_{r,pos}}&-\overline{D_{r,neg}}\\\overline{D_{r,pos}}&-\overline{D_{r,neg}}\\{\vdots}&{\vdots}\\\overline{D_{r,pos}}&-\overline{D_{r,neg}}\end{bmatrix}\begin{bmatrix}\chi_{pos}\\\chi_{neg}\\\end{bmatrix}\right\|^2.{\qquad}[Eq. 1]$$
where $$$\triangle{f_k}$$$ and $$$R'_{2,k}$$$ denotes frequency shift and R2' (=1/T2*−1/T2) acquired at kth head orientation, Dk is a magnetic dipole kernel defined by kth B0 orientation8, and $$$\chi_{pos/neg}$$$ and $$$\overline{D_{r,pos/neg}}$$$ indicate the positive/negative susceptibility and its relaxometric constant, respectively2. To find a solution with physical constraints (χpos≥0, χneg<0) satisfied, an iterative conjugate gradient method is applied and the values violating the constraints are set as zero at every iteration.
In-vivo MRI data acquisition
In six subjects, 1-mm-isotropic resolution multi-echo gradient-echo (MEGE) datasets at six head orientations were acquired at 3T as in (9). For R2, 2D multi-echo spin-echo (MESE) dataset were acquired in the same volunteers (resolution=1×1×2 mm3, TR/TE=7800/15:15:90 ms, and parallel-imaging factor=2). T1-weighted images were acquired using MPRAGE sequence10 (resolution=1×1×1 mm3, TR/TI=2400/1000 ms, and parallel-imaging factor=2).
Ex-vivo MRI data acquisition
To visualize subthalamic nucleus and compare the results with histology, a postmortem brain sample was scanned at 9.4T ([3D MEGE] resolution=350×350×350 μm3, TR/TE=45/3.7:5.5:31 ms, and 8 tissue orientations; [3D MESE] resolution=350×350×350 μm3, and TR/TE = 350/3.7:5.5:31 ms).
Results
The single-orientation in-vivo χ-separation maps display streaking artifacts, which share the same locations and signs with those in the single-orientation QSM map (Fig. 1). The proposed multi-orientation χ-separation algorithm removes these artifacts, and the new positive and negative susceptibility maps demonstrate great similarity to the literature images of iron and myelin histology12 (Fig. 1-2). When the total susceptibility map is compared to the multi-orientation QSM map, they show almost identical susceptibility distributions (Fig. 2e-i). In the ROI analysis, the Bland-Altman plot comparing multi-orientation χtot and QSM quantitatively confirm the negligible biases across the ROIs (difference=−3±8 ppb; Fig. 3a). The mean and STD of χ-separation and QSM values in each ROI are summarized in Fig 3b.In Figure 4, the multi-orientation χ-separation results reveal well-known histology of iron and myelin of the brain12–15. In substantia nigra (slice #1), χpos boundary mismatches for that of χneg map (Fig. 4; red outlines), expanding toward antero-lateral side. This observation highly corresponds to the previously reported myelin and iron distributions14. Superficial WM (SWM; slices 3 and 4), known to have abundant iron and myelin13, demonstrate hyperintensity not only in the χpos map but also in the χneg map, while the negative part of QSM has different boundaries mostly due to the partial volume effects of subcortical iron (Fig. 4; white arrows). In the same locations, single-orientation χneg maps demonstrate artifact-related nonuniform intensity in WM. The T1-weighted image also confirms multi-orientation χneg map better delineates the WM/GM boundaries (all slices). This anatomical evidence in the 𝜒-separation maps suggests the successful separation of the positive and negative susceptibility sources using the multi-orientation χ-separation algorithm.
When the multi-orientation χneg results in the postmortem thalamus were compared to thalamus atlas based on myelin staining16, exquisite details of subthalamic anatomy are delineated at the resolution of 350 μm (Fig. 5), demonstrating the effectiveness of the method to visualize myelin distribution even in the brain nuclei containing abundant iron and myelin.
Discussion and conclusion
The new χ-separation method using multi-orientation data demonstrates exquisite anatomical details in in-vivo and ex-vivo brains. In WM areas, the assumption of the model, isotropic susceptibility, would not strictly hold due to myelinated fibers, and the model needs to be extended to include the effects of anisotropic susceptibility etc. Future in-vivo applications is limited because of multiple measurements, but this challenge can be resolved using a deep neural network as demonstrated in QSMnet17. The ex-vivo results successfully delineate myelin distribution, suggesting a method to acquire three-dimensional histological information at hundreds of micrometer resolution.Acknowledgements
The research resources (human brain tissue) were provided by Korea Brain Bank Network operated through National Brain Bank Project funded by the Ministry of Science and ICT(21-BR-09-01). We thank Institute for Basic Science Center for Neuroscience Imaging Research (IBS-R015-D1) for providing MRI time and professional technical support. This work has been supported by the National Research Foundation of Korea(NRF) grants funded by the Korea government(MSIT) (No. 2021M3E5D2A01024795 and NRF-2021R1A2B5B03002783).References
1. Emmerich J, Bachert P, Ladd ME, Straub S. On the separation of susceptibility sources in quantitative susceptibility mapping: Theory and phantom validation with an in vivo application to multiple sclerosis lesions of different age. J Magn Reson 2021; 330:107033.
2. Shin H-G, Lee J, Yun YH, et al. χ-separation: Magnetic susceptibility source separation toward iron and myelin mapping in the brain. Neuroimage 2021; 240:118371.
3. Chen J, Gong N-J, Chaim KT, Otaduy MCG, Liu C. Decompose quantitative susceptibility mapping (QSM) to sub-voxel diamagnetic and paramagnetic components based on gradient-echo MRI data. Neuroimage 2021; 242:118477.
4. Shmueli K, Zwart JA de, Gelderen P van, Li T-Q, Dodd SJ, Duyn JH. Magnetic susceptibility mapping of brain tissue in vivo using MRI phase data. Magnet Reson Med 2009; 62:1510–1522.
5. Rochefort L de, Brown R, Prince MR, Wang Y. Quantitative MR susceptibility mapping using piece-wise constant regularized inversion of the magnetic field. Magnet Reson Med 2008; 60:1003–1009.
6. Yablonskiy DA, Haacke EM. Theory of NMR signal behavior in magnetically inhomogeneous tissues: The static dephasing regime. Magnet Reson Med 1994; 32:749 763.
7. Liu T, Spincemaille P, Rochefort L de, Kressler B, Wang Y. Calculation of susceptibility through multiple orientation sampling (COSMOS): A method for conditioning the inverse problem from measured magnetic field map to susceptibility source image in MRI. Magnet Reson Med 2009; 61:196–204.
8. Salomir R, Senneville BD de, Moonen CT. A fast calculation method for magnetic field inhomogeneity due to an arbitrary distribution of bulk susceptibility. Concepts Magnetic Reson Part B Magnetic Reson Eng 2003; 19B:26 34
9. Feng R, Zhao J, Wang H, et al. MoDL-QSM: Model-based deep learning for quantitative susceptibility mapping. Neuroimage 2021; 240:118376.
10. Mugler JP, Brookeman JR. Three-dimensional magnetization-prepared rapid gradient-echo imaging (3D MP RAGE). Magnet Reson Med 1990; 15:152–157.
11. Liu Z, Spincemaille P, Yao Y, Zhang Y, Wang Y. MEDI+0: Morphology enabled dipole inversion with automatic uniform cerebrospinal fluid zero reference for quantitative susceptibility mapping. Magnet Reson Med 2018; 79:2795 2803.
12. Bossoni L, Hegeman‐Kleinn I, Duinen SG, et al. Off‐resonance saturation as an MRI method to quantify mineral‐ iron in the post‐mortem brain. Magnet Reson Med 2021
13. Kirilina E, Helbling S, Morawski M, et al. Superficial white matter imaging: Contrast mechanisms and whole-brain in vivo mapping. Sci Adv 2020; 6:eaaz9281.
14. Lee H, Baek S-Y, Kim E-J, Huh GY, Lee J-H, Cho H. MRI T2 and T2* relaxometry to visualize neuromelanin in the dorsal substantia nigra pars compacta. Neuroimage 2020; 211:116625.
15. Lee H, Baek S-Y, Chun SY, Lee J-H, Cho H. Specific visualization of neuromelanin-iron complex and ferric iron in the human post-mortem substantia nigra using MR relaxometry at 7T. Neuroimage 2018; 172:874–885.
16. Schaltenbrand G, Wahren W. Atlas for Stereotaxy of the Human Brain. 1977
17. Yoon J, Gong E, Chatnuntawech I, et al. Quantitative susceptibility mapping using deep neural network: QSMnet. Neuroimage 2018; 179:199–206.
18. Hametner S, Bianco AD, Trattnig S, Lassmann H. Iron related changes in MS lesions and their validity to characterize MS lesion types and dynamics with Ultra‐high field magnetic resonance imaging. Brain Pathol 2018; 28:743–749.
Figures
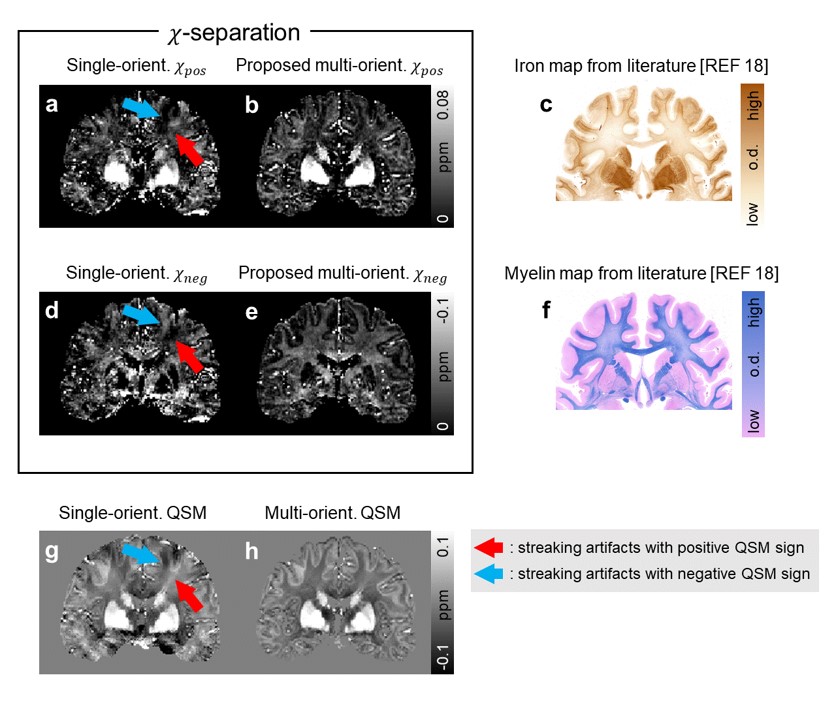
Fig. 1. Positive and negative susceptibility maps from a single orientation (a, d) show streaking artifacts, which are observed in the single-orientation QSM map (g; blue and red arrows; same location with same sign). The multi-orientation measurements significantly reduce the artifacts in both 𝜒-separation and QSM maps (b, e, h). Compared to the conventional single-orientation results, the multi-orientation positive and negative susceptibility maps (b, e) show greater similarity to the iron and myelin histology images (c, f) from the literature18.
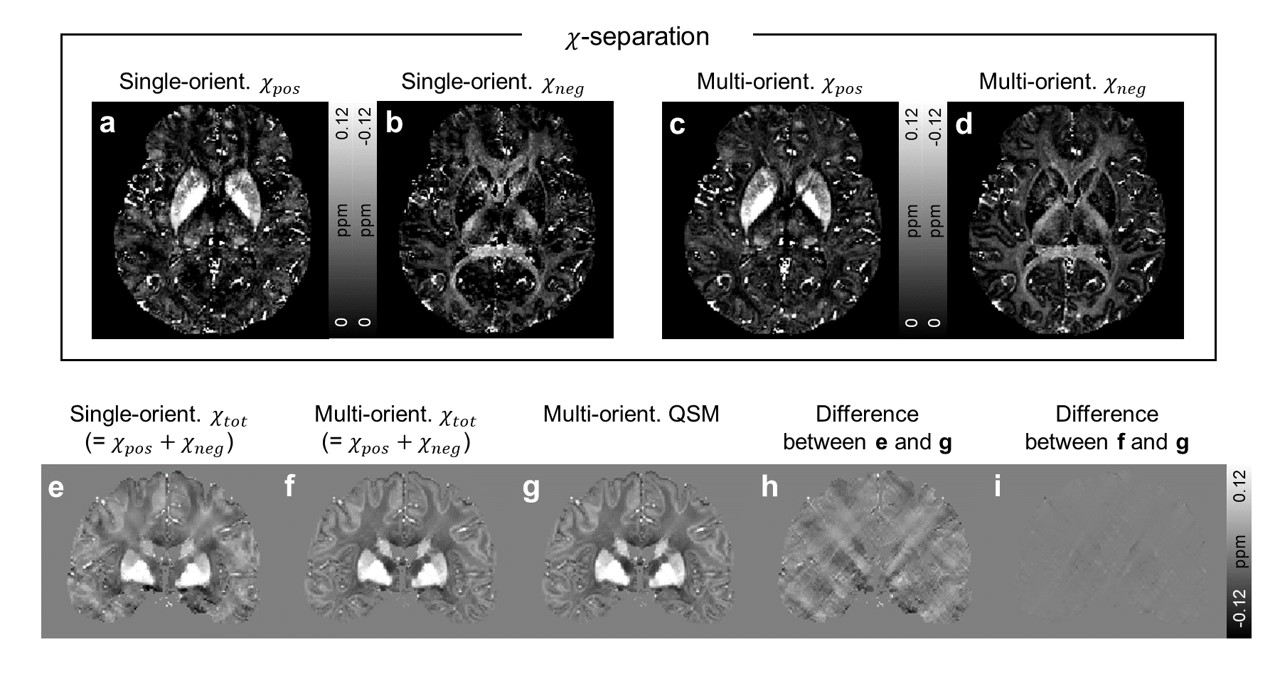
Fig. 2. Positive (a, c) and negative (b, d) susceptibility maps delineate iron-rich brain nuclei (e.g., basal ganglia, U-fiber, and subthalamic nucleus of pulvinar) and white matter fiber bundles (e.g., optic radiation, splenium, and internal capsule). When the χtot (=χpos+χneg) maps (e, f) are compared to the multi-orientation QSM map (g), the multi-orientation 𝜒-separation (f) shows almost the same susceptibility distribution with little error (i), substantially different from the single head orientation result (h).
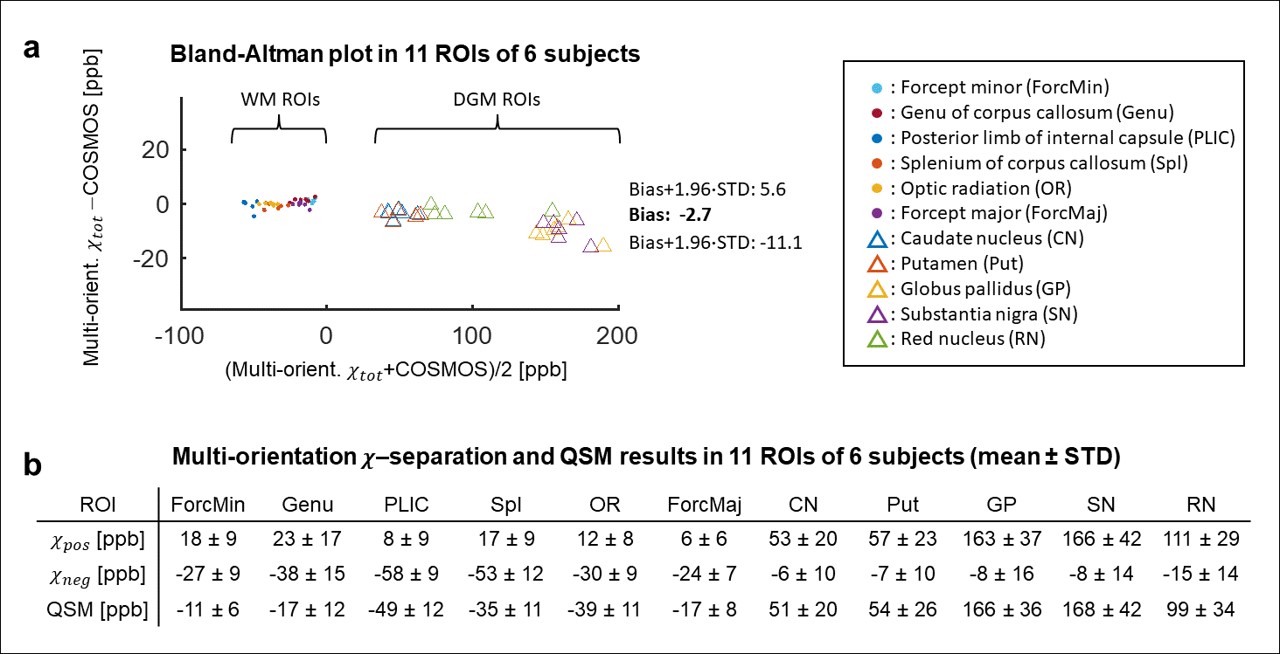
Fig. 3. (a) Bland-Altman plot comparing multi-orientation total susceptibility from 𝜒-separation and QSM in 11 ROIs of the six subjects. The plot confirms a highly quantitative correspondence between the multi-orientation 𝜒-separation map and the multi-orientation QSM map, reporting small bias (= -3 ± 8 ppb; see susceptibility values in the table below for comparison). (b) Mean ± STD of the 𝜒-separation and QSM values in all ROI.
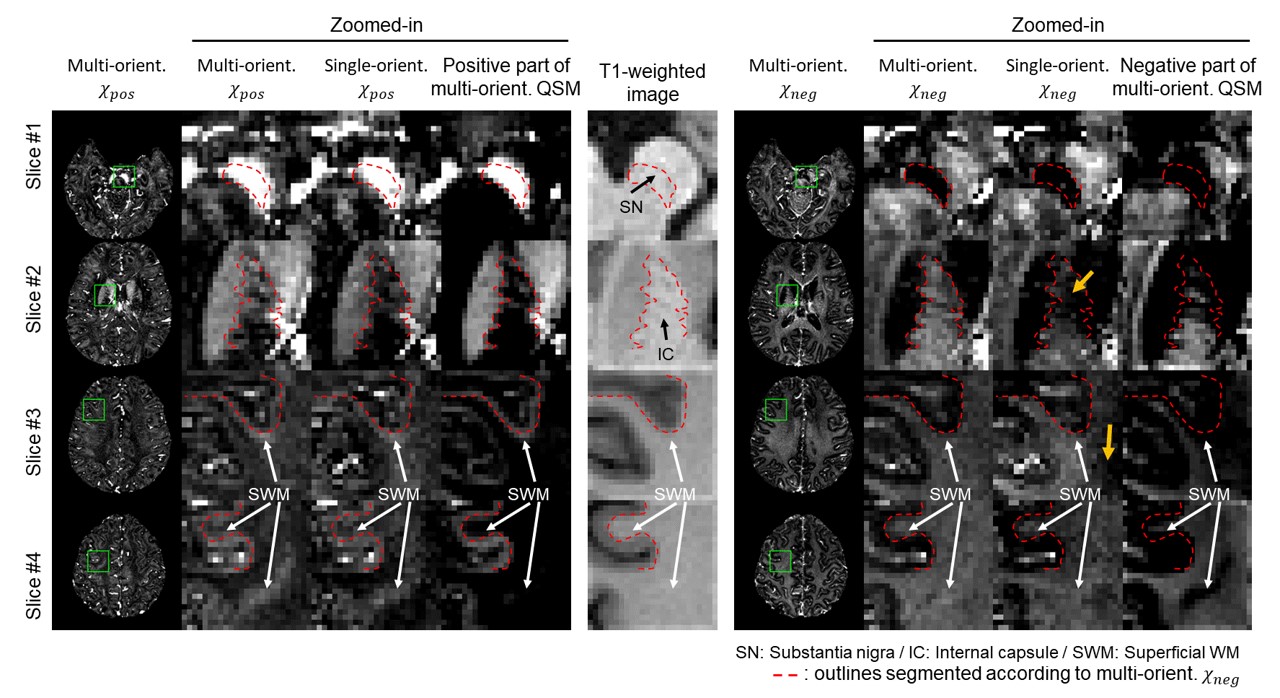
Fig. 4. Maps of multi-orientation (MO) 𝜒-separation, single-orientation (SO) 𝜒-separation, and thresholded QSM maps. The boundaries of the MO 𝜒neg map (red lines) highly match not only for WM/GM boundaries in the T1w image (Slice #2-4) but also for previous reports of iron and myelin histology in SN, IC, and SWM12–15. On the other hand, the SO 𝜒neg map shows inhomogeneous intensity in WM (orange arrows) mostly due to streaking artifacts and susceptibility anisotropy. The negative part of QSM map has mismatches in WM/GM boundary in the T1w images, and iron and myelin histology12–15.
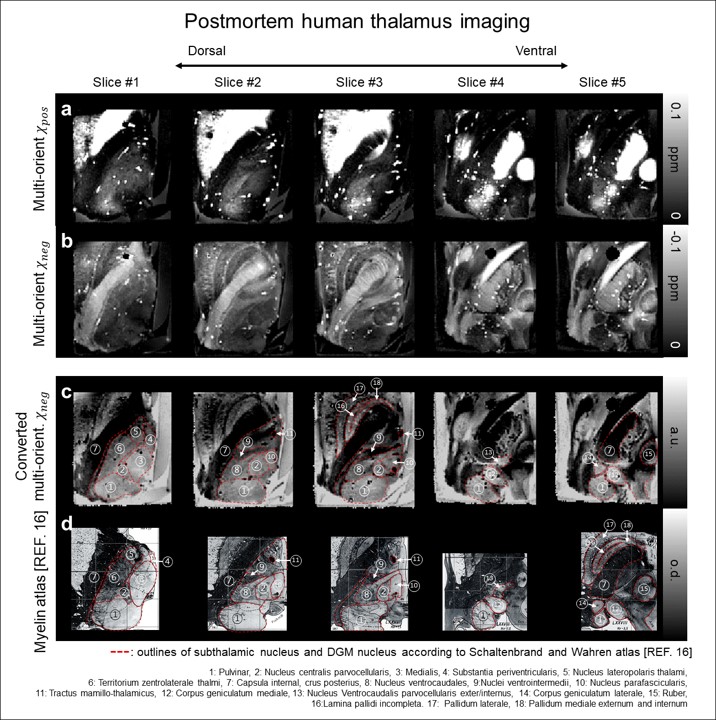
Fig. 5. The 350-μm-isotropic resolution multi-orientation 𝜒-separation results of the postmortem human thalamus specimen (a, b), where iron and myelin co-exist. When the negative susceptibility maps are converted to optical density using Beer-Lambert law and the results (c) are compared with myelin histology from literature16 (d), they display exquisite details of myelin distribution and clearly delineate subthalamic nuclei (red outlines; Schaltenbrand et al. atlas16).