0770
DECOMPOSE-STI: decompose sub-voxel diamagnetic and paramagnetic susceptibility tensors1Electrical Engineering and Computer Sciences, University of California, Berkeley, Berkeley, CA, United States, 2Max Planck Institute for Human Cognitive and Brain Sciences, Leipzig, Germany, 3Max Planck Institute for Evolutionary Anthropology, Leipzig, Germany, 4Taï Chimpanzee Project, Centre Suisse de Recherches Scientifiques en Côte d’Ivoire, Abidjan, Cote D'ivoire, 5Helen Wills Neuroscience Institute, University of California, Berkeley, Berkeley, CA, United States
Synopsis
We investigate susceptibility tensor imaging (STI) reconstruction by separating the diamagnetic from paramagnetic susceptibility tensors using the recently introduced DECOMPOSE method. The resulting para-/diamagnetic susceptibility tensors produce spatially more coherent eigenvectors than conventional STI and it shows the potential to reduce the number of orientations needed for STI.
Introduction
Biological tissue’s magnetic susceptibility can be measured non-invasively through an MRI technique referred to as quantitative susceptibility mapping (QSM)1,2. With multi-orientation measurements, the second order susceptibility information can be measured using the susceptibility tensor model. Susceptibility tensor imaging (STI)3 measures the susceptibility anisotropy based on GRE at multiple field orientations. It has been shown that STI can reflect the orientations of white matter (WM) tracts and fibers4–6. Various approaches7,8 have been proposed to improve the robustness of reconstructing STI as well as to reconstruct reliable tensors with as few orientations as possible. However, none of these approaches addresses the coexistence of paramagnetic and diamagnetic (with respect to the reference species) susceptibility sources within a voxel. Here, we present a separation of diamagnetic and paramagnetic tensors within a voxel using the newly developed DECOMPOSE QSM technique9. DECOMPOSE alleviates the issue of signal cancellation caused by colocalization of para-/diamagnetic species to a certain extend. Therefore, using separated para-/diamagnetic component susceptibility (PCS/DCS) maps from DECOMPOSE is expected to improve the robustness and reliability of the tensor reconstruction.Methods
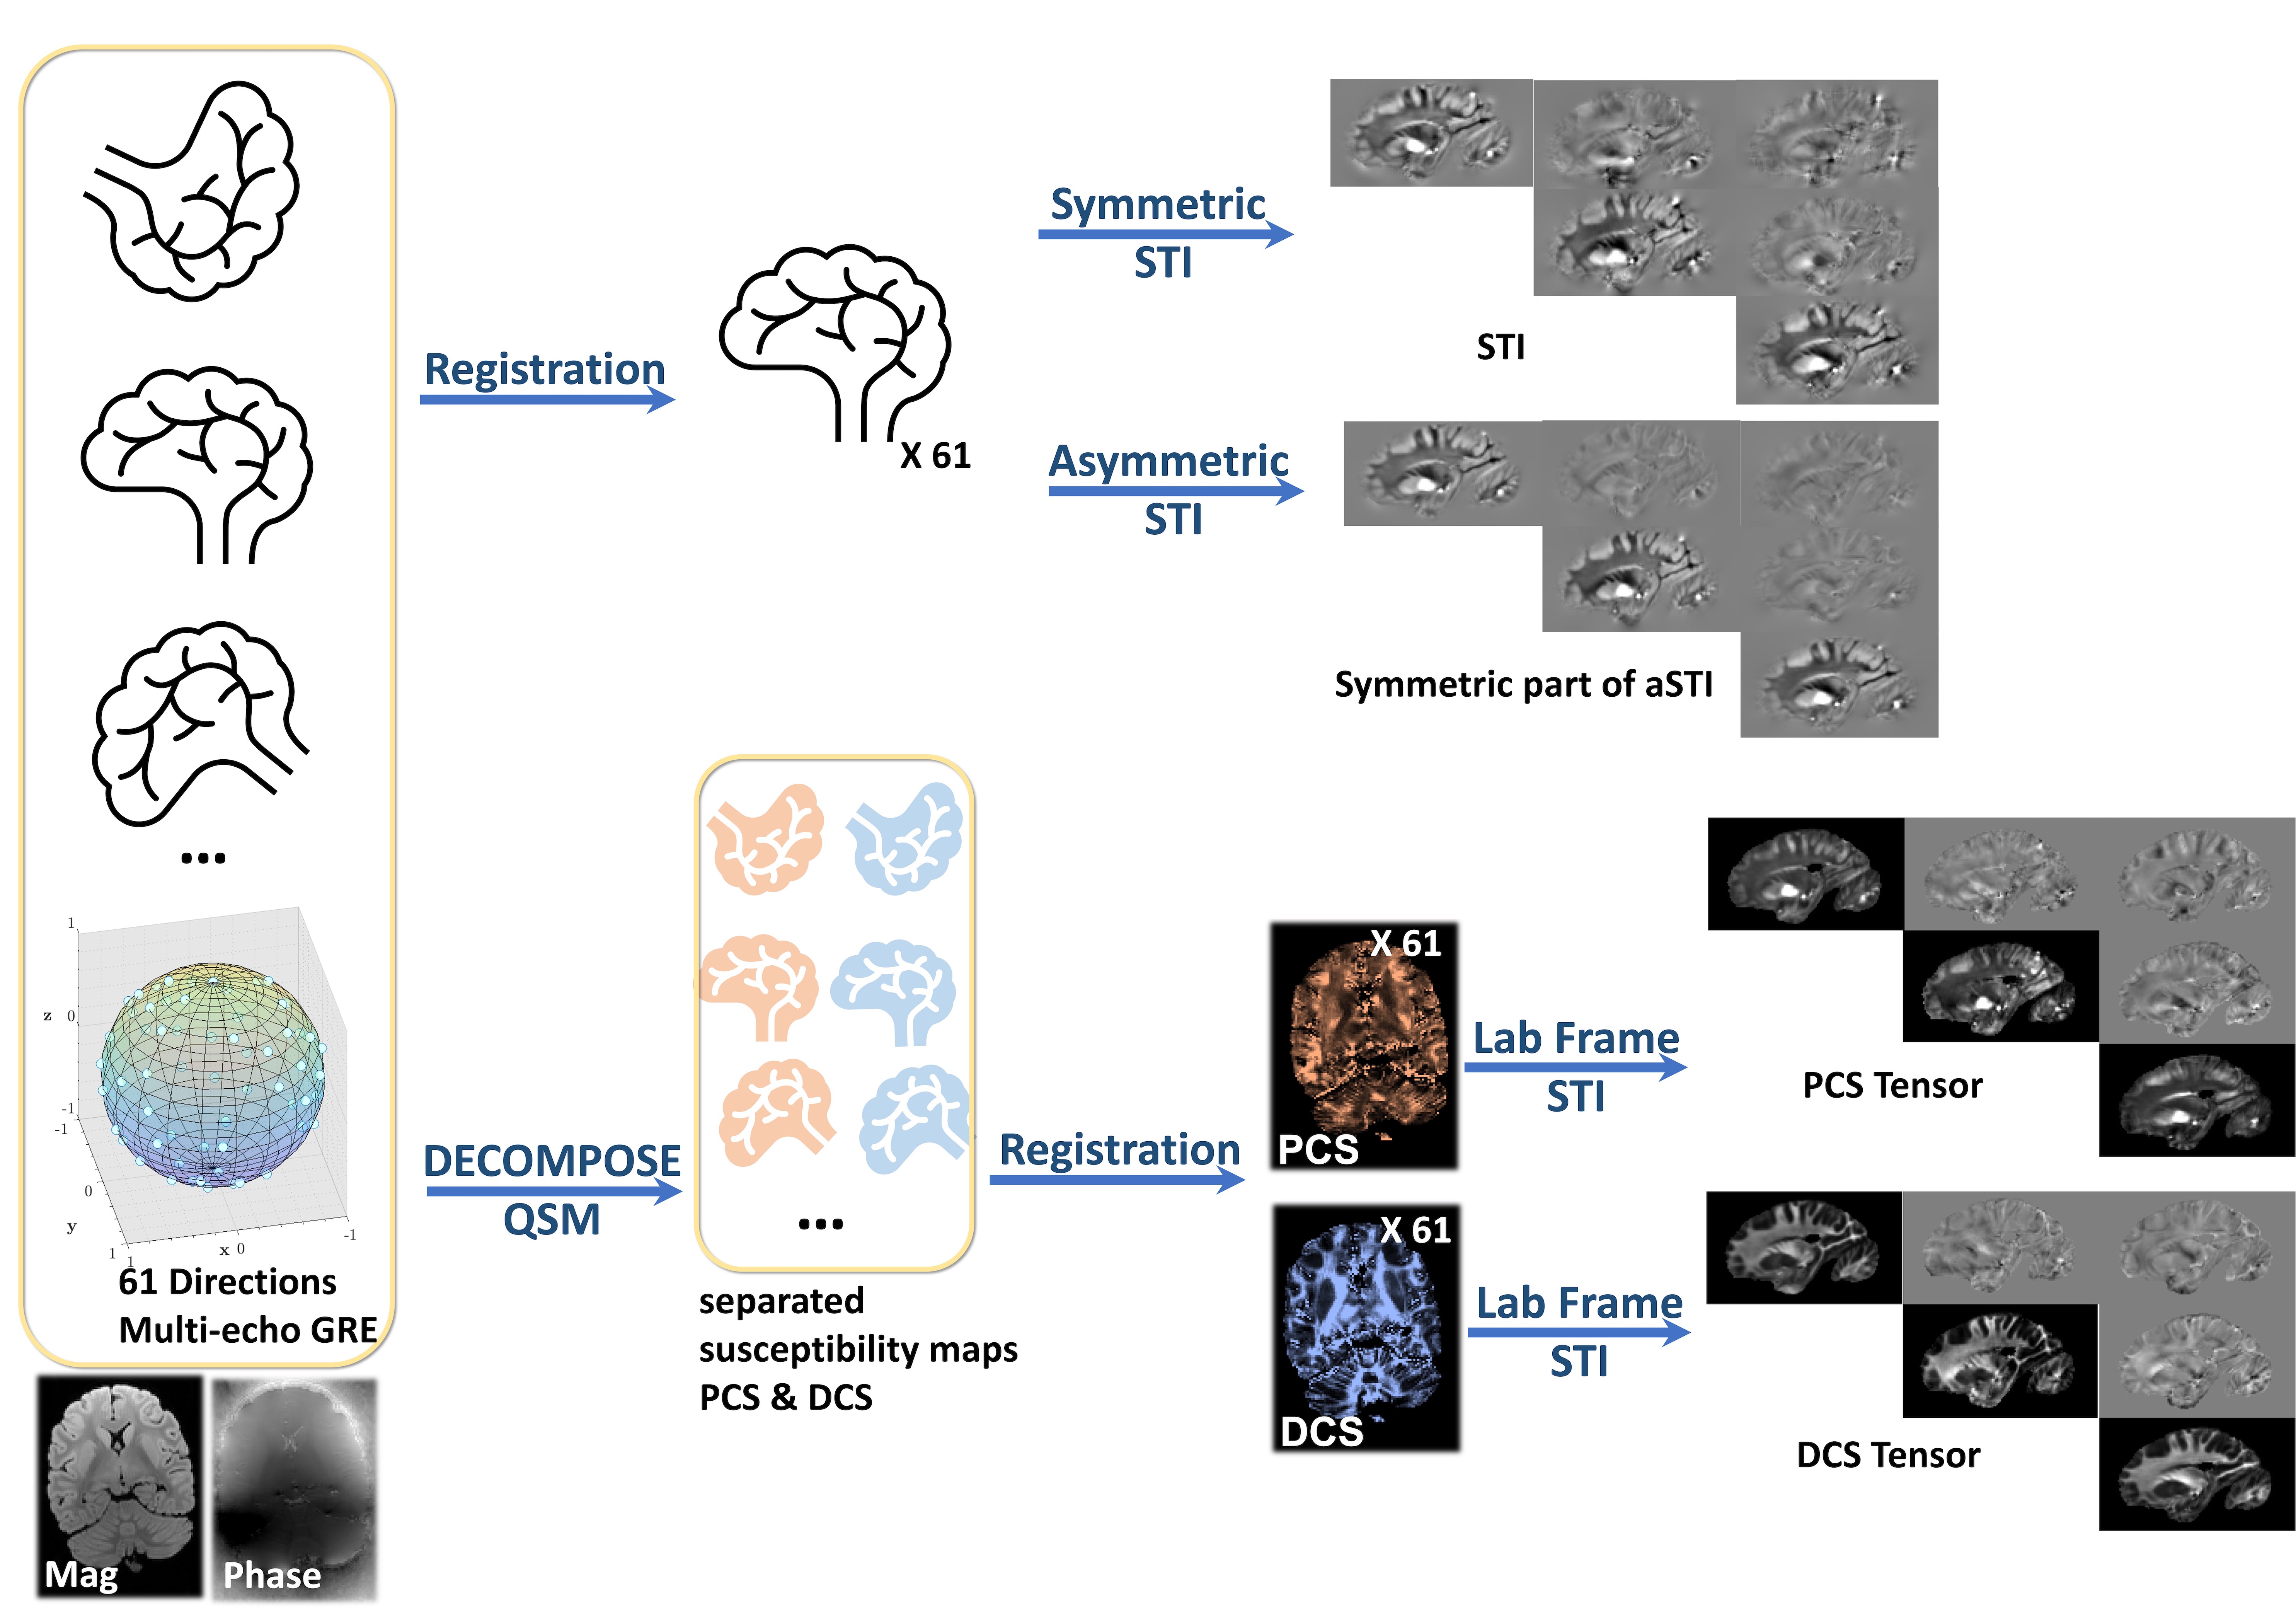
A fixed postmortem brain sample from a male chimpanzee that had died from natural causes was immersed in fomblin and 61 sample directions of Multi-Echo Gradient Echo (ME-GRE) datasets were acquired on a 3T MAGNETOM Skyra Connectom MRI scanner (Siemens Healthineers, Erlangen, Germany). The imaging parameters are TE1/TE2/dTE/TE12=3.54/6.98/3.75/44.48ms, TR=50 ms, and 1mm isotropic native resolution and 61 unique field orientations. 60 directions and one b0 image of diffusion-weighted (DW) 3D-Seg-EPI data10 were acquired on the same specimen with 1mm isotropic resolutions, TR=10.4 s, b=5000s/mm2.STI reconstruction pipelines are shown in Figure 1. Phase of multi orientation ME-GRE data was unwrapped using a Laplacian-based method, then filtered using V-SHARP. QSM of each echo was calculated using the STAR-QSM algorithm11. Echo dependent QSM and magnitude of each orientation were fed into DECOMPOSE to produce PCS and DCS maps. Multi-orientation volumes were registered to a reference volume using rigid body-6params model transformation in FSL12. The transformation matrix was applied to local tissue phase, PCS and DCS respectively. Phase averaged along the echo dimension is used for STI and asymmetric STI (aSTI) reconstruction in the subject frame. PCS and DCS are used to calculate STI in the lab frame. DTI fractional anisotropy (FA) and DCS based mathematical mean susceptibility (MMS) $$$\text{MMS}=\text{trace}(\text{DCS Tensor})$$$ was calculated and used to weigh the color-coded primary eigenvectors of susceptibility tensors for visualization. Additionally, susceptibility anisotropy defined as $$$\text{SA}=\text{eigVal}(1)-(\text{eigVal}(2)+\text{eigVal}(3))/2$$$ was calculated using the eigenvalues of the tensors (the first eigenvalue is the maximum eigenvalue).
Results
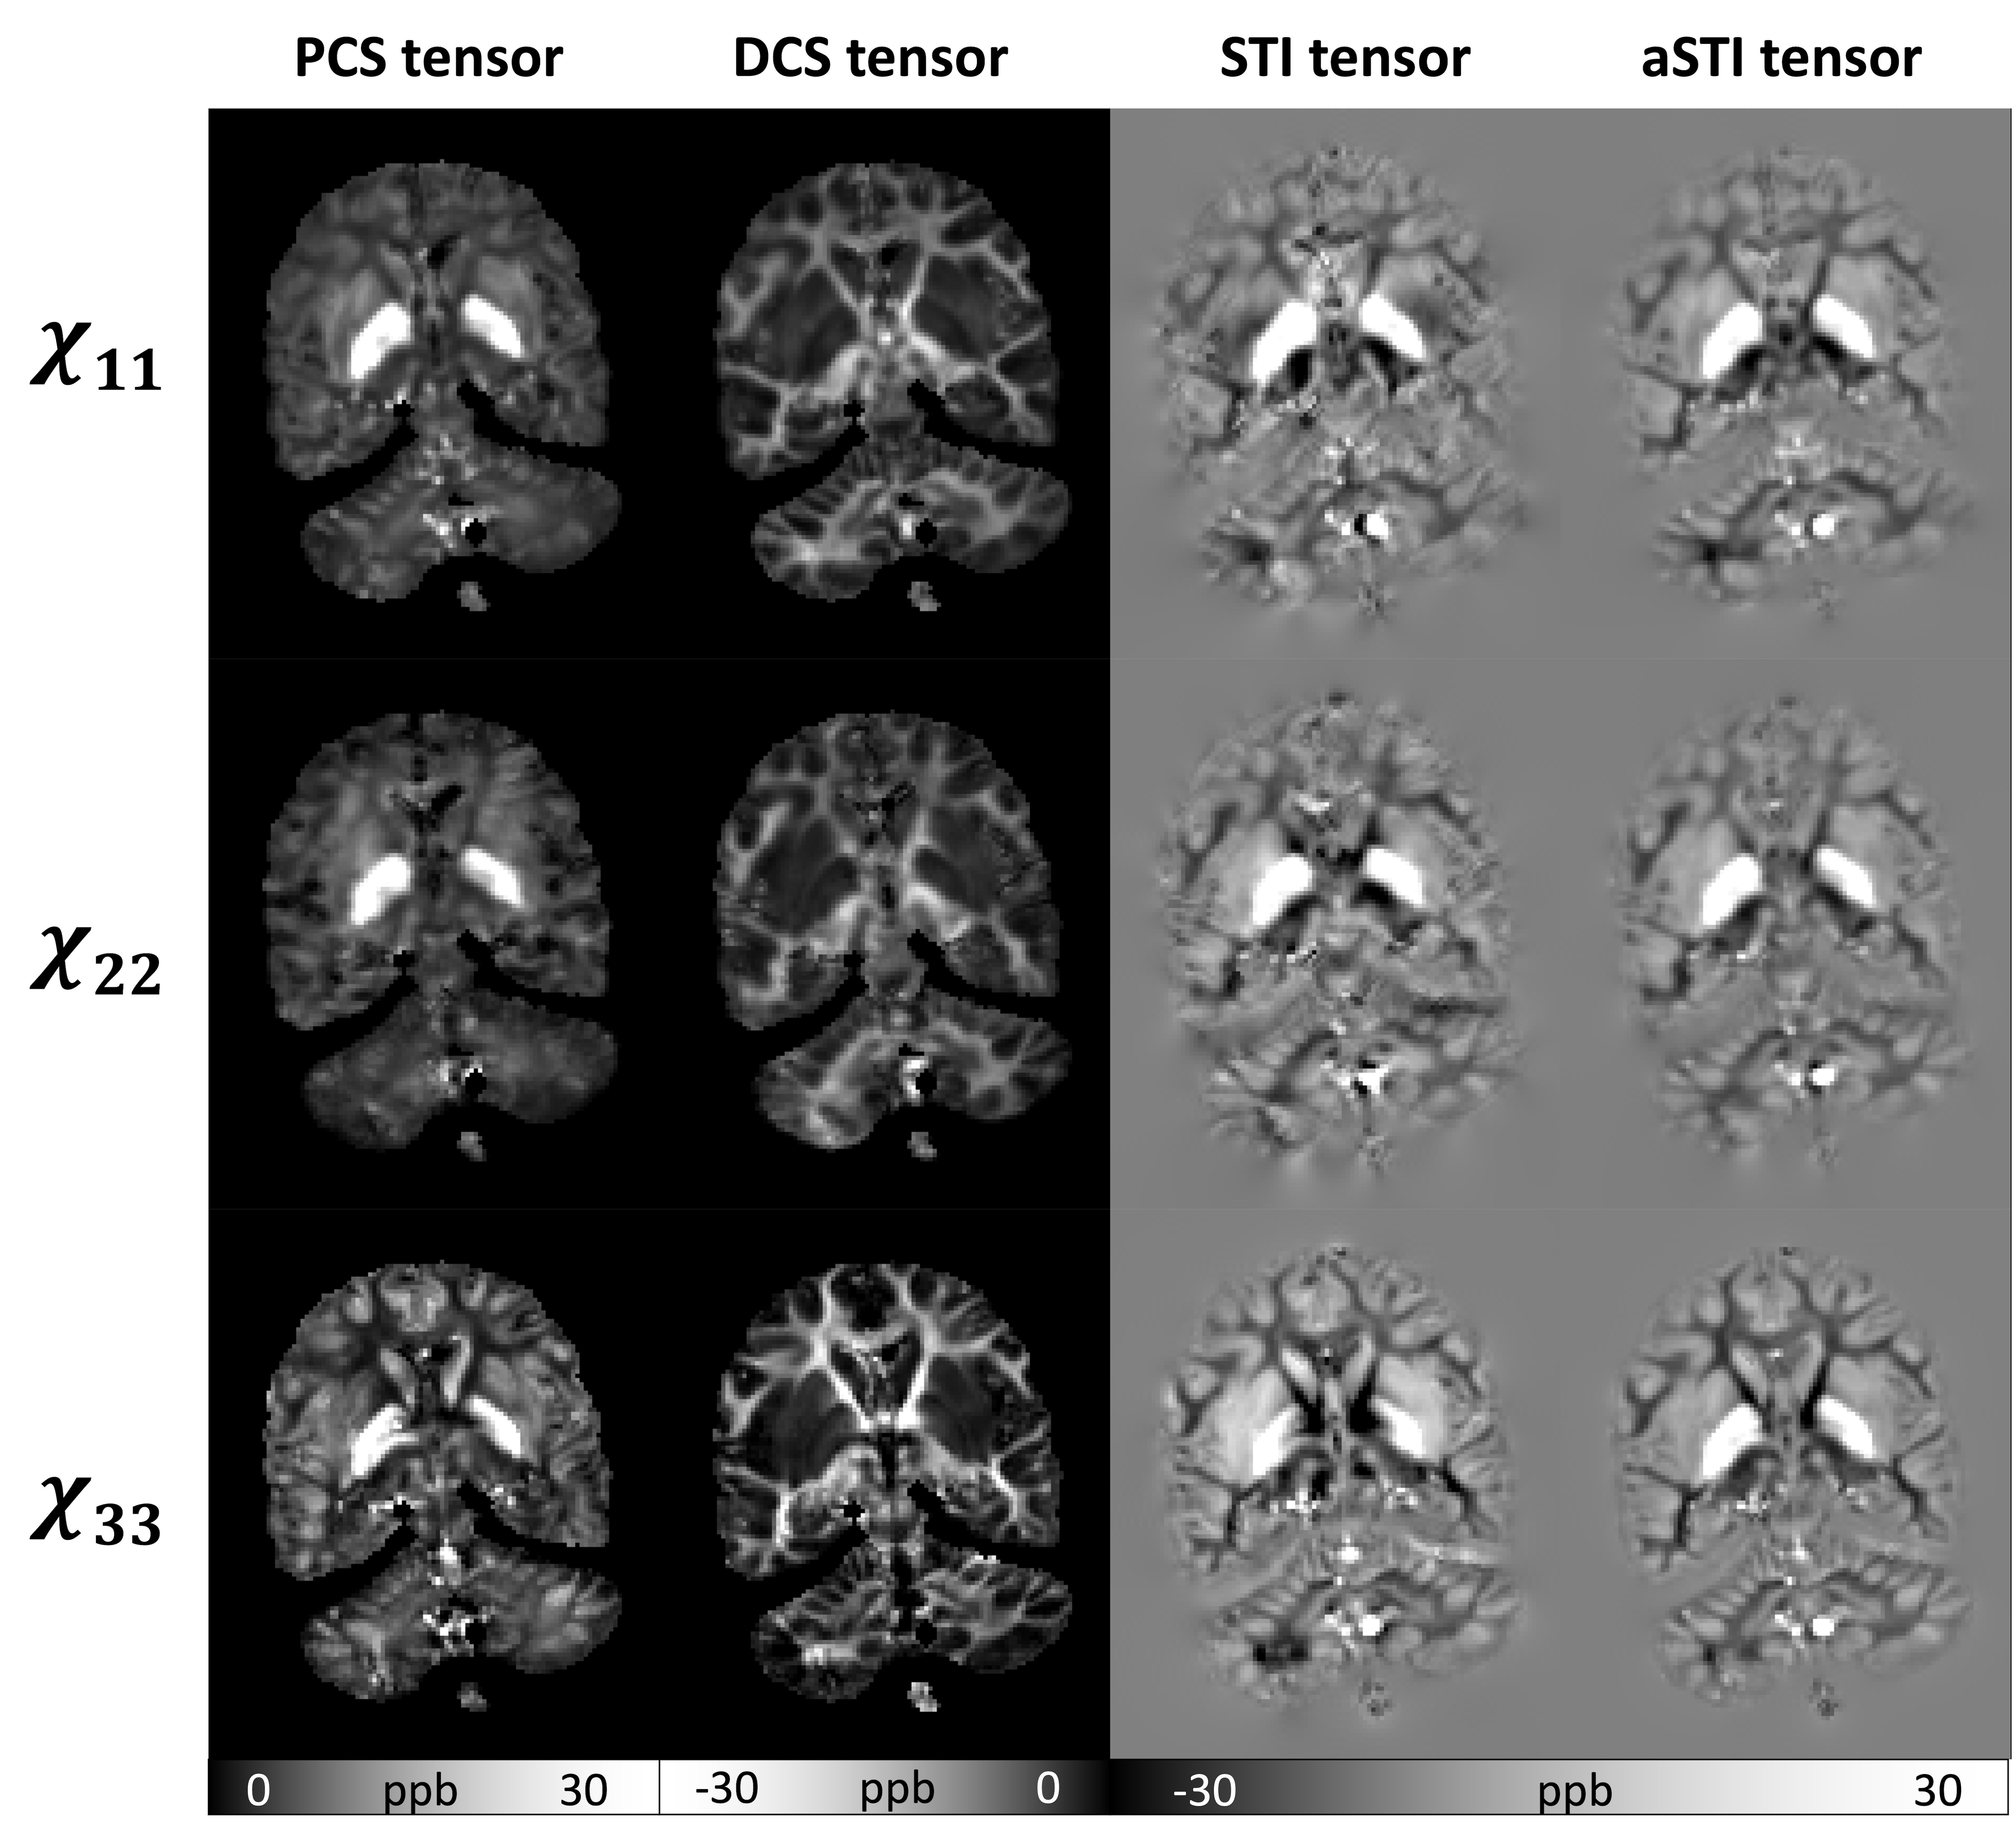
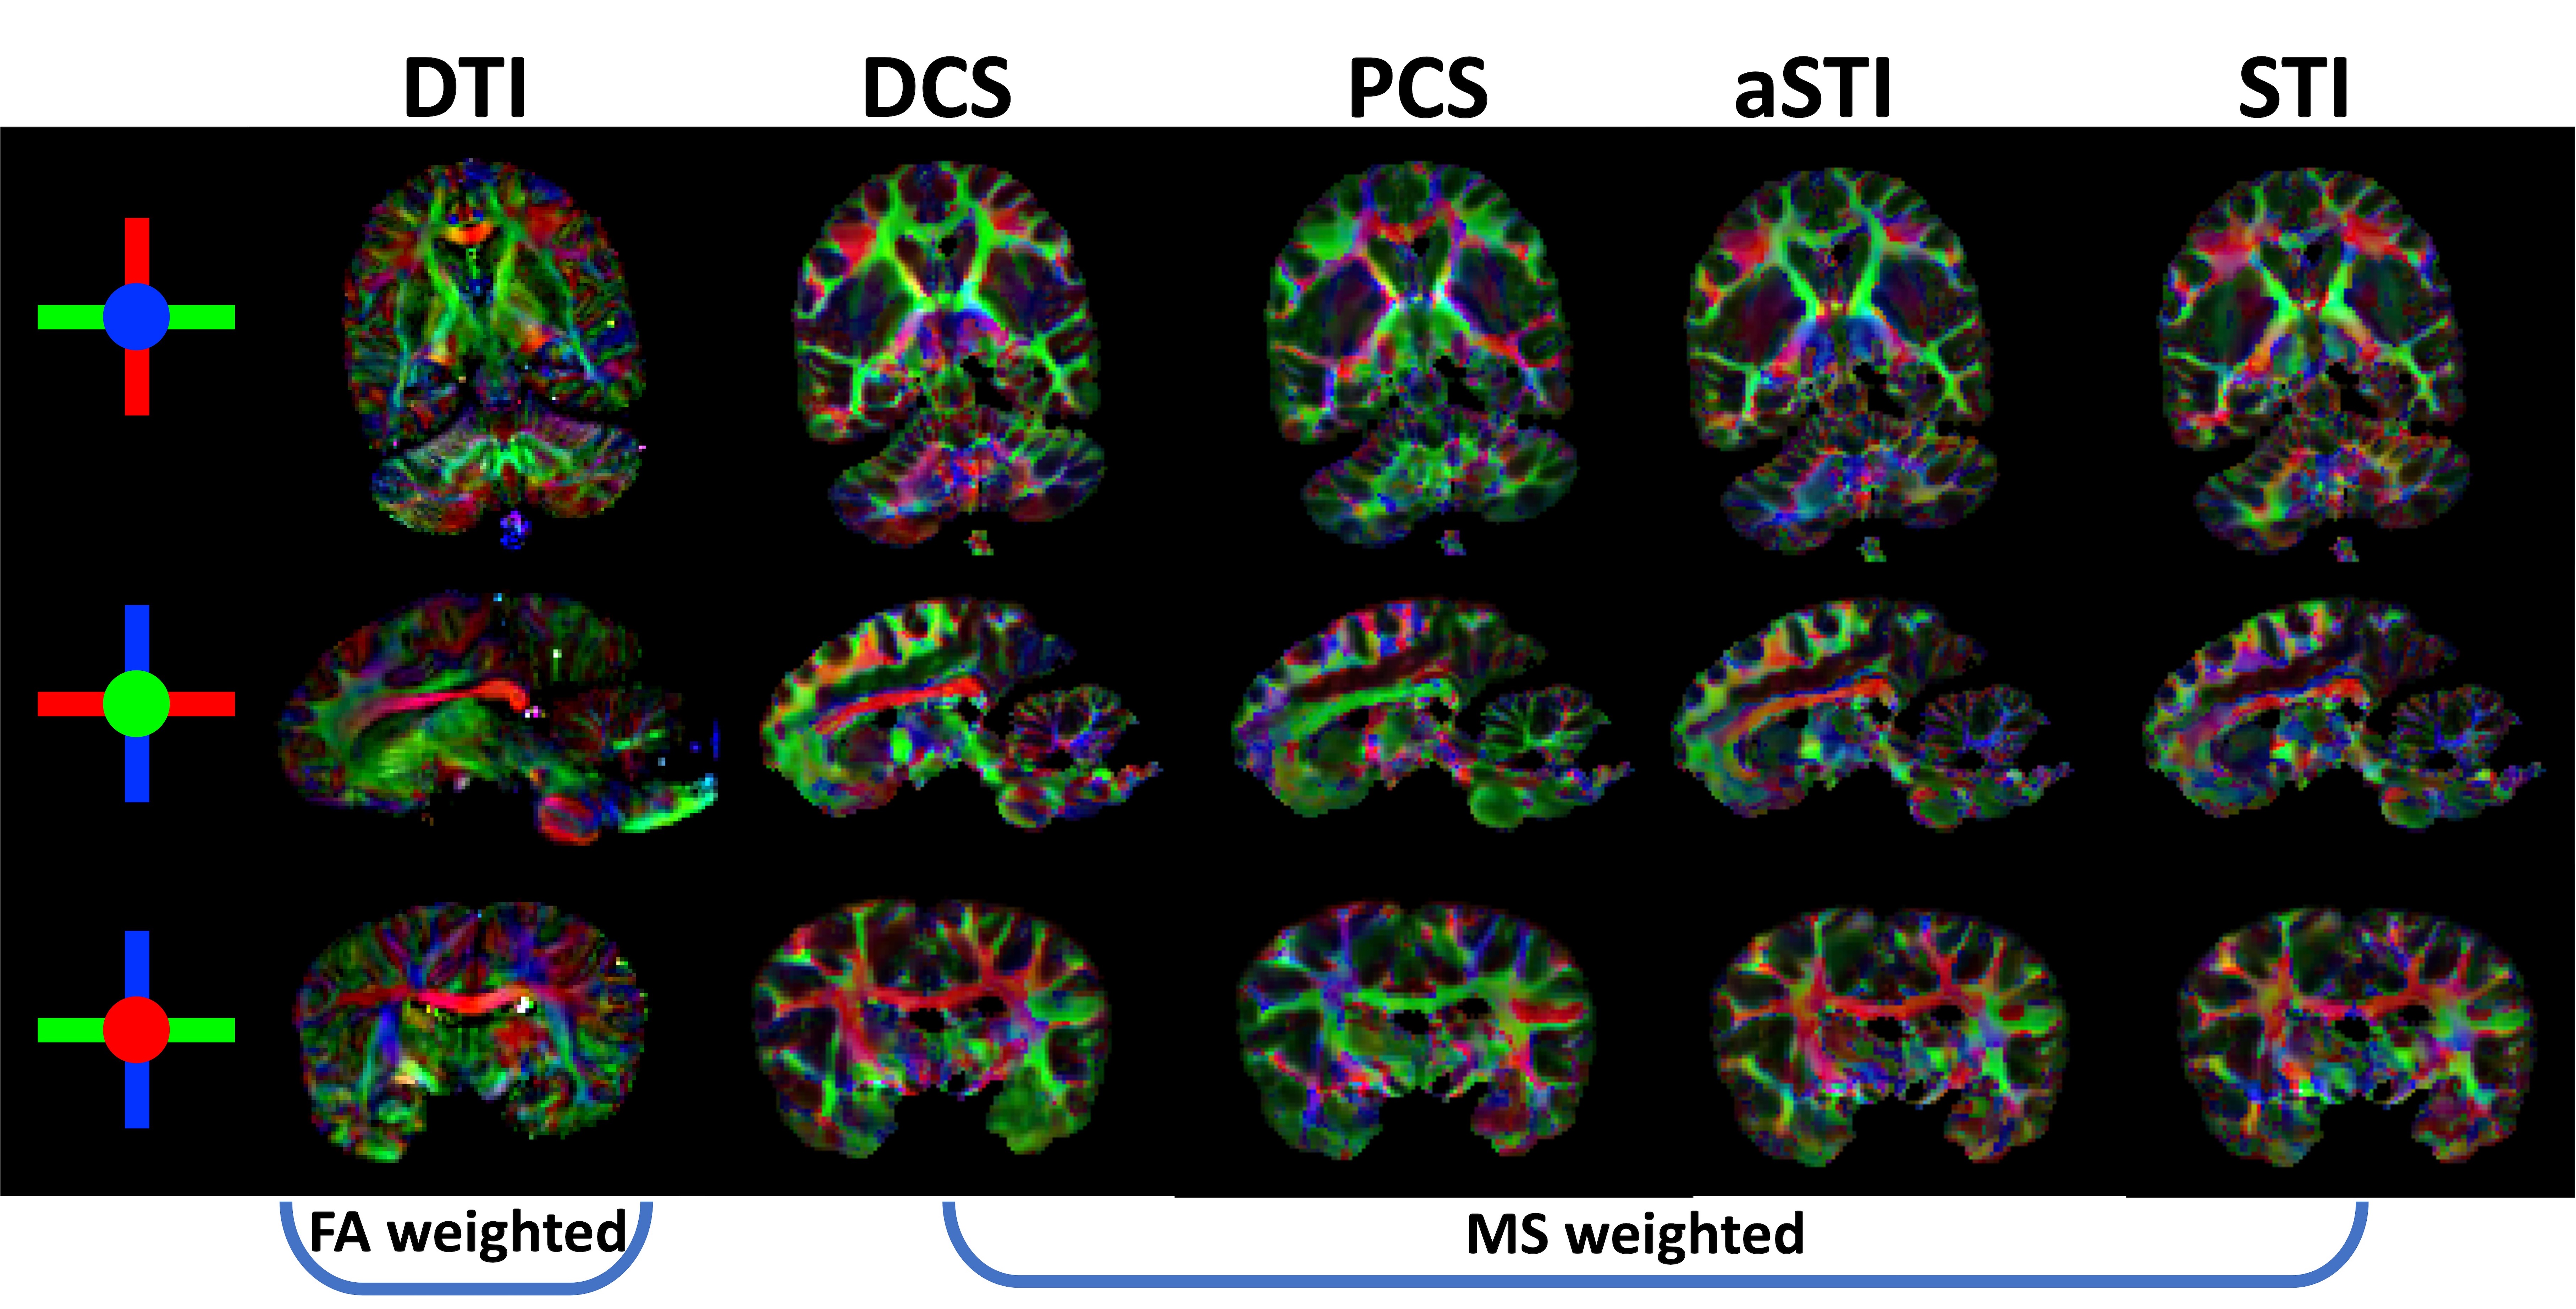
As seen in Figure 2, the diagonal elements of the paramagnetic and diamagnetic tensors show great tissue contrast with the paramagnetic tensors highlighting the gray matter (GM) and the diamagnetic tensors highlighting the white matter (WM). Further, DECOMPOSE-STI successfully resolves the colocalization of paramagnetic and diamagnetic sources, resulting in maps with continuous susceptibility information, especially at the GM/WM boundary.The MMS color-coded primary eigenvector map of DCS reveals the corpus callosum (seen from sagittal view) and external capsule (seen from axial and coronal view) fiber bundles closest to the DTI-based results (Figure 4). Additionally, the eigenvector directions were spatially more coherent when using DCS and PCS for tensor calculation. aSTI primary eigenvector map appears the most similar to primary eigenvector map of DCS tensor. However, at some region (for example Thalamus), the PCS one resembles the primary eigenvector map of DTI the most. This could indicate that the major fiber bundle in Thalamus area are mostly iron rich fibers.
Discussion
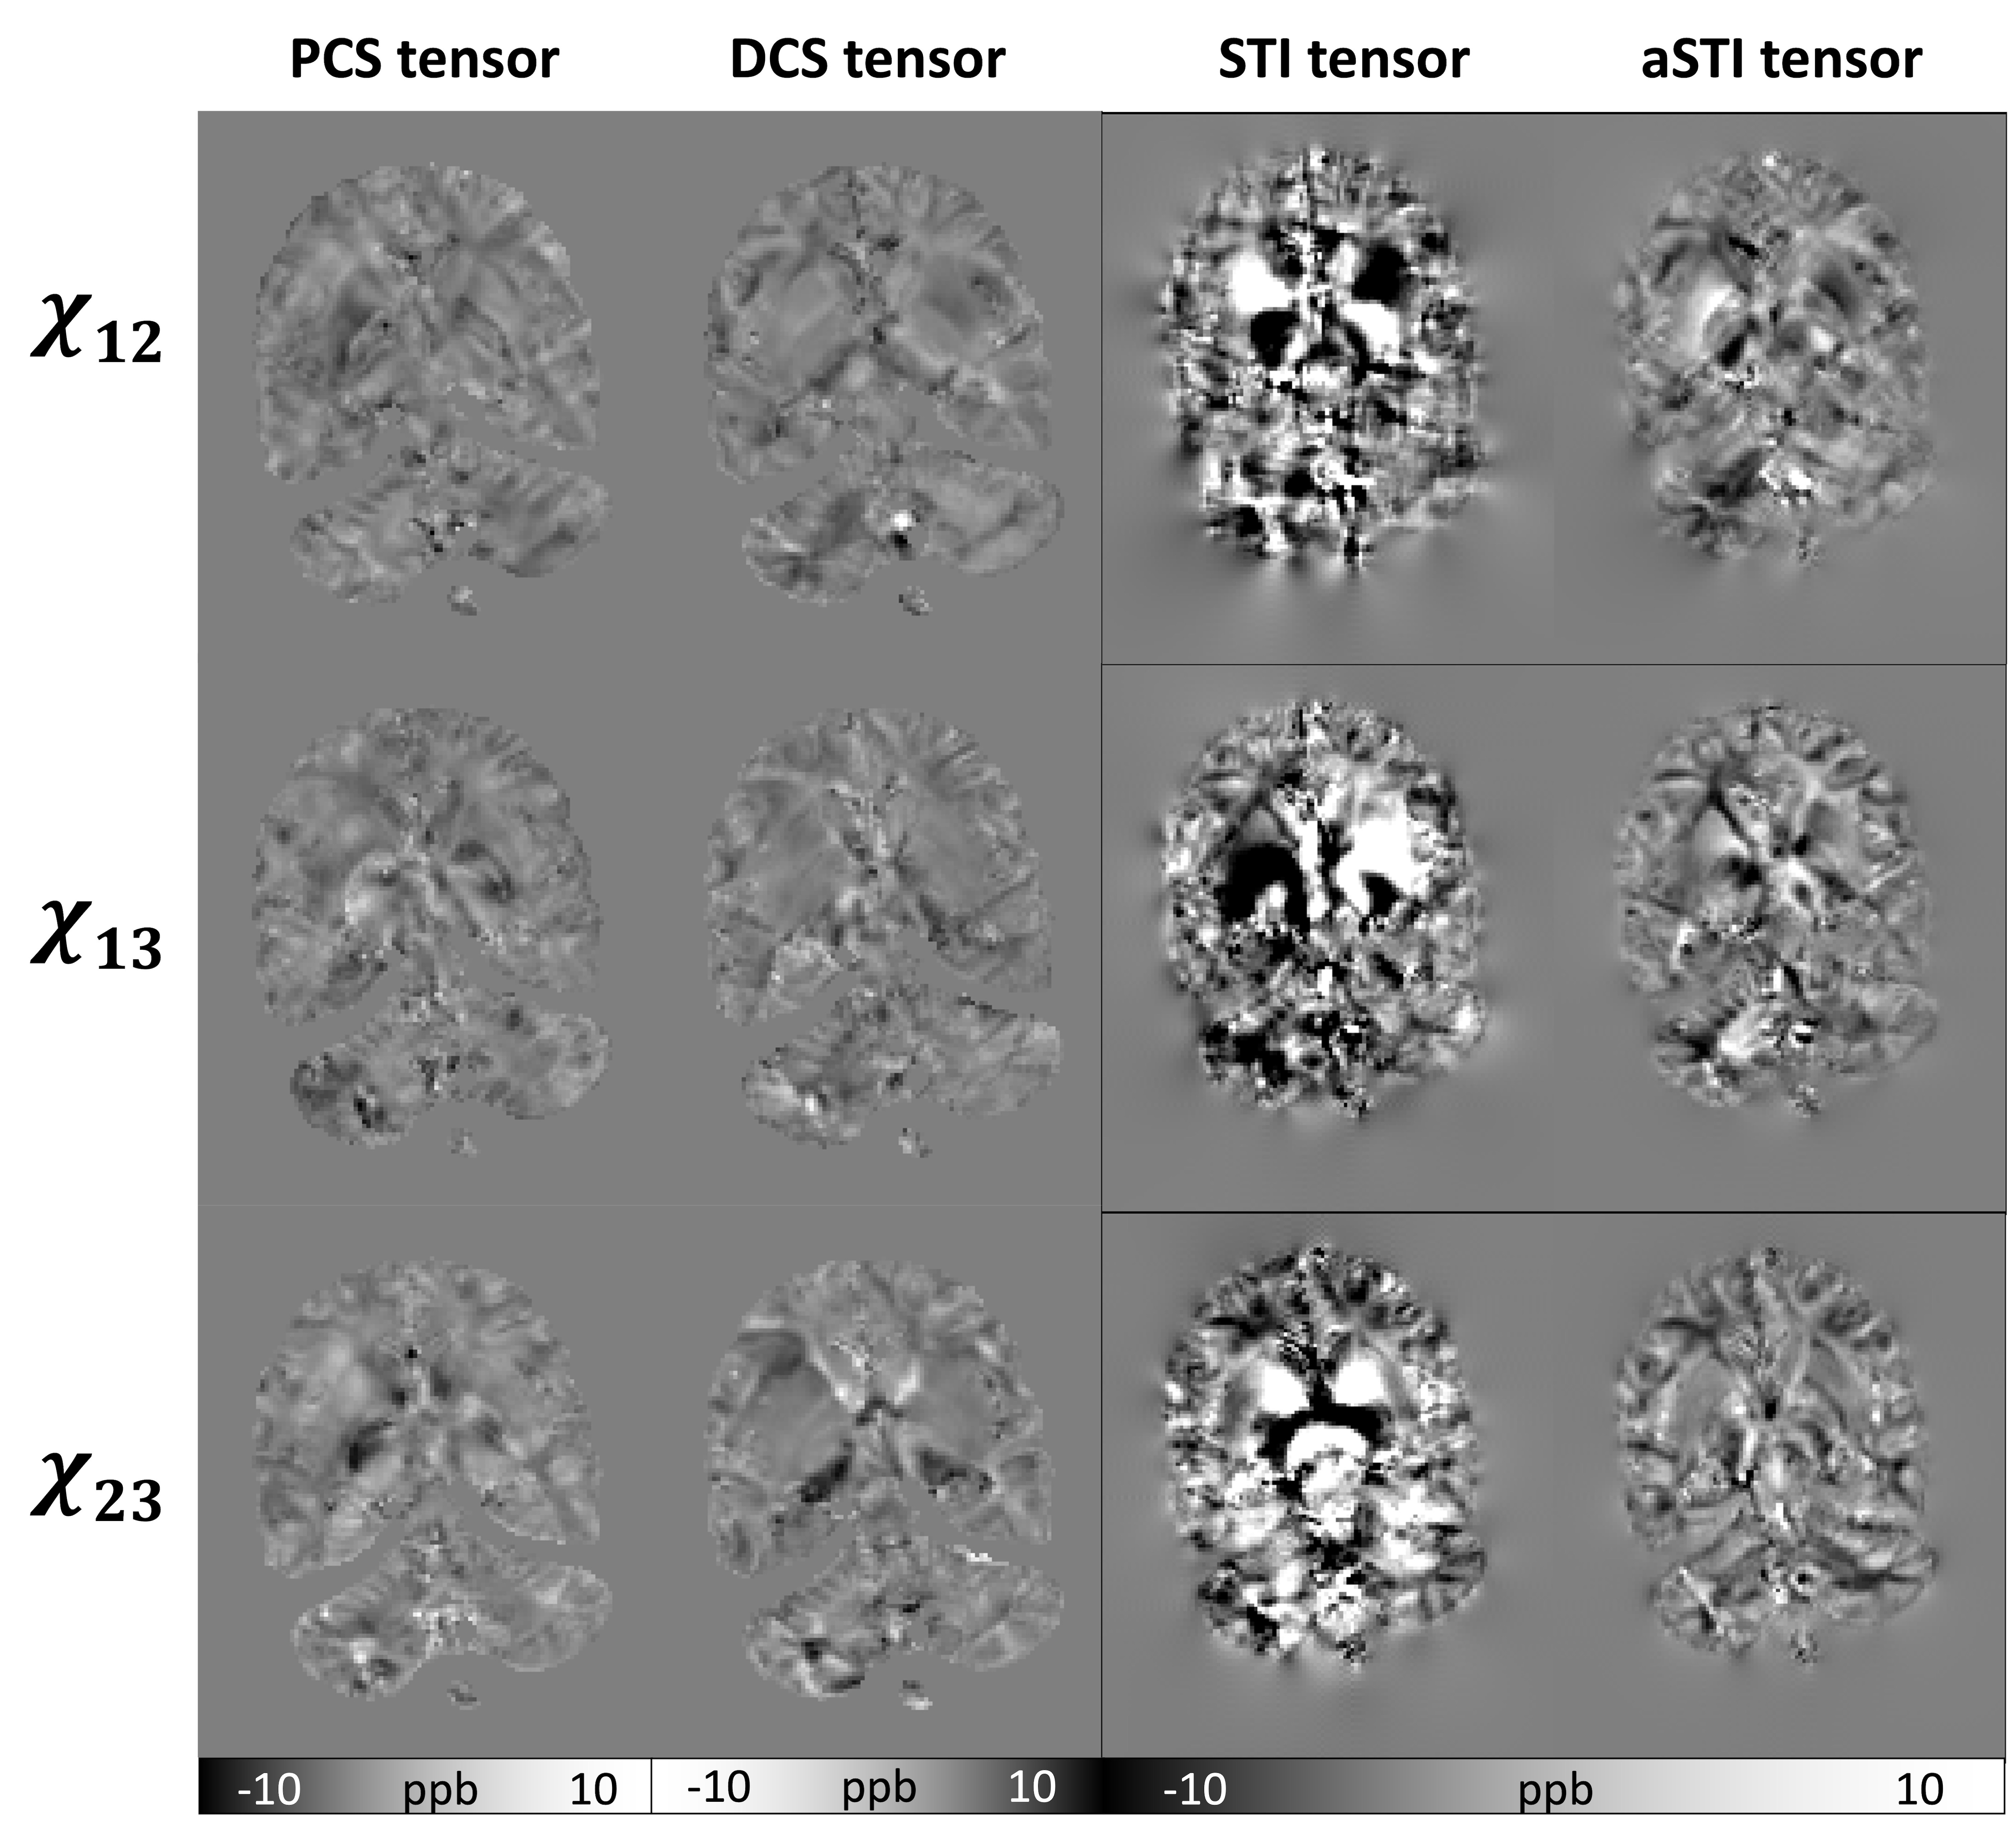
As previously reported7, the aSTI method shows reduced noise level and streaking artifacts in the symmetric part of the tensor. The off-diagonal elements from PCS and DCS tensors reduce even more artifacts resulting in more continuous susceptibility information in tensor element maps(Figure3).DECOMPOSE resolves the signal cancellation caused by colocalization of susceptibility sources, therefore the resulting DCS tensor showed desirable continuous contrast in WM region and likewise for PCS is in the GM region. Additionally, as seen in Figure 4, the color-coded MMS map using the DCS primary eigenvector maps shows the most similar WM tract with color-coded FA using primary eigenvector from DTI; for paramagnetism-dominated areas, PCS matches DTI results well. This appearance may indicate that the dominant susceptibility tensor provides more reliable eigenvector orientations. Further, PCS and DCS appear to have orthogonal primary eigenvectors in many regions, which will contribute to the eigenvector difference between STI and DTI and could further indicate substructure susceptibility anisotropy that cannot be captured by water diffusivity-based DTI. We plan to investigate these by further modeling and validation experiments.
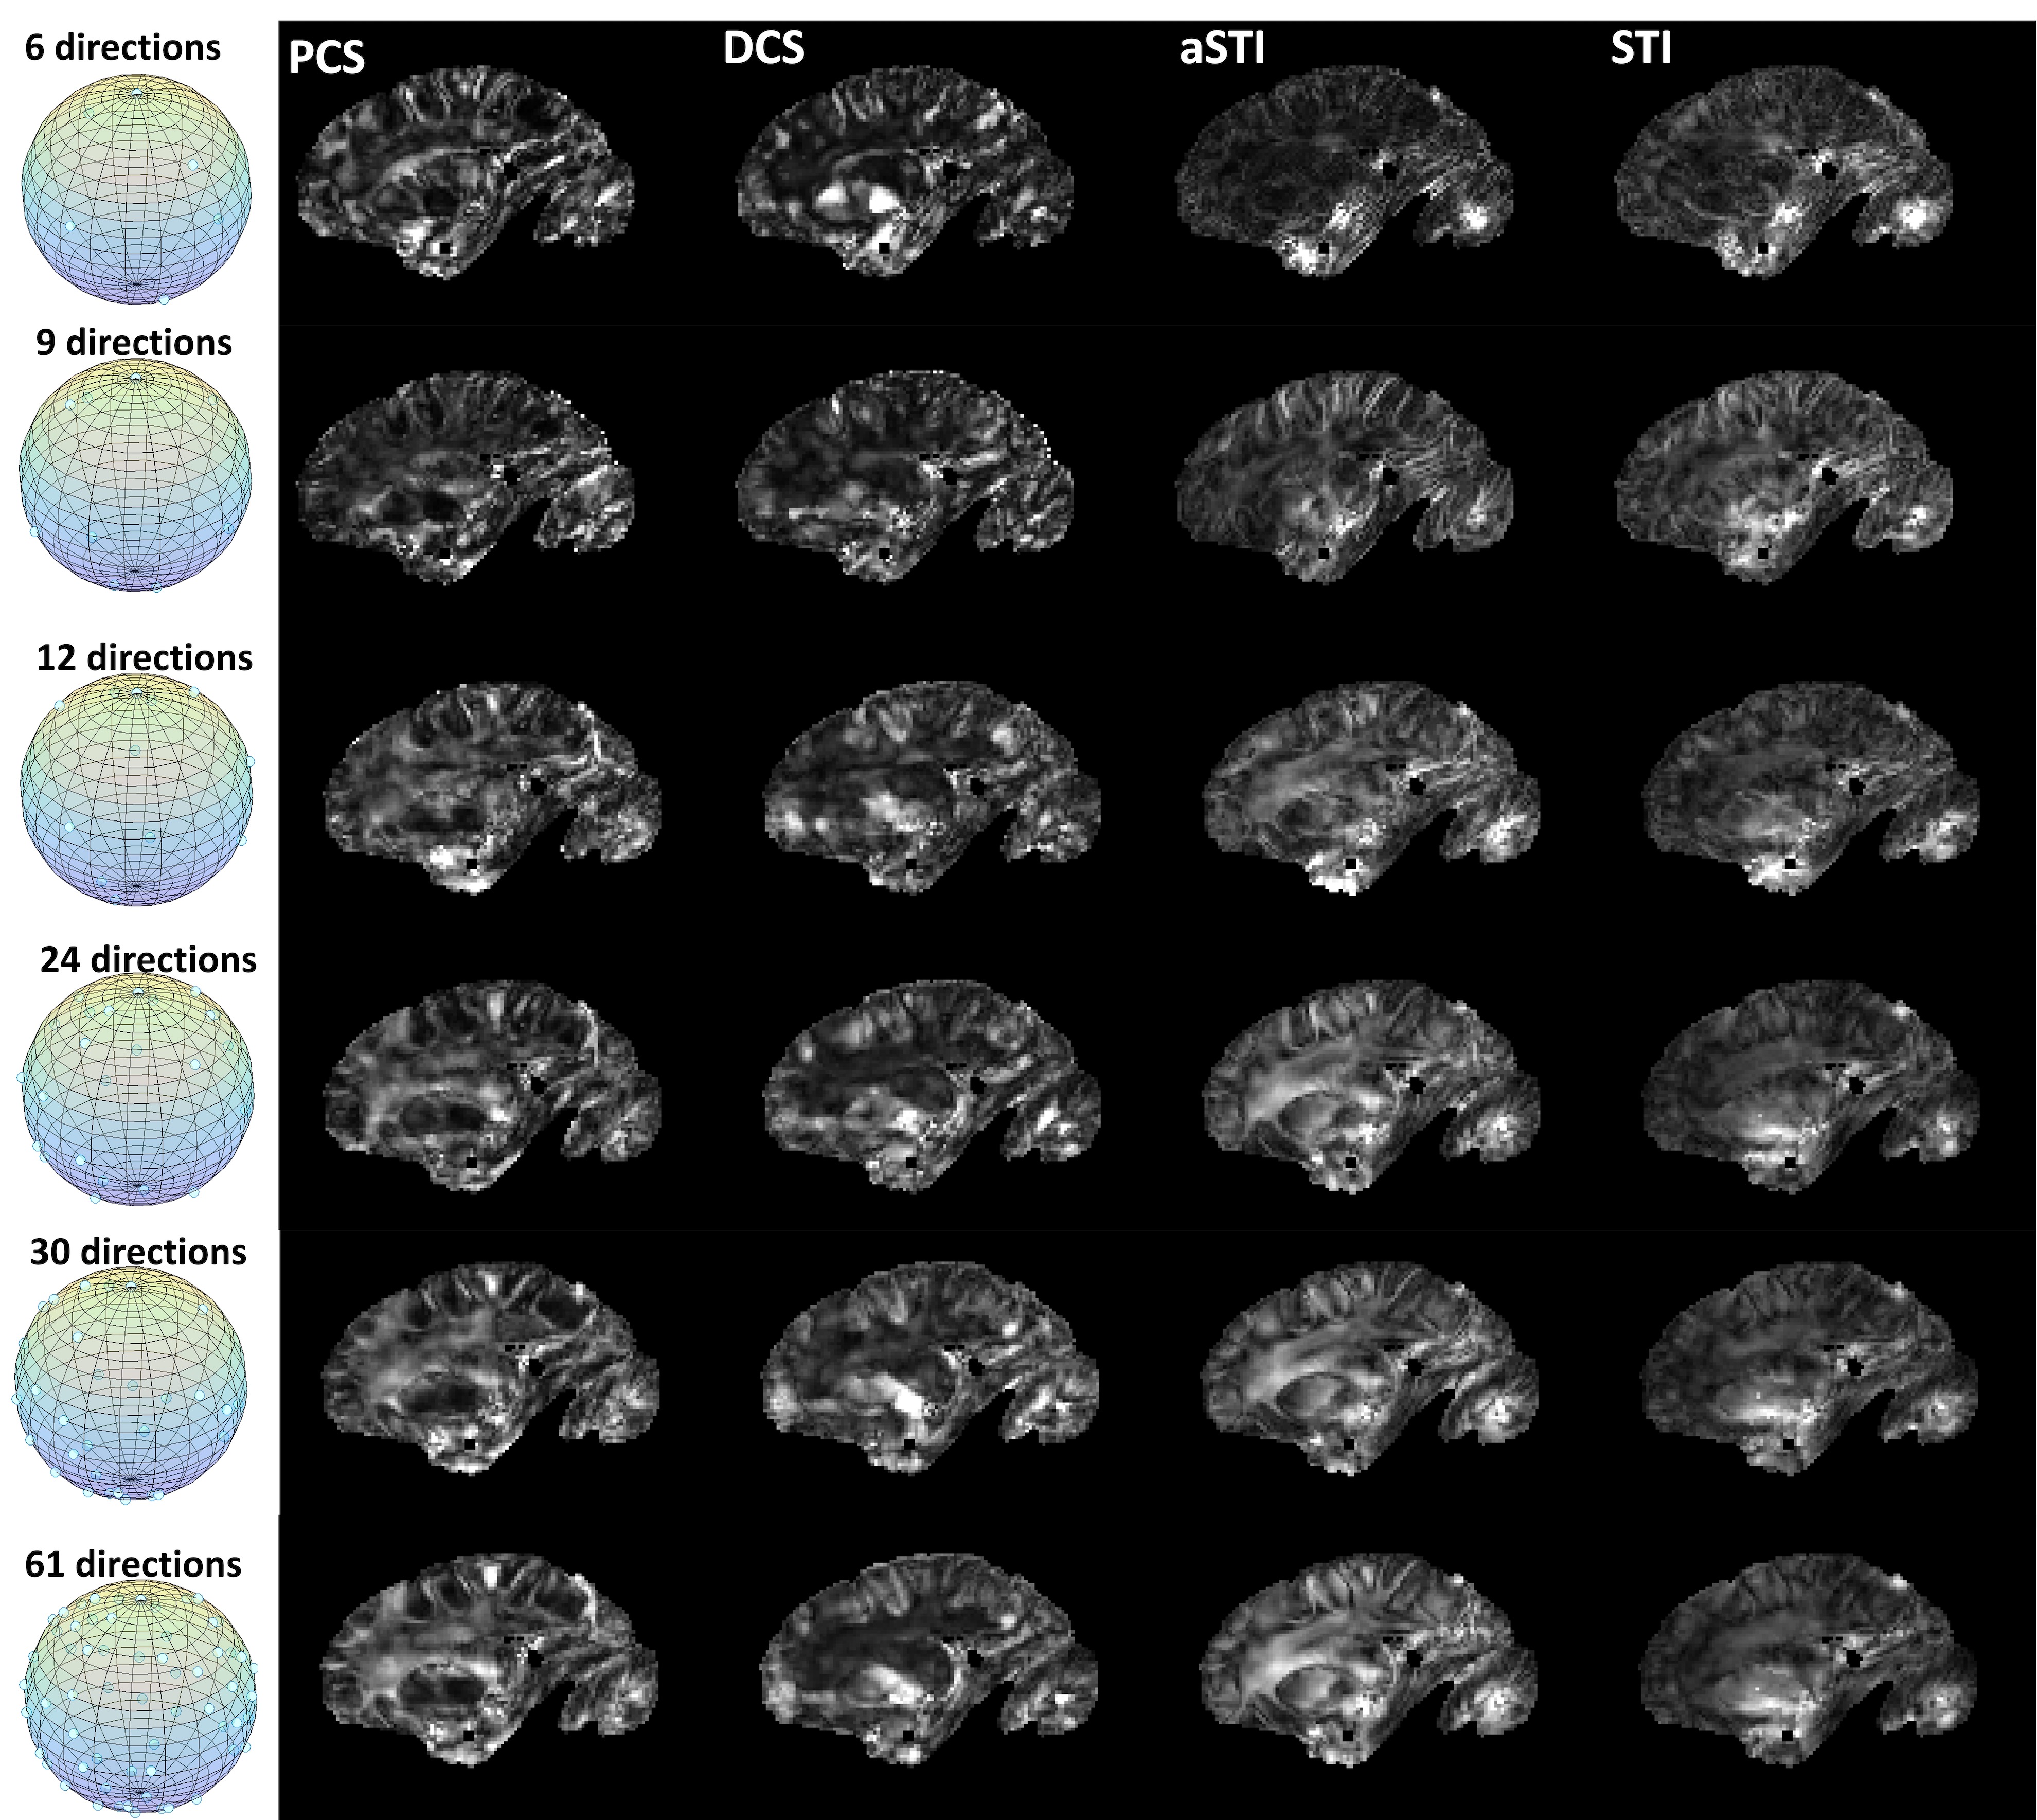
As to the required minimum number of measurements(Figure 5) for revealing useful susceptibility anisotropy information, it is expected that DECOMPOSE-STI might be helpful in reducing number of angles. The subsampled orientations used in this study were evenly distributed on a sphere by visual inspections. A more rigorous orientation subsampling scheme could be adopted to confirm the lower bound of the necessary minimum number of orientations.
Conclusion
DECOMPOSE-STI separates paramagnetic and diamagnetic susceptibility tensors, providing more accurate susceptibility tensor reconstructions. DECOMPOSE-STI can also reveal anisotropy information at a smaller number of angles compared to the original STI and aSTI.Acknowledgements
This work was supported in part by the Alzheimer's Drug Discovery Foundation through grant GC-201810-2017383 and by the EU through grant H2020-MSCA-ITN-2018 (“INSPiRE-MED”). Research reported in this publication was in part supported by the National Institute of Aging of the National Institutes of Health under Award Number R01AG070826. The content is solely the responsibility of the authors and does not necessarily represent the official views of the National Institutes of Health.References
(1) Liu, C.; Li, W.; Tong, K. A.; Yeom, K. W.; Kuzminski, S. Susceptibility-Weighted Imaging and Quantitative Susceptibility Mapping in the Brain: Brain Susceptibility Imaging and Mapping. J. Magn. Reson. Imaging 2015, 42 (1), 23–41. https://doi.org/10.1002/jmri.24768.
(2) Wang, Y.; Liu, T. Quantitative Susceptibility Mapping (QSM): Decoding MRI Data for a Tissue Magnetic Biomarker. Magn. Reson. Med. 2015, 73 (1), 82–101. https://doi.org/10.1002/mrm.25358.
(3) Liu, C. Susceptibility Tensor Imaging. Magn. Reson. Med. Off. J. Soc. Magn. Reson. Med. Soc. Magn. Reson. Med. 2010, 63 (6), 1471–1477. https://doi.org/10.1002/mrm.22482.
(4) Wei, H.; Gibbs, E.; Zhao, P.; Wang, N.; Cofer, G. P.; Zhang, Y.; Johnson, G. A.; Liu, C. Susceptibility Tensor Imaging and Tractography of Collagen Fibrils in the Articular Cartilage. Magn. Reson. Med. 2017, 78 (5), 1683–1690. https://doi.org/10.1002/mrm.26882.
(5) Li, W.; Wu, B.; Avram, A. V.; Liu, C. Magnetic Susceptibility Anisotropy of Human Brain in Vivo and Its Molecular Underpinnings. NeuroImage 2012, 59 (3), 2088–2097. https://doi.org/10.1016/j.neuroimage.2011.10.038.
(6) Liu, C.; Li, W.; Wu, B.; Jiang, Y.; Johnson, G. A. 3D Fiber Tractography with Susceptibility Tensor Imaging. NeuroImage 2012, 59 (2), 1290–1298. https://doi.org/10.1016/j.neuroimage.2011.07.096.
(7) Cao, S.; Wei, H.; Chen, J.; Liu, C. Asymmetric Susceptibility Tensor Imaging. Magn. Reson. Med. 2021, 86 (4), 2266–2275. https://doi.org/10.1002/mrm.28823.
(8) Bilgic, B.; Xie, L.; Dibb, R.; Langkammer, C.; Mutluay, A.; Ye, H.; Polimeni, J. R.; Augustinack, J.; Liu, C.; Wald, L. L.; Setsompop, K. Rapid Multi-Orientation Quantitative Susceptibility Mapping. NeuroImage 2016, 125, 1131–1141. https://doi.org/10.1016/j.neuroimage.2015.08.015.
(9) Chen, J.; Gong, N.-J.; Chaim, K. T.; Otaduy, M. C. G.; Liu, C. Decompose Quantitative Susceptibility Mapping (QSM) to Sub-Voxel Diamagnetic and Paramagnetic Components Based on Gradient-Echo MRI Data. NeuroImage 2021, 242, 118477. https://doi.org/10.1016/j.neuroimage.2021.118477.
(10) Eichner, C.; Paquette, M.; Mildner, T.; Schlumm, T.; Pléh, K.; Samuni, L.; Crockford, C.; Wittig, R. M.; Jäger, C.; Möller, H. E.; Friederici, A. D.; Anwander, A. Increased Sensitivity and Signal-to-Noise Ratio in Diffusion-Weighted MRI Using Multi-Echo Acquisitions. NeuroImage 2020, 221, 117172. https://doi.org/10.1016/j.neuroimage.2020.117172.
(11) STISuite. https://people.eecs.berkeley.edu/~chunlei.liu/software.html
(12) Jenkinson, M.; Beckmann, C. F.; Behrens, T. E. J.; Woolrich, M. W.; Smith, S. M. FSL. NeuroImage 2012, 62 (2), 782–790. https://doi.org/10.1016/j.neuroimage.2011.09.015.
Figures