0767
Comparison of diffusion MRI models for white matter in simulations and in early human brain development1Radiology, NYU School of Medicine, New York, NY, United States
Synopsis
Biophysical modeling of diffusion MRI is instrumental in achieving specificity to tissue microstructure in human white matter. The “Standard Model” (SM) framework encompasses many approaches assuming multiple Gaussian compartments. To robustly estimate SM parameters, different constraints and techniques have been applied, resulting in different outcomes. Here we evaluate the precision and accuracy of commonly used implementations and constraints for SM parameter estimation, and compare their results both in simulations and in early human brain development.
Introduction
The Standard Model1 (SM) has been proposed as an overarching dMRI model for white matter (WM), unifying many previously proposed WM models2-6. The SM signal, measured along direction $$$\hat{g}$$$, is a convolution between the fiber orientation distribution function (ODF) $$$\mathcal{P}(\hat{n})$$$ and the kernel response $$$\mathcal{K}(b,\hat{g}\cdot\hat{n})$$$ $$S_{\hat{g}}(b) = \int_{|\hat{n}|=1} d\hat{n} \, \mathcal{P}(\hat{n}) \, \mathcal{K}(b,\hat{g}\cdot\hat{n})$$ where $$ \mathcal{K}(b,\xi) = S_0 \, [fe^{-bD_{a}\xi^2} + (1-f)e^{-bD_{e}^{\parallel}\xi^2-bD_e^\bot(1-\xi^2)}]$$ with $$$\xi=\hat{g}\cdot\hat{n}$$$. Here $$$[f,D_{a},D_{e}^{\parallel},D_{e}^{\bot},p_2]$$$ are the intra-axonal space (IAS) fraction, IAS axial diffusivity, extra-axonal space (EAS) axial diffusivity, EAS radial diffusivity and $$$l=2$$$ rotational invariant of ODF, respectively. Due to the multi-compartmental nature of SM, the estimation of kernel parameters is degenerate and thus specificity may become obscured. Several constraints and techniques (e.g., WMTI2, WMTI-Watson3, NODDI4, SMT5, ML-RotInv6) have been employed to resolve the degeneracy. Here we compare these popular WM models using numerical noise propagations and apply them to the dMRI data of brain development7.Methods
SM parameter estimation techniques:(1) ML-RotInv6 is a data-driven approach that maps the rotational invariants of the dMRI signals to SM parameters using polynomials. No constraints are applied in the training.
(2) SMT5 uses the spherical mean to estimate $$$f$$$ and axial diffusivities while using the tortuosity approximation for $$$D_{e}^{\bot}$$$.
(3) NODDI4 fixes the axial diffusivities at 1.7 mm2/s, uses the tortuosity constraint for $$$D_{e}^{\bot}$$$ and approximates the ODF as a Watson distribution.
(4) WMTI2 derives SM parameters from DKI metrics assuming fibers are highly aligned.
(5) Watson-WMTI3 takes a step further from WMTI by using a Watson distribution to allow some fiber dispersion. This approach has two solutions, thus we will show both branches of Watson WMTI denoted as Watson+ ($$$D_{a} > D_{e}^{\parallel}$$$) and Watson- ($$$D_{a} < D_{e}^{\parallel}$$$).
Numerical noise propagation:
dMRI signals were generated with random combinations of SM parameters within the physical range. After addition of Gaussian noise at SNR = 40, SM parameters were estimated by different SM estimation methods (1-5) and compared to the ground-truth using following quality metrics:
(1) Root mean square error (RMSE) between the estimation and ground truth.
(2) Sensitivity-specificity matrix ($$$S_{ij} = \frac{\partial\hat{\theta}_{j}}{\partial\theta_{i}}$$$) is derived by applying a linear regression of each estimated SM parameter $$$\hat{\theta_{j}}$$$ with respect to the ground truth $$$\theta_{i}$$$ of all five SM parameters. This reflects how changes in ground truth are picked up by the estimates.
(3) We measure the average statistical power by comparing two groups of synthetic data. The variance of each group is representative of WM, and the mean is set to differ by a certain percentage.
In-vivo MRI:
59 pediatric subjects (0-3 years old, 29 males, 30 females) scanned on a 1.5T Avanto Siemens MR scanner were retrospectively recruited in an IRB-approved study. The dMRI protocol described in Ref. [7] included 30 directions for b=1000 s/mm2 and 30 directions for b=2000 s/mm2. As an adult reference, 27 control subjects (18-35 years old, 14 males, 13 females) scanned on a 3T Siemens Skyra or Prisma scanner were included, for which the dMRI protocol (described in Ref. [8]) included 20 directions for b=1000 s/mm2 and 60 directions for b=2000 s/mm2. An in-house developed pipeline9 was used for denoising10, Gibbs artifact correction11, motion and eddy current correction12. Regions of interest were automatically segmented by a nonlinear mapping on the JHU WM label atlas13.
Results
Fig. 1 shows that ML-RotInv has the lowest RMSE in every SM parameter and the lowest number of outliers. The prior of ML-RotInv pushes the estimation towards the prior mean, while the constraints in other models introduce different biases.Fig. 2 displays the sensitivity-specificity matrix for all WM models. Diagonal elements measure sensitivity, while off-diagonal elements show spurious correlations between different parameters, leading to a loss of specificity. $$$p_{2}$$$ is disentangled from the SM kernel parameters by ML-RotInv, whereas diffusivities are entangled.
Fig. 3 further corroborates the results in Fig. 2 by providing the number of voxels needed to detect significant changes in SM parameters. Note that multiple parameters can change at the same time in pathology.
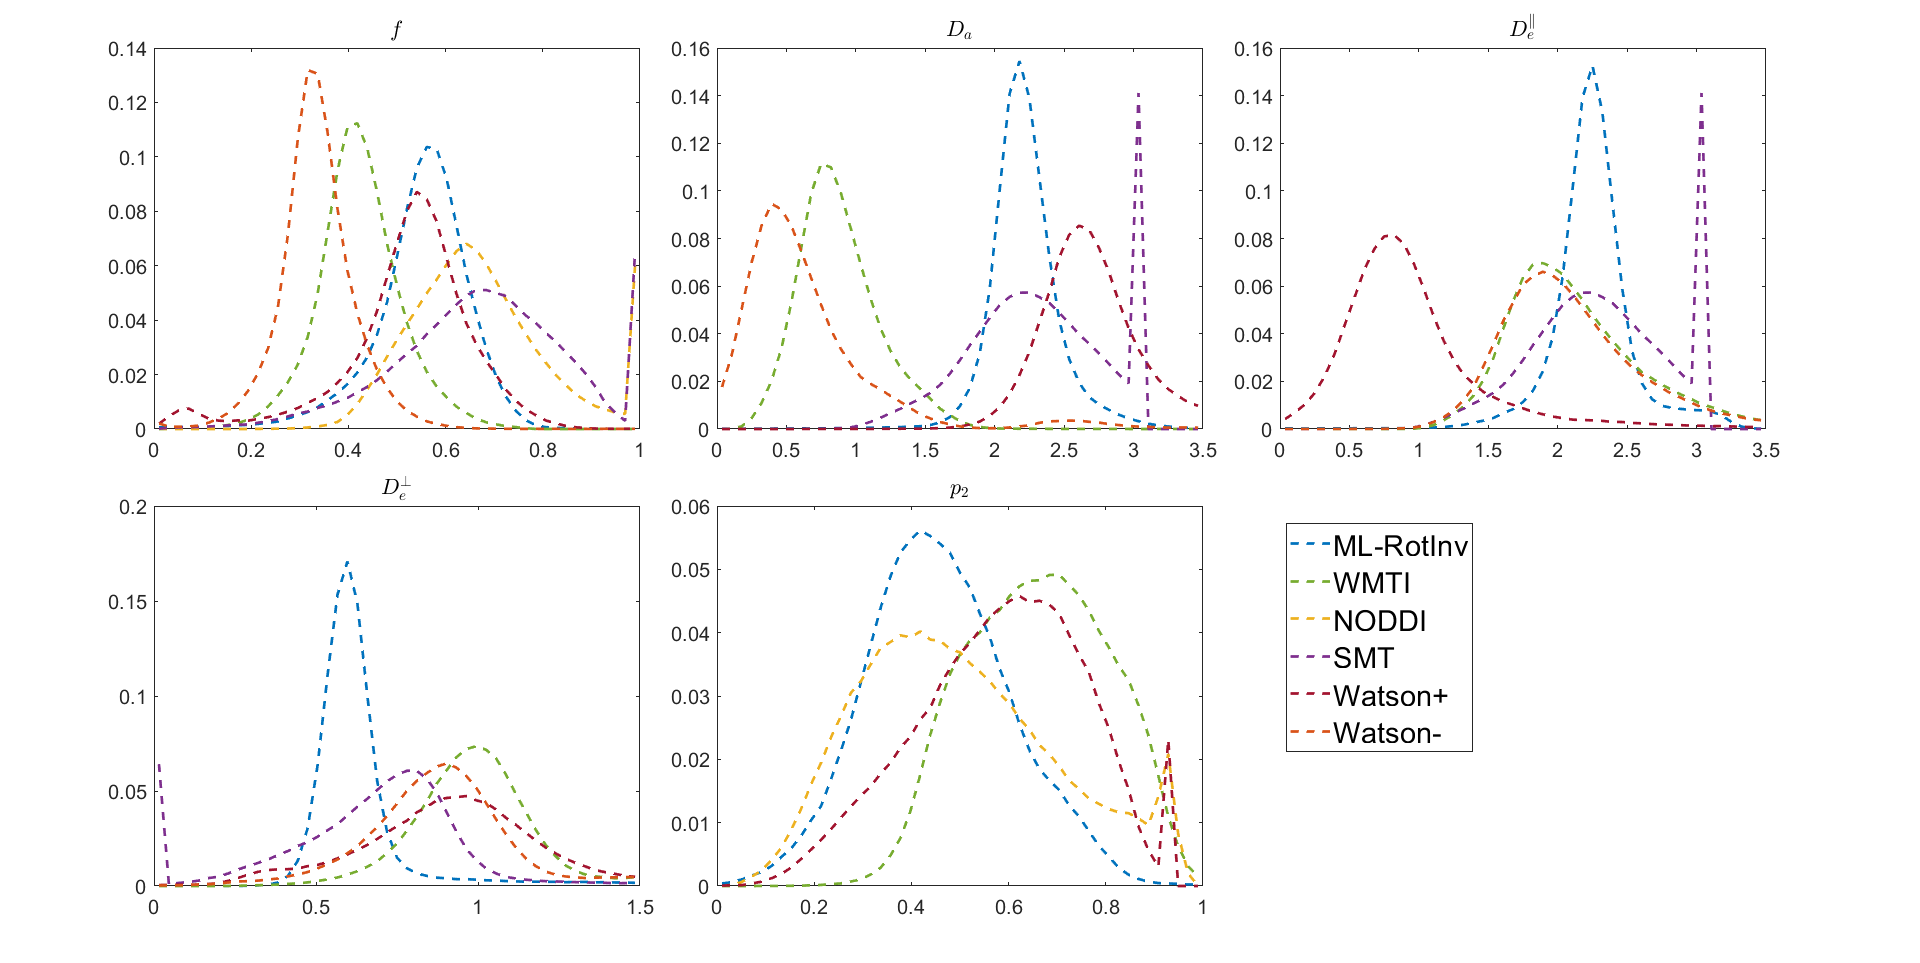
Fig. 4 demonstrates that the distribution of SM parameters in real data agrees with the bias predicted by the noise propagation in Fig. 1.
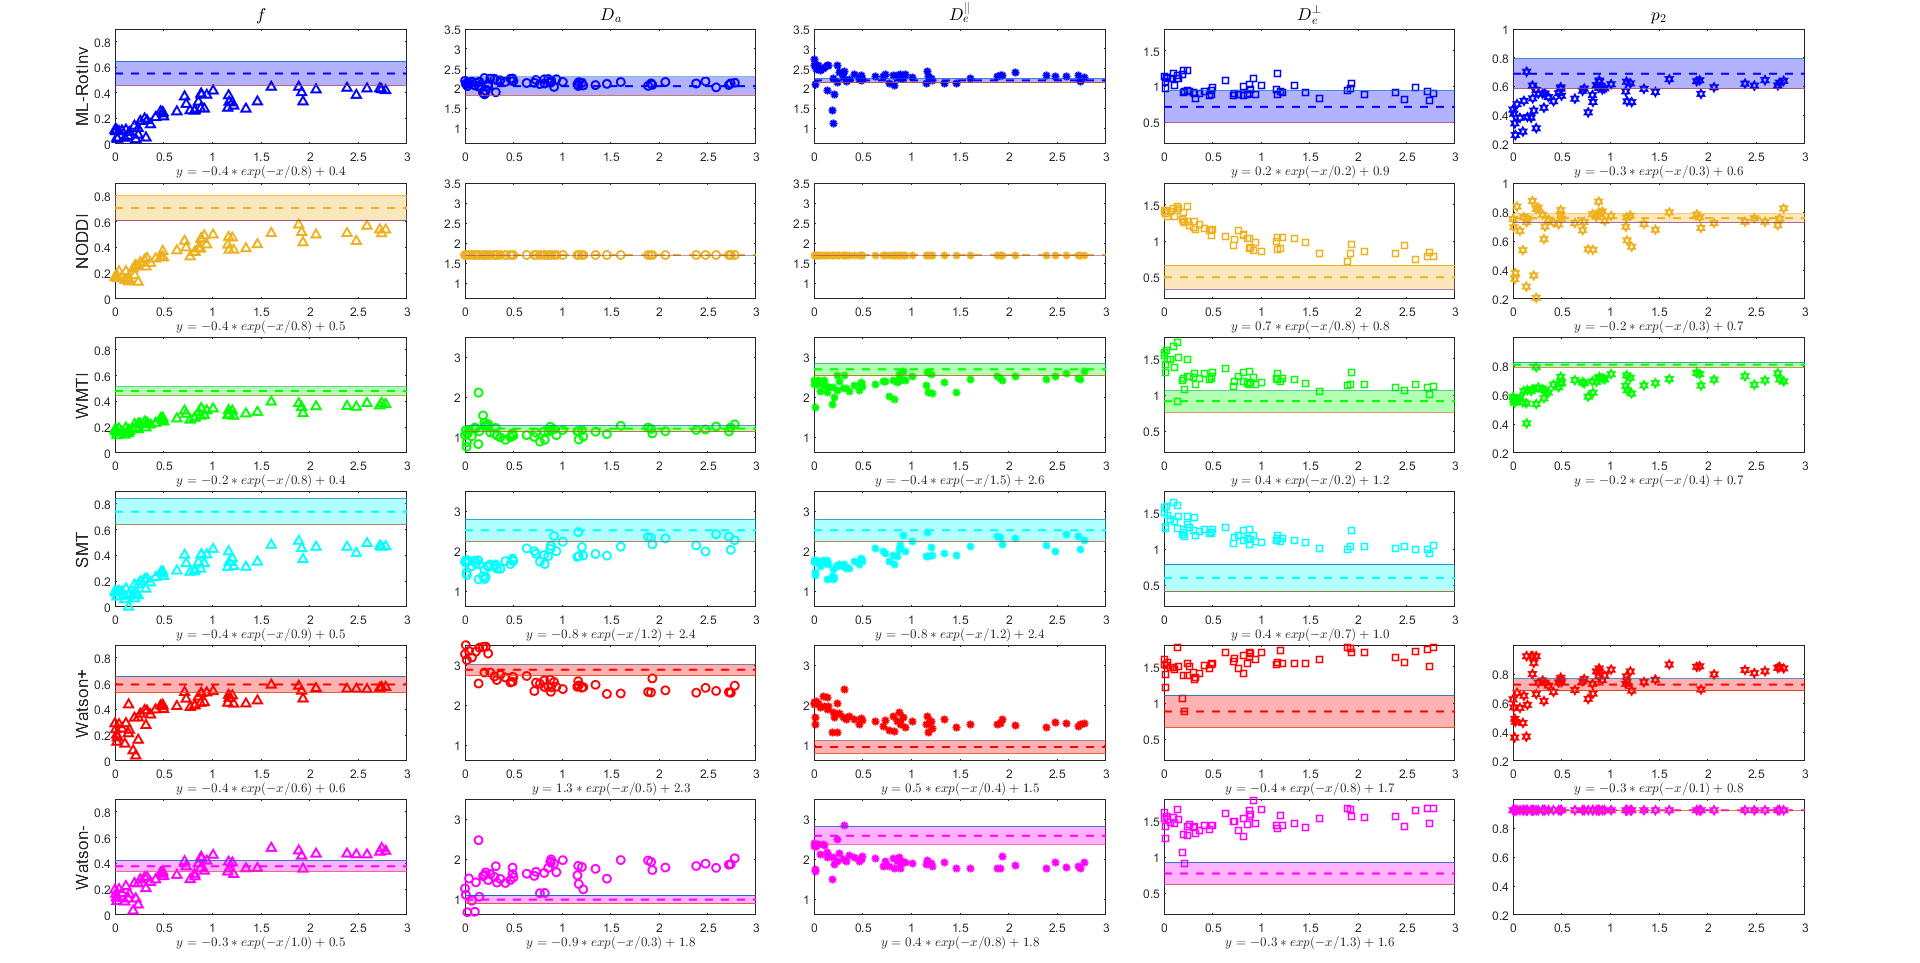
Fig. 5 exhibits a clear increase in $$$f$$$ and $$$p_{2}$$$ and decrease in $$$D_{e}^{\bot}$$$ in the splenium of corpus callosum, suggesting myelination and pruning takes place in the early development of human brain.
Discussion
ML-RotInv shows a more realistic trajectory of brain development in infancy, whereas NODDI has a less clear upward trend for $$$p_2$$$ in the first 6 months of development and SMT has a large gap in $$$f$$$ and $$$D_{e}^{\bot}$$$ between development data and the adult reference. In addition, the abnormally low estimation of $$$f$$$ by ML-RotInv in newborn infants could be caused by the exchange between IAS and EAS through unmyelinated axons, which is not accounted for by SM.Conclusion
ML-RotInv has the best overall estimation performance under three different quality metrics in simulation and shows consistent results between infants and adults. By using a data-driven approach, ML-RotInv achieves higher precision without imposing artificial constraints that might introduce unknown biases. We believe ML-RotInv can more faithfully estimate SM parameters under the broader aim of achieving specificity to the microstructural changes in WM.Acknowledgements
This work was performed under the rubric of the Center for Advanced Imaging Innovation and Research (CAI2R, https://www.cai2r.net), a NIBIB Biomedical Technology Resource Center (NIH P41-EB017183). This work has been supported by NIH under NINDS award R01 NS088040 and NIBIB awards R01 EB027075.References
1. Novikov, Dmitry S., et al. "Rotationally-invariant mapping of scalar and orientational metrics of neuronal microstructure with diffusion MRI." NeuroImage 174 (2018): 518-538.
2. Fieremans, Els, Jens H. Jensen, and Joseph A. Helpern. "White matter characterization with diffusional kurtosis imaging." Neuroimage 58.1 (2011): 177-188.
3. Jespersen, Sune Nørhøj, et al. "Diffusion time dependence of microstructural parameters in fixed spinal cord." Neuroimage 182 (2018): 329-342.
4. Zhang, Hui, et al. "NODDI: practical in vivo neurite orientation dispersion and density imaging of the human brain." Neuroimage 61.4 (2012): 1000-1016.
5. Kaden, Enrico, et al. "Multi-compartment microscopic diffusion imaging." NeuroImage 139 (2016): 346-359.
6. Reisert, Marco, et al. "Disentangling micro from mesostructure by diffusion MRI: a Bayesian approach." Neuroimage 147 (2017): 964-975.
7. Jelescu, Ileana O., et al. "One diffusion acquisition and different white matter models: how does microstructure change in human early development based on WMTI and NODDI?." Neuroimage 107 (2015): 242-256.
8. Vieni, Casey, et al. "Effect of intravoxel incoherent motion on diffusion parameters in normal brain." Neuroimage 204 (2020): 116228.
9. Ades-Aron, Benjamin, et al. "Evaluation of the accuracy and precision of the diffusion parameter EStImation with Gibbs and NoisE removal pipeline." NeuroImage 183 (2018): 532-543.
10. Veraart, Jelle, et al. "Denoising of diffusion MRI using random matrix theory." Neuroimage 142 (2016): 394-406.
11. Lee, Hong‐Hsi, Dmitry S. Novikov, and Els Fieremans. "Removal of partial Fourier‐induced Gibbs (RPG) ringing artifacts in MRI." Magnetic Resonance in Medicine (2021).
12. Andersson, Jesper LR, and Stamatios N. Sotiropoulos. "An integrated approach to correction for off-resonance effects and subject movement in diffusion MR imaging." Neuroimage 125 (2016): 1063-1078.
13. Mori, Susumu, et al. MRI atlas of human white matter. Elsevier, 2005.
Figures
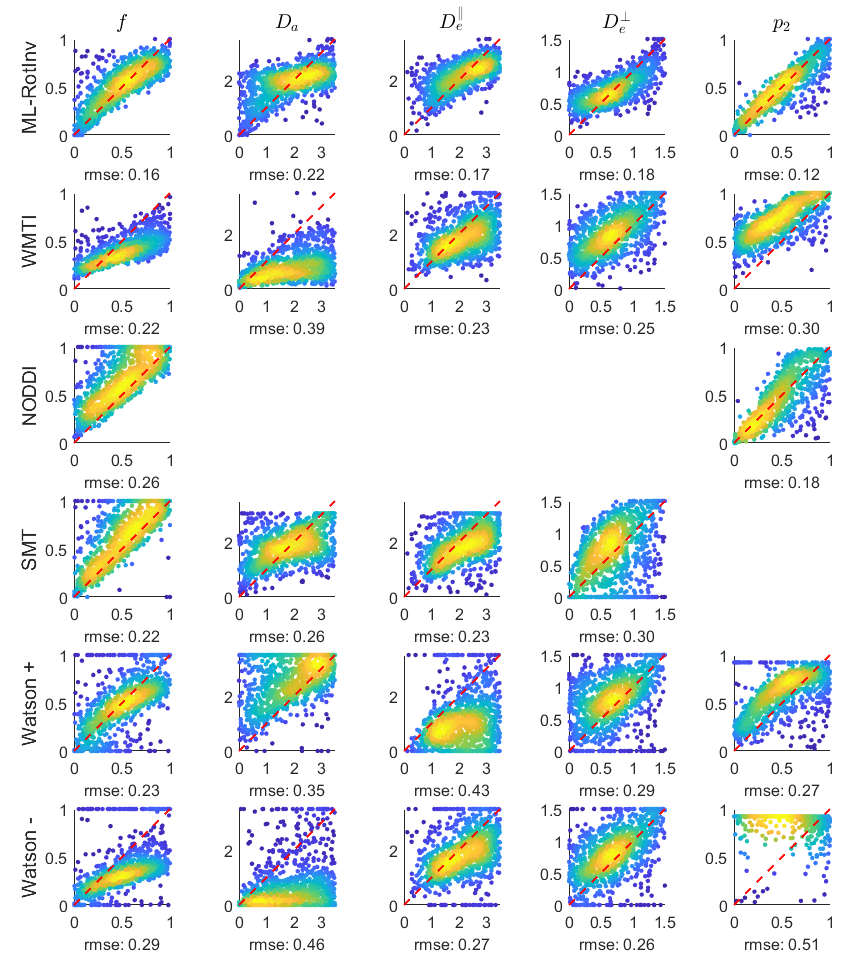
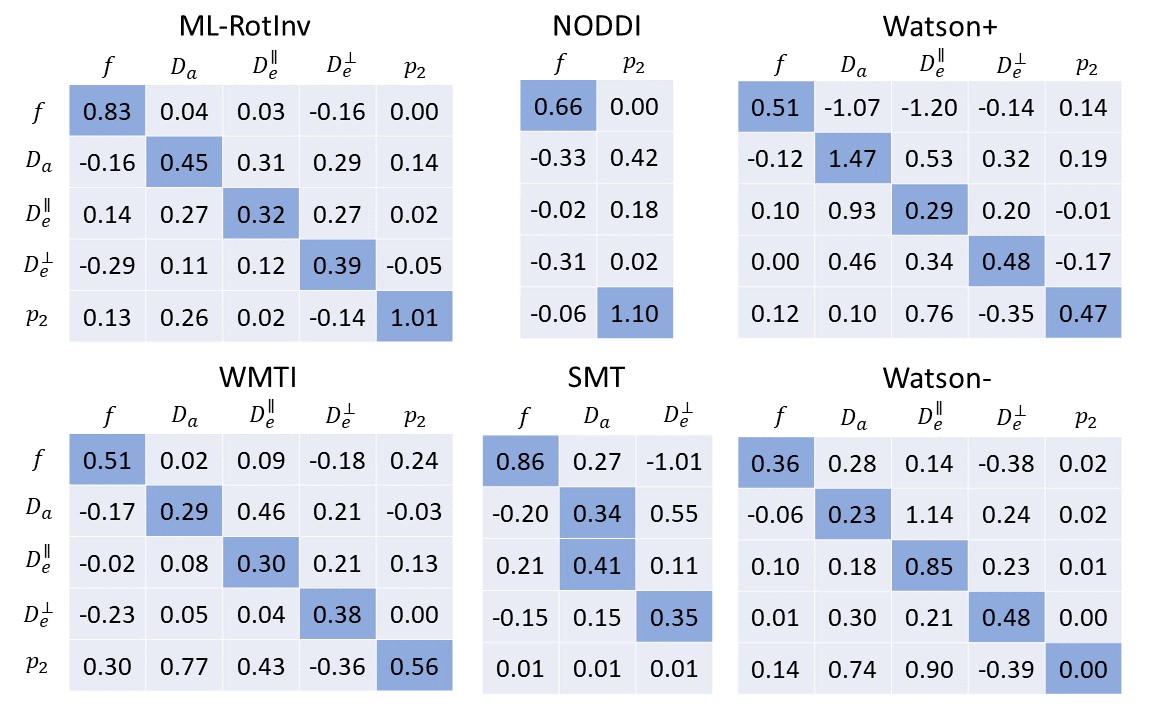
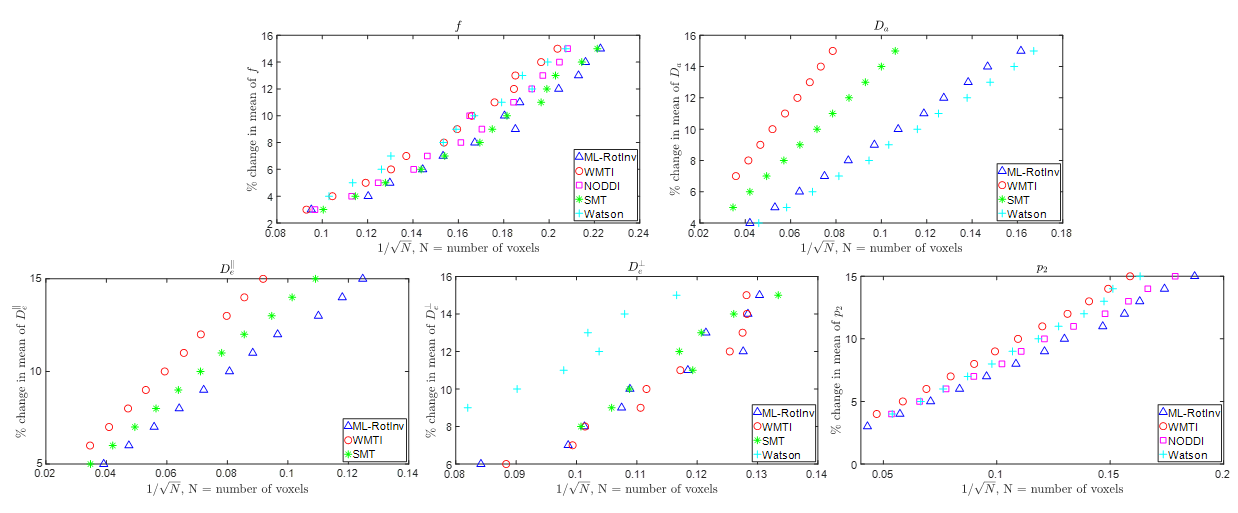
Fig. 3. The number of voxels needed to detect a given percentage of change in the ground truth. N (number of voxels) is shown in the x-axis as the inverse of its square root because the ability to detect significant changes is proportional to the square root of N. Deviation from a straight line may result from the nonlinearity of the parameter estimation. The data points on the right suggests stronger ability to detect changes.