0766
Longitudinal evaluation of bundle-wise diffusion metrics in a region of fiber crossing for axonal degeneration and inflammation1Radiology, New York University School of Medicine, New York, NY, United States, 2University of Eastern Finland, Kuopio, Finland, 3Institute of Neurobiology, Universidad Nacional Autonoma de Mexico, Queretaro, Mexico, 4Boston Children's Hospital, Harvard Medical School, Boston, MA, United States, 5Center of Research in Mathematics, Guanajuato, Mexico
Synopsis
Single fiber methods, such as the diffusion tensor, cannot accurately determine per-bundle characteristics in voxels occupied by multiple axonal populations specially in the case of pathology when they have different diffusion properties. In this work, we used animal models of axonal degeneration and inflammation to evaluate longitudinally the sensitivity of bundle specific metrics provided by three multi-fiber methods in a region of crossing fiber in which only one fiber population is injured.
Introduction
Inflammation and axonal degeneration are pathological conditions present in many neurodegenerative diseases. Diffusion MRI (dMRI) has the potential to identify micro-structural changes due to these conditions and track them as they progress in time. While the diffusion tensor has been used to provide information regarding microstructure in regions of single fiber populations1, multiple-fiber methods must be used to infer tissue information in voxels that include crossing fibers, specially if the underlying tissue properties of the fiber bundles are different due to pathology. In previous works2-4, three multi-fiber methods: Spherical Deconvolution5,6,7 (CSD), Multi-Resolution Discrete-Search8 (MRDS) and the Distribution of 3D-Anisotropic-Microstructural-environments in Diffusion-compartment-imaging (DIAMOND)9, were evaluated and validated with histology in a region of fiber crossings in which only one fiber population was affected with axonal degeneration in a chronic stage. The three methods were able to detect and follow per-bundle microstructural changes. Here we expand these works by evaluating the ability of these multiple-fiber methods to longitudinally detect axonal degeneration and inflammation at crossing fiber regions.Methods
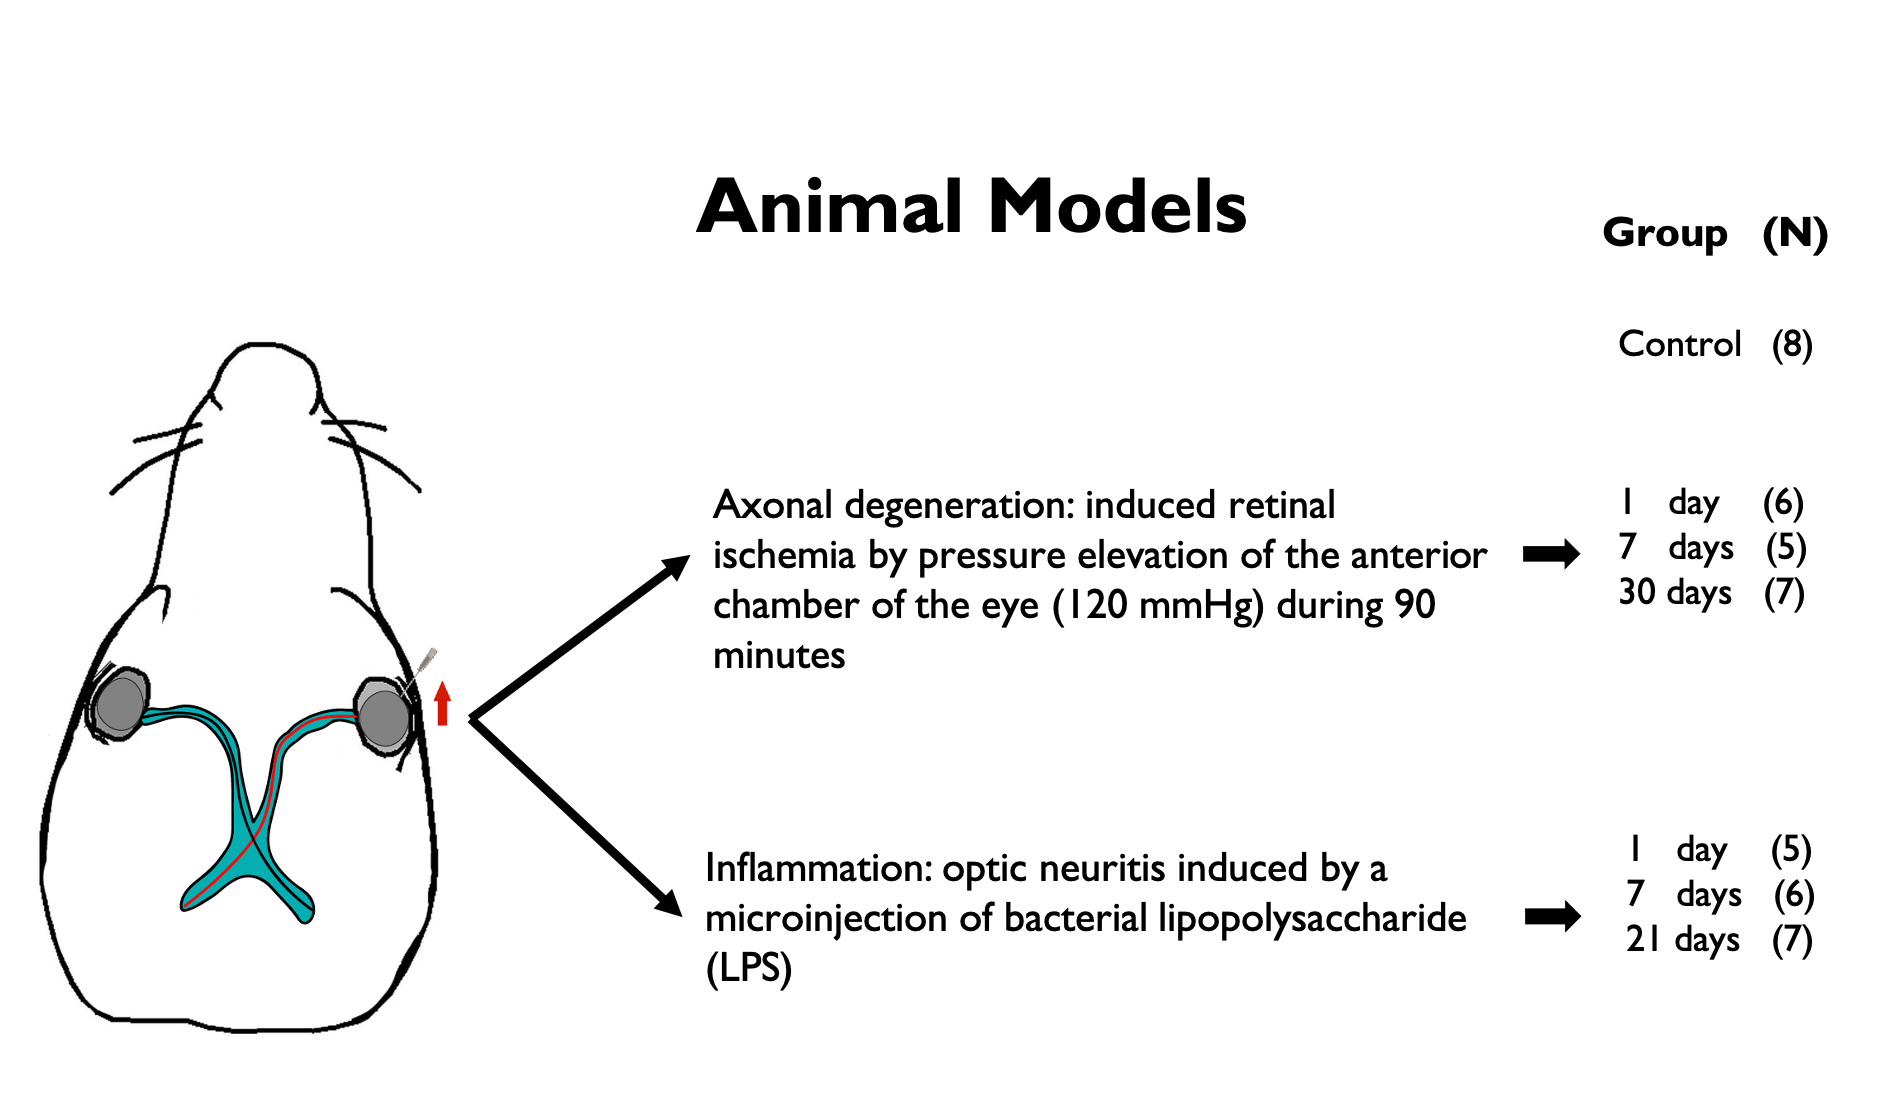
Animal preparation: Axonal degeneration of the optic pathway was induced through unilateral retinal ischemia10,11,12 in 18 Wistar rats. Neuritis of the optic pathway was induced by a microinjection of bacterial lipopolysaccharide13 (LPS) into the optic nerve in another group of 18 Wistar rats. Animals for each condition were divided into 3 groups according to time of euthanasia/fixation following injury (1, 7 and 30 days for ischemia; 1, 7 and 21 days for inflammation). Eight rats served as controls. Tissue was fixed by transcardial perfusion with paraformaldehyde, glutaraldehyde, PBS and gadolinium. Brains were extracted including optic nerves and chiasm.dMRI Imaging: Ex-vivo diffusion MRI (dMRI) data with voxel resolution of 80x80x80 mm3 was acquired on a 7T Bruker Pharmascan (Gmax=760 mT/m) at 21°C using a Helium-cooled coil by applying 54, 52, 34 and 20 diffusion gradient directions for b = 7, 5, 3 and 1 ms/μm2, respectively; with $$$\delta/\Delta$$$=4.9/10.84 ms, in addition to 20 non-diffusion weighted images. TR/TE=250/25.19 ms.
dMRI processing: Images were denoised15, corrected for Gibbs ringing16, bias field inhomogeneities17, motion correction distortions18 and Rician bias19. For multi-shell multi-tissue CSD computation estimation of the white matter response function (RF) was restricted to voxels whitin normal optic nerves; the three tissue RFs were averaged among all specimens and the resulting mean RF was used to compute fiber orientation distribution functions (fODF) for each animal. Manually-drawn ROIs were delineated at the level of each optic nerve and at the center of the chiasm. Metrics obtained for each lobe of the fODF were: apparent fiber density (AFD), peak lobe amplitude, dispersion and complexity. Multi-tensors (MT) were estimated using MRDS and DIAMOND, which derived tensor metrics corresponding to each fiber bundle, namely compartment sizes, fractional anisotropy (FA), and axial, radial and mean diffusivities (MD). Axial and radial heterogeneity metrics were also obtained for DIAMOND. The (single) tensor model was also fitted and evaluated at the level of the optic nerves.
Results and discussion
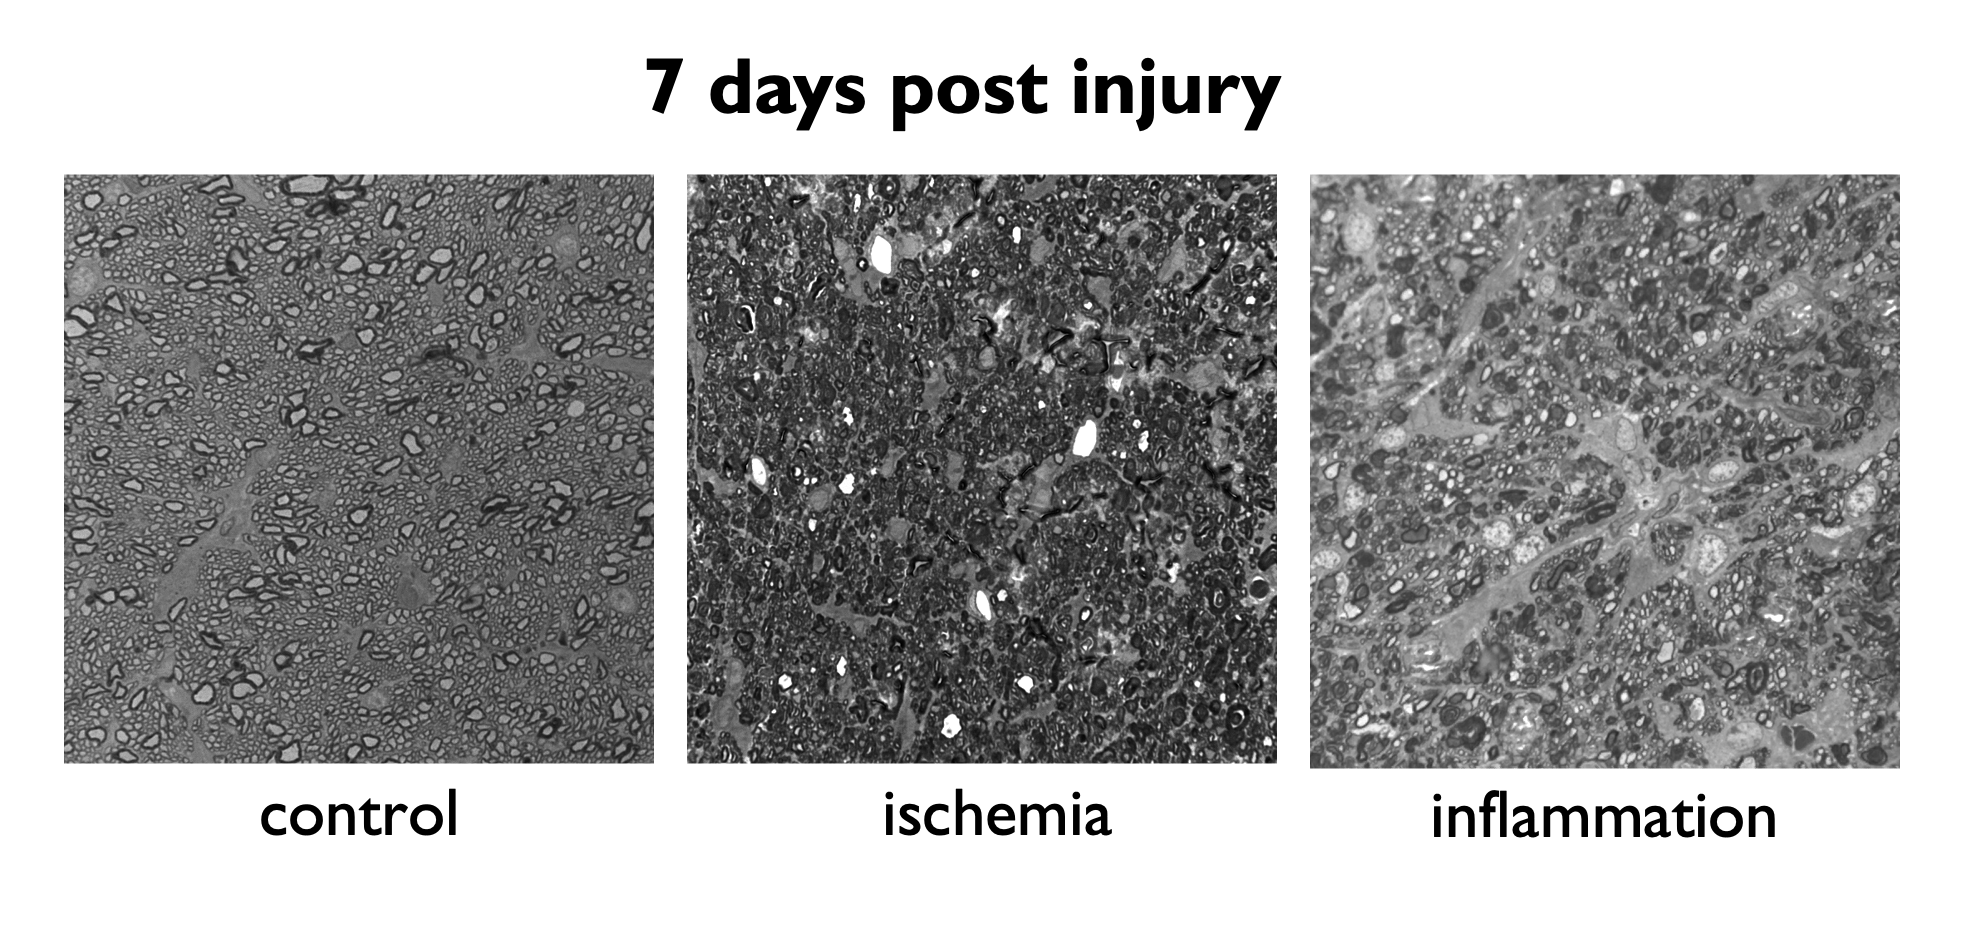
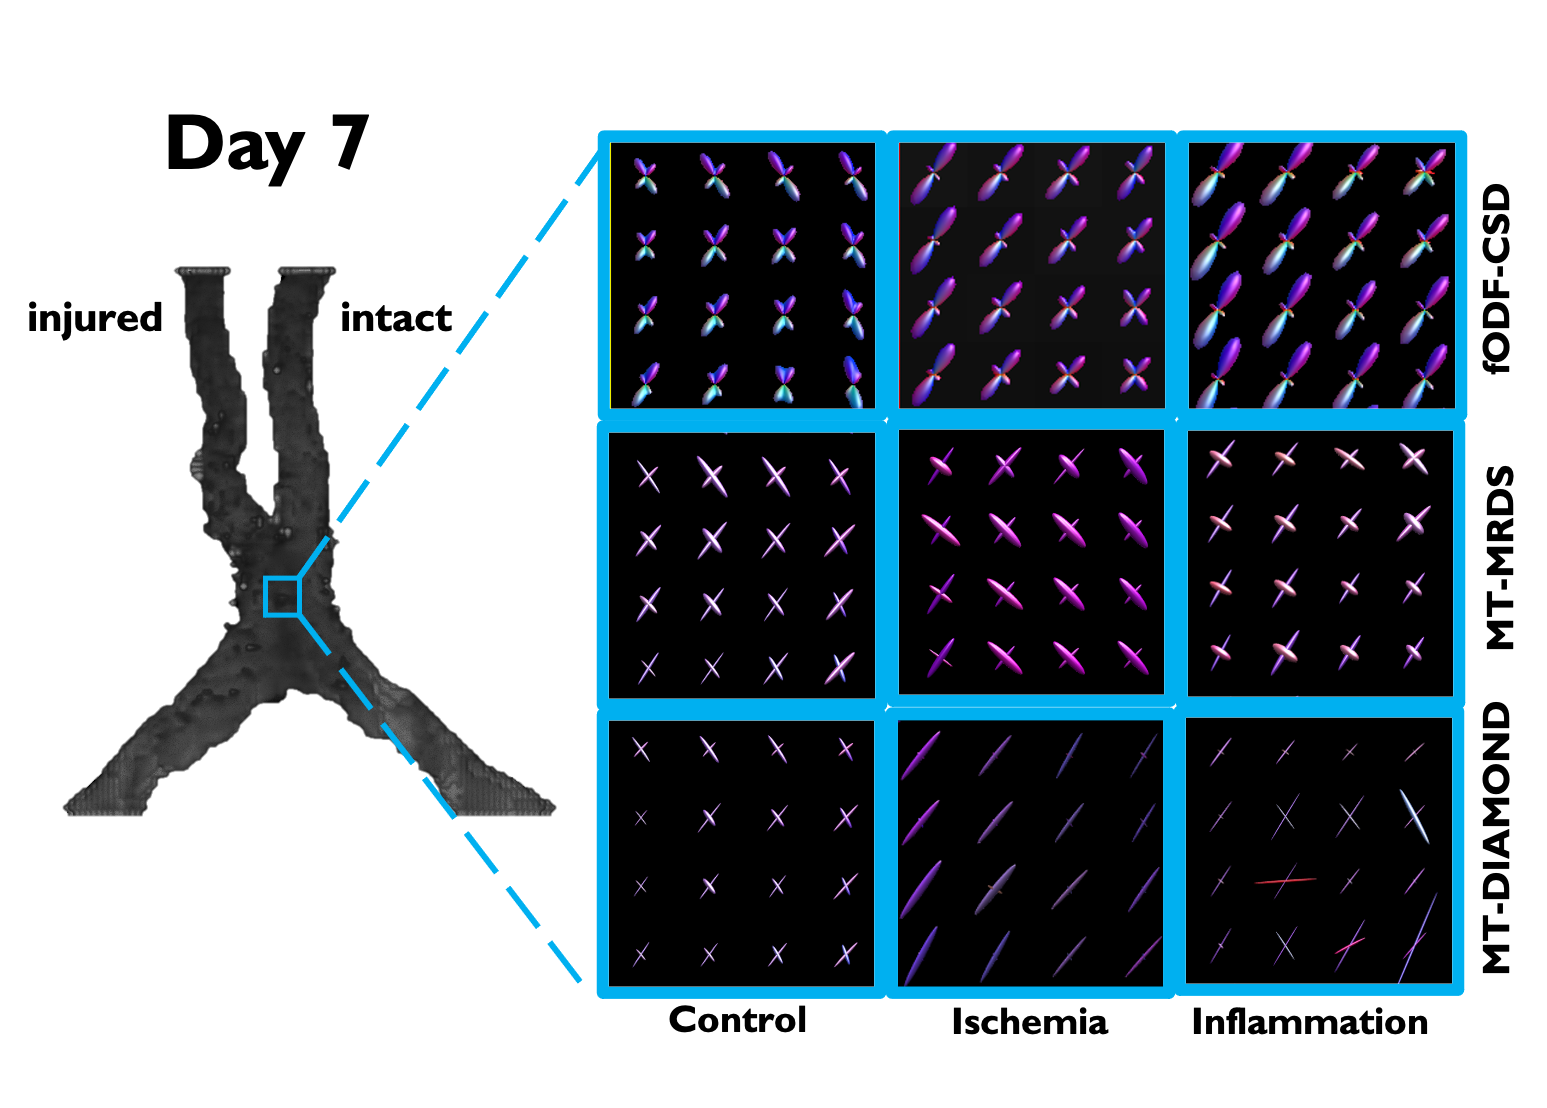
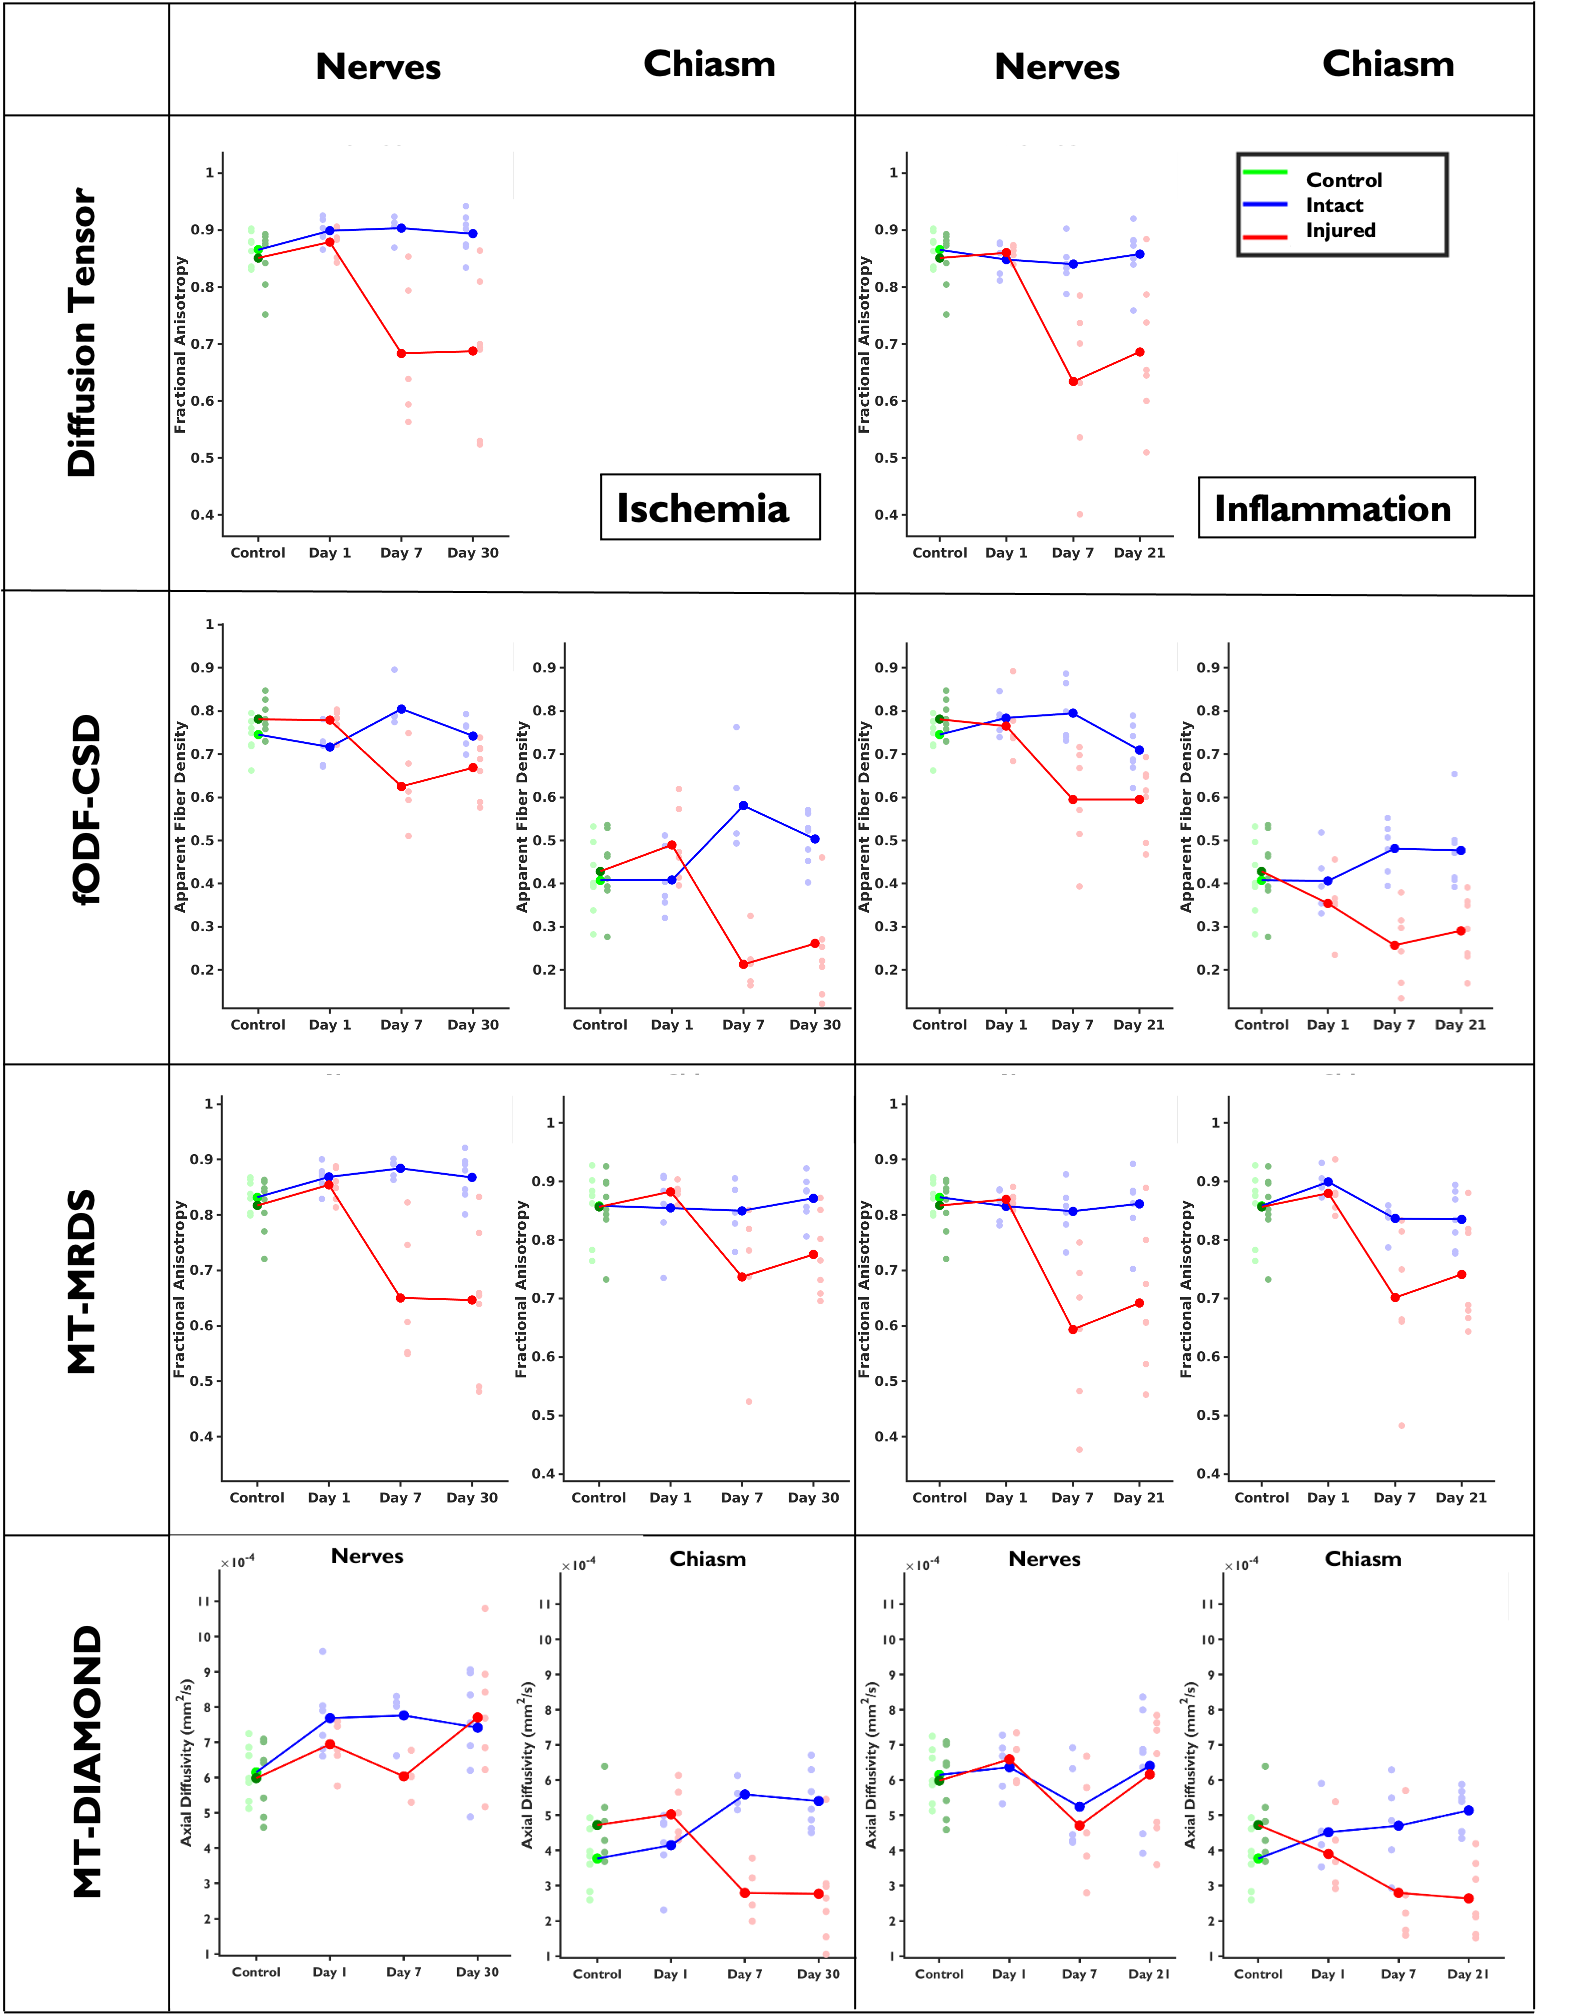
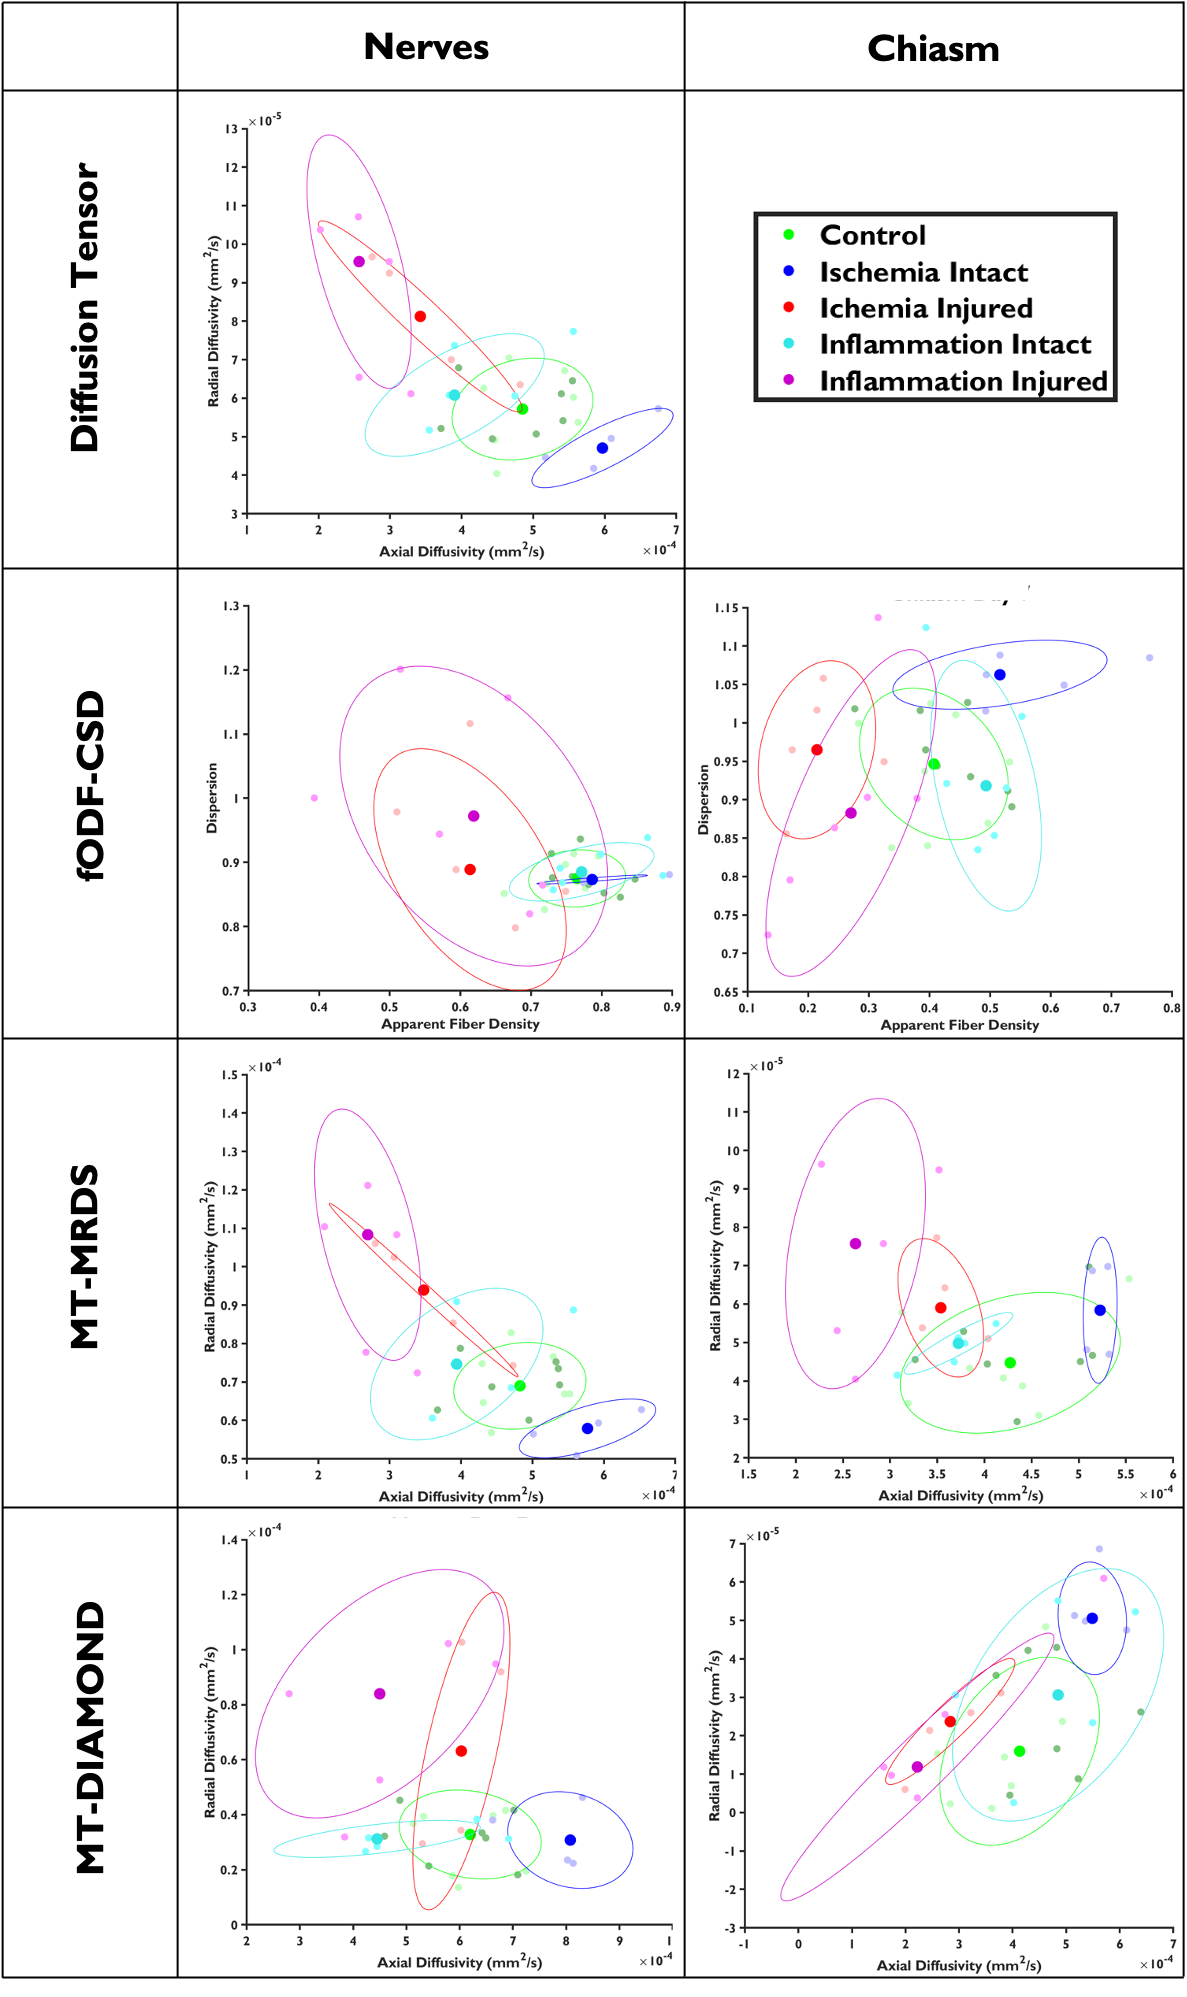
A schematic describing the animal models and experimental groups is shown in Figure 1. By obtaining 2D optical microscopy images of the injured nerves, we can be observe that damage in the tissue due to both conditions is evident at 7 days post-injury with respect with the normal nerves in the control group (Figure 2). Observing the fODFs obtained from CSD and the multi-tensors obtained from MRDS and DIAMOND in the chiasm region of one animal in the 7 days post-injury group of both conditions (Figure 3), the reduction in the size of the lobes of the fODFs and the reduction of the size and the anisotropy of the tensors indicate that these methodologies can detect the damage expected from histology at 7 days. Tracking longitudinally the changes in the values of some per-bundle metrics: AFD for CSD, FA for MRDS and axial diffusivity for DIAMOND (Figure 4), it is observed that no metric was able to detect changes between the intact and the injured nerve at 1 days post-operation, but all of them were able to detect differences caused by the damage at 7 and 21/30 days. In order to understand better these changes caused by ischemia and inflammation at 7 days post injury, Figure 5 shows 2D scatter plots, for the nerves and the chiasm, of axial against radial diffusivities for DT, MRDS and DIAMOD and of AFD against dispersion from CSD. For CSD it is observed that a reduction in the AFD differentiates the intact from the injured nerves on both conditions, as has been observed before for ischemia3,4, while inflammation caused increased values in the dispersion metric. For the tensor-based methods, a reduction in the axial diffusivity and an increase of the radial diffusivity is observed for both conditions, in agreement with previous results for ischemia3,4,11,12, however, the inflammation caused bigger changes in both parameters.Conclusion
Multi-tensor and CSD derived per-bundle metrics are sensitive to tissue abnormalities even in presence of crossing fibers as demonstrated in this work using animal models for axonal degeneration and inflammation. Future work will be focused in compare these metrics with metrics obtained from histology: axon density, cellularity, etc.Acknowledgements
Imaging was performed at the National Laboratory for Magnetic Resonance Imaging (Conacyt, UNAM, CIMAT, UAQ). We thank Juan Ortiz-Retana and Gema Martinez for technical assistance. This work was funded by CONACYT (FC 1782) and UNAM-DGAPA (IG200117, IN204720).References
1. Wint Yan Aung, Soe Mar, Tammie Ls Benzinger. Diffusion tensor MRI as a biomarker in axonal and myelin damage. Imaging Med. 2013;5(5):427-440.
2. Concha et al., Diffusion MRI of axonal degeneration in areas of fiber crossing: Histological correspondence. Proc ISMRM 2017
3. Gilberto Rojas-Vite, Ricardo Coronado-Leija, Omar Narvaez-Delgado, Alonso Ramírez-Manzanares, José Luis Marroquín, Ramsés Noguez-Imm, Marcos L Aranda, Benoit Scherrer, Jorge Larriva-Sahd, Luis Concha. Histological validation of per-bundle water diffusion metrics within a region of fiber crossing following axonal degeneration. Neuroimage. 2019;201:116013
4. Omar Narvaez, Ricardo Coronado-Leija, Gilberto Rojas-Vite, Marcos Aranda, Alonso Ramirez-Manzanares, Jose Luis Marroquin, Jorge Larriva-Sahd, and Luis Concha. Longitudinal evaluation of bundle-wise water diffusion changes following axonal degeneration in a region of fiber crossing. Proc ISMRM 2019.
5. Tournier JD, Calamante F, Connelly A. Robust determination of the fibre orientation distribution in diffusion MRI: non-negativity constrained super-resolved spherical deconvolution. Neuroimage. 2007 May 1;35(4):1459-72.
6. Jeurissen B, Tournier JD, Dhollander T, Connelly A, Sijbers J. Multi-tissue constrained spherical deconvolution for improved analysis of multi- shell diffusion MRI data. Neuroimage. 2014 103:411-426.
7. Riffert TW, Schreiber J, Anwander A, Knösche TR. Beyond fractional anisotropy: Extraction of bundle-specific structural metrics from crossing fiber models. NeuroImage. 2014;100:176– 191.
8. Coronado-Leija R, Ramírez-Manzanares A, Marroquín JL. Estimation of individual axon bundle properties by a Multi-Resolution Discrete-Search method. Med. Image Anal. 2017;42:26-43.
9. Benoit Scherrer, Armin Schwartzman, Maxime Taquet, Mustafa Sahin, Sanjay P Prabhu, Simon K Warfield. Characterizing brain tissue by assessment of the distribution of anisotropic microstructural environments in diffusion-compartment imaging (DIAMOND). Magn Reson Med. 2016;76(3):963-77.
10. Adachi M, Takahashi K, Nishikawa M, Miki H, Uyama M. High intraocular pressure- induced ischemia and reperfusion injury in the optic nerve and retina in rats. Graefes Arch. Clin. Exp. Ophthalmol. Albrecht Von Graefes Arch. Für Klin. Exp. Ophthalmol. 1996;234(7):445–451.
11. Song SK, Sun SW, Ju WK, et al. Diffusion tensor imaging detects and di!erentiates axon and myelin degeneration in mouse optic nerve after retinal ischemia. Neuroimage. 2003;20(3):1714–22.
12. Sun S-W, Liang H-F, Cross AH, Song S-K. Evolving Wallerian degeneration after transient retinal ischemia in mice characterized by diffusion tensor imaging. NeuroImage. 2008;40:1– 10.
13. Marcos L Aranda, María F González Fleitas, Hernán H Dieguez, Georgia A Milne, Julián D Devouassoux, María I Keller Sarmiento, Mónica Chianelli, Pablo H Sande, Damián Dorfman, Ruth E Rosenstein. Therapeutic benefit of environmental enrichment on optic neuritis. Neuropharmacology. 2019;145(Pt A):87-98.
14.L Torre-Fuentes, L Moreno-Jiménez, V Pytel, J A Matías-Guiu, U Gómez-Pinedo, J Matías- Guiu. Experimental models of demyelination and remyelination[Article in En, Spanish]. Neurologia. 2020;35(1):32-39.
15. Jelle Veraart, Dmitry S Novikov, Daan Christiaens, Benjamin Ades-Aron, Jan Sijbers, Els Fieremans. Denoising of diffusion MRI using random matrix theory. Neuroimage. 2016;142:394-406.
16. Elias Kellner, Bibek Dhital, Valerij G Kiselev, Marco Reisert. Gibbs-ringing artifact removal based on local subvoxel-shifts. Magn Reson Med. 2016;76(5):1574-1581.
17. Nicholas J Tustison, Brian B Avants, Philip A Cook, Yuanjie Zheng, Alexander Egan, Paul A Yushkevich, James C Gee. N4ITK: improved N3 bias correction. IEEE Trans Med Imaging. 2010;29(6):1310-20.
18. B B Avants, C L Epstein, M Grossman, J C Gee. Symmetric diffeomorphic image registration with cross-correlation: evaluating automated labeling of elderly and neurodegenerative brain. Med Image Anal. 2008;12(1):26-41.
19. H Gudbjartsson, S Patz. The Rician distribution of noisy MRI data. Magn Reson Med. 1995;34(6):910-4.
20. Tournier J-D, Mori S, Leemans A. Diffusion tensor imaging and beyond. Magn. Reson. Med. 2011;65(6):1532–1556.
Figures