0763
Towards a gold standard for fiber orientations in the brain: Validating dMRI using scattered light and X-ray imaging
Marios Georgiadis1, Miriam Menzel2, David Gräßel2, Ivan Rajkovic3, Donald Born1, Markus Axer2, and Michael Zeineh1
1Stanford University School of Medicine, Stanford, CA, United States, 2Institute of Neuroscience and Medicine (INM-1), Forschungszentrum Jülich, Julich, Germany, 3Stanford Synchrotron Radiation Lightsource, SLAC National Accelerator Laboratory, Menlo Park, CA, United States
1Stanford University School of Medicine, Stanford, CA, United States, 2Institute of Neuroscience and Medicine (INM-1), Forschungszentrum Jülich, Julich, Germany, 3Stanford Synchrotron Radiation Lightsource, SLAC National Accelerator Laboratory, Menlo Park, CA, United States
Synopsis
Generating a detailed network model of the brain requires a correct mapping of fiber orientations. Diffusion MRI is sensitive to neuronal alignment, yet each voxel contains hundreds of axons and other structures. Light and X-ray scattering can reveal more detailed information about nerve fibers, with much higher resolution and specificity respectively. Here we combine two methods, namely Scattered Light Imaging (SLI) and 3D-scanning small-angle X-ray scattering (3D-sSAXS), aiming to provide a micrometer-resolution gold standard for fiber orientation imaging. We compare that to high-resolution diffusion MRI of a region with challenging fiber orientations, the corona radiata, in human and non-human primates.
Introduction
Disentangling the complex nerve fiber network in the brain is a key to understand its function and treat neurological diseases. The detailed reconstruction of crossing, long-range fiber pathways in densely-packed white matter poses a major challenge. Diffusion-MRI (dMRI) is sensitive to neuronal orientations, with resolutions typically down to a few hundred micrometers in post-mortem human brains1-2, insufficient to resolve individual nerve fibers, and with signal being affected by all brain structures, healthy or pathological. X-ray scattering probes myelin sheath layers (∼ nm) and is sensitive to the orientation of myelinated fibers via 3D-scanning small-angle X-ray scattering (3D-sSAXS)3-4. Optical light scattering is sensitive to regular arrangements of nerve fibers (diameters ∼ μm) and can disambiguate crossing fibers5-6; this can be applied to whole brain tissue samples with micrometer in-plane resolution using Scattered Light Imaging (SLI)7-9. Here we combine SLI, 3D-sSAXS, and dMRI measurements for investigating white matter architecture by comparing dMRI measurements of a human brain sample (crossing fibers in the corona radiata) to SLI and 3D-sSAXS measurements of a vervet brain sample (similar region in the corona radiata).Methods
The study pipeline is shown in Fig. 1.Tissue preparation:
The human brain (66yo male, from Stanford ADRC Biobank) was removed from the skull within 24 hours post-mortem, fixed in formalin, and cut into coronal 1cm-thick slabs. A 3.5x3.5x1cm3 specimen containing part of the corona radiata was extricated. For dMRI, the specimen was degassed and scanned in fomblin.
The vervet monkey brain (2.4yo adult male, Wake Forest IACUC #A11-219) was removed from the skull soon after death, 4% formaldehyde-fixed for several weeks, cryoprotected in 20% glycerin, deeply frozen, cryotome-cut into 60μm-thick sections, mounted on glass slides, embedded in 20% glycerin, and cover-slipped. Two sections (no. 501 and 511) were measured with SLI several months afterwards. For 3D-sSAXS, the brain sections were re-immersed in PBS, placed in-between two #1.5 coverslips, and measured two weeks later.
dMRI:
The human brain tissue was MRI-scanned on a Bruker 11.7T scanner, using a 12-segment SE-EPI sequence at 200μm isotropic voxels; TR=400ms, TE=40ms, δ=7ms, Δ=40ms, FOV=40x36x21mm3, 200 q-space points (20@b=1ms/μm2, 40@b=2ms/μm2, 60@b=5ms/μm2, 80@b=10ms/μm2) and 20@b=0ms/μm2. After denoising and degibbsing10-11, fiber responses and orientation distributions were computed using the dwi2response and dwi2fod functions in mrtrix3, using multi-tissue, multi-shell algorithms, and visualized in mrview.
Scattered Light Imaging:
Vervet brain sections containing the corona radiata were measured with angular SLI7-8 (illumination angle θ~45°, ϕ=15° steps, exposure time=0.5sec) and SLI scatterometry9 (2x2 LED setup, 1 LED step (80x80), exposure time=1sec) using a 128x128 RGB-LED display light source and 3μm in-plane resolution.
X-ray scattering:
3D-sSAXS3-4 was performed on the same vervet brain sections at beamline 4-2 of the Stanford Synchrotron Radiation Lightsource: beam diameter=100μm, Ephoton=15keV, exposure time=0.7sec, rotation angles: -60° to 60°, in 15° steps.
Results
We used the vervet corona radiata as the closest model to the human radiata to test and cross-validate the light and X-ray scattering methods. Figure 2 shows SLI and 3D-sSAXS fiber orientations for the two vervet brain sections; although each method probes different tissue scales, the orientations are highly coincident. SLI resolution is clearly superior (px=3μm instead of 100μm), allowing to track small fibers traversing the caudate nucleus (yellow arrow). The through-plane cingulum bundle is more sensitively depicted by X-ray.Regarding crossing fibers, Figure 3A(2) shows the cross in the X-ray scattering pattern at q=0.75nm-1 (corresponding to 17.5-nm myelin periodicity4), indicative of the two different orientations, distinct from the single orientation in the corpus callosum (1). SLI scatterometry in this region also demonstrates its ability to identify both fiber orientations (cross in the light scattering patterns) with micrometer resolution.
The human specimen dMRI scan shows a reduced fractional anisotropy (FA) and increased T2 weighted resonance (T2w) in regions of fiber crossings (Fig. 4), while axonal water fraction (AWF) relatively homogeneously reflects the heavily myelinated fiber content of the region. As expected, DTI tensor eigenvector orientation is insufficient for directionality in the corona radiata, contrary to the multiple orientations seen with the fiber orientation distribution retrieved with multi-tissue constrained spherical deconvolution (Fig. 4, bottom), indicative of fiber crossings.
Figure 5 shows the fiber orientations from dMRI (human) in comparison to the fiber orientations from SLI (vervet) in the corona radiata. In addition to the fibers running from the upper left to the bottom (prominent green bundle in 3D-sSAXS, see Fig. 2), fibers fanning out from the corpus callosum are visible both in dMRI and SLI, with SLI having higher analysis and sharper orientation distributions.
Discussion
We employed state-of-the-art methods for assessing complex fiber orientations, in the corona radiata of human and non-human primates. Combining the micrometer resolution of light scattering (SLI) and the specificity of X-ray scattering (3D-sSAXS), we could cross-validate the fiber orientations, and obtained highly similar results for the vervet corona radiata. This complicated fiber architecture of the same region was discernible with high-resolution diffusion MRI-scan of a human specimen. SLI can retrieve crossings in this area with higher resolution and sharper orientation distributions. Our ongoing work will include dMRI, SLI, 3D-sSAXS on the same specimens, to provide a “gold-standard” methodology for assessing fiber orientations in brain sections on the 100-micrometer scale and below.Acknowledgements
Research was supported by the National Institutes of Health (NIH) award number R01AG061120-01, and by the Helmholtz Association port-folio theme “Supercomputing and Modeling for the Human Brain”, the European Union’s Horizon 2020 Research and Innovation Programme under Grant Agreement No. 945539 (“Human Brain Project” SGA3).References
- Calabrese, E., Adil, S.M., Cofer, G., Perone, C.S., Cohen-Adad, J., Lad, S.P., Johnson, G.A.: “Postmortem diffusion MRI of the entire human spinal cord at microscopic resolution”. NeuroImage: Clinical 18, 963–971, 2018
- Roebroeck, A., Miller, K., Aggarwal, M.: “Ex vivo diffusion MRI of the human brain: technical challenges and recent advances”. NMR Biomed. E3941, 2018
- Georgiadis, M., Schroeter, A., Gao, Z., Guizar-Sicairos, M., Novikov, D.S., Fieremans, E., Rudin, M.: “Retrieving neuronal orientations using 3D scanning SAXS and comparison with diffusion MRI”. NeuroImage 204, 116214, 2020
- Georgiadis, M., Schroeter, A., Gao, Z. et al.: “Nanostructure-specific X-ray tomography reveals myelin levels, integrity and axon orientations in mouse and human nervous tissue“. Nature Communications 12, 2941, 2021
- Menzel, M., Axer, M., De Raedt, H., Costantini, I., Silvestri, L., Pavone, F. S., Amunts, K., Michielsen, K.: “Toward a High-resolution Reconstruction of 3D Nerve Fiber Architectures and Crossings in the Brain using Light Scattering Measurements and Finite-Difference Time-Domain Simulations”. Physical Review X 10, 021002, 2020
- Menzel, M., Pereira, S. F.: “Coherent Fourier scatterometry reveals nerve fiber crossings in the brain”. Biomedical Optics Express 11(8), 4735-4758, 2020
- Menzel, M., Reuter, J. A., Gräßel, D., Huwer, M., Schlömer, P., Amunts, K., Axer, M.: “Scattered Light Imaging: Resolving the substructure of nerve fiber crossings in whole brain sections with micrometer resolution”. NeuroImage 233, 117952, 2021
- Reuter J. A., Menzel, M.: “SLIX: A Python package for fully automated evaluation of Scattered Light Imaging measurements on brain tissue”. Journal of Open Source Software 5(54), 2675, 2020
- Menzel, M., Ritzkowski, M., Reuter, J. A., Gräßel, D., Amunts, K., Axer, M.: “Scatterometry Measurements with Scattered Light Imaging Enable New Insights into the Brain’s Nerve Fiber Architecture”. Frontiers in Neuroanatomy (accepted), arXiv:2108.13481, 2021
- Ades-Aron, B., Veraart, J., Kochunov, P., McGuire, S., Sherman, P., Kellner, E., Novikov, D. S., Fieremans, E.: “Evaluation of the accuracy and precision of the diffusion parameter EStImation with Gibbs and NoisE removal pipeline”. NeuroImage 183, 532-543, 2018
- Veraart, J., Fieremans, E., Novikov, D.S.: “Diffusion MRI noise mapping using random matrix theory”. Magnetic Resonance in Medicine 76(5), 1582-1593, 2016
- Moeller, K., Willmes, K., Klein, E.: “A review on functional and structural brain connectivity in numerical cognition”, Frontiers in Human Neuroscience 9, 2015
- Fieremans, E., J.H. Jensen, and J.A. Helpern, White matter characterization with diffusional kurtosis imaging. NeuroImage. 58(1), 177-188, 2011
Figures

Figure 1. Study pipeline: Scattered Light Imaging (SLI) and 3D-scanning small-angle X-ray scattering (3D-sSAXS) were performed on coronal vervet brain sections (containing crossings fibers in the corona radiata) and compared to diffusion MRI measurements of a human brain sample (1-cm thick slab of a similar region). The schematic drawing of fiber tracts was adapted from Moeller et al.12.
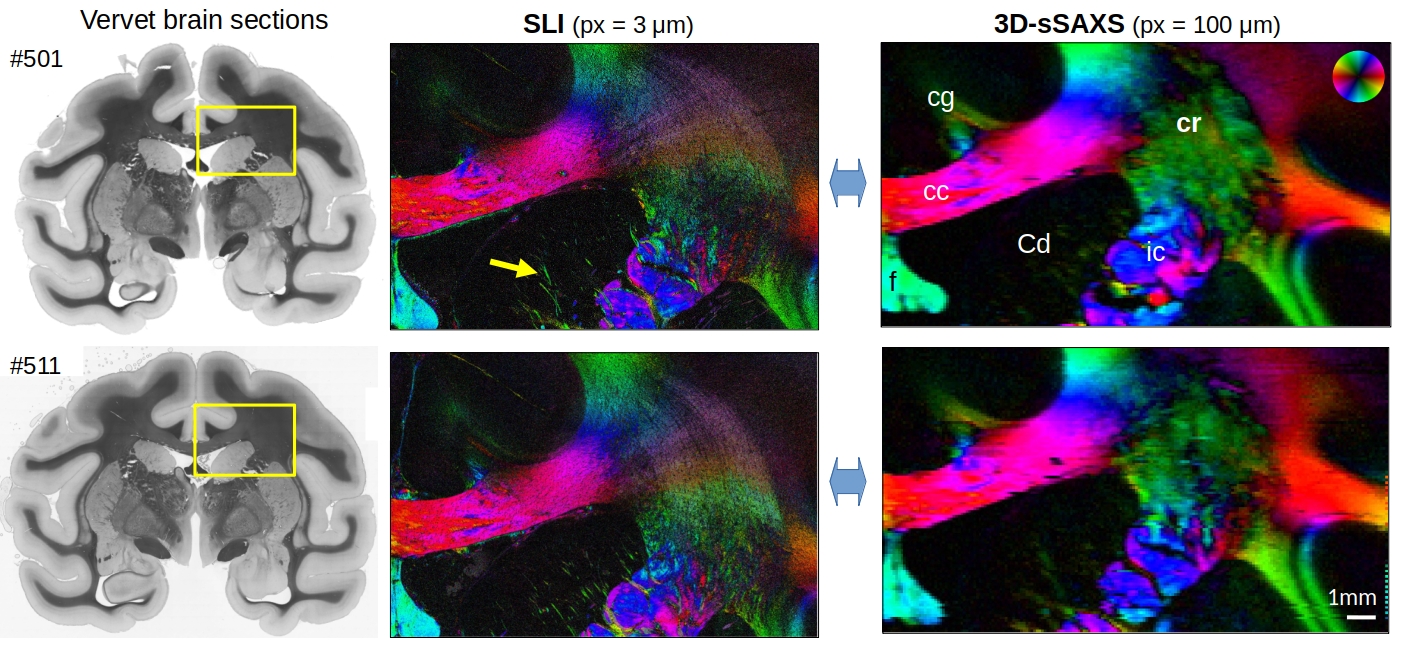
Figure 2. Fiber orientation maps from SLI and 3D-sSAXS measurements of the same brain section (two coronal vervet brain sections no. 501 and 511): The images on the left show the transmittance of the brain sections. The images on the right show the in-plane fiber orientations in different colors (see color sphere in upper right corner) for the measured region (marked by yellow rectangle): cc = corpus callosum, cg = cingulum, cr = corona radiata, ic = internal capsule, Cd = caudate nucleus.

Figure 3. Scattering patterns obtained from 3D-sSAXS (top) and SLI scatterometry (bottom) on the vervet brain section no. 511 evaluated in a region with parallel fiber bundles in the corpus callosum (1) and in a region with two crossing fiber bundles in the corona radiata (2). The top left image shows the total scattered intensity from 3D-sSAXS, the bottom left image a magnification of the red box with the SLI scattering patterns for every 20th image pixel.
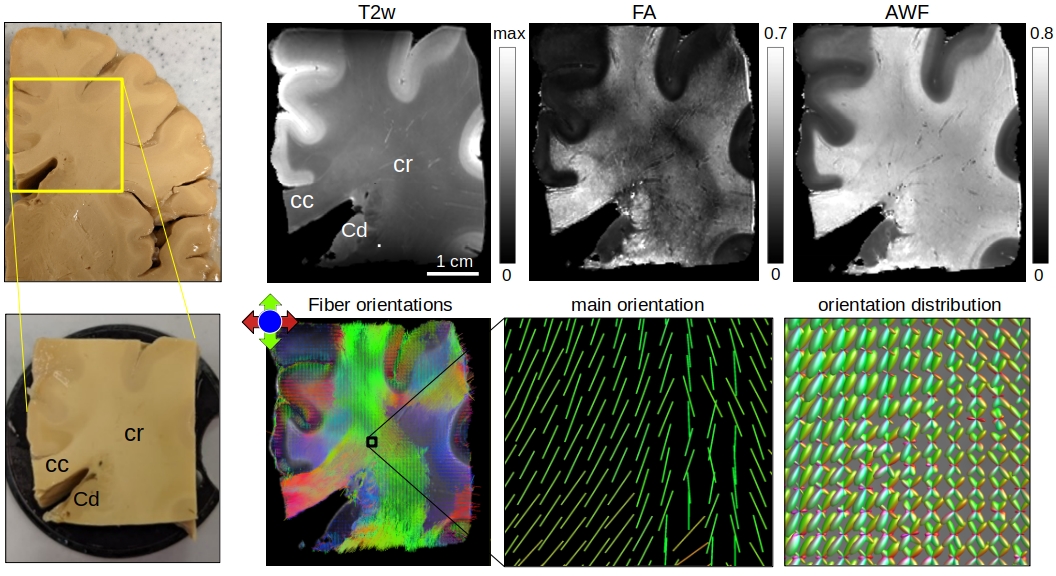
Figure 4. dMRI measurement of the human specimen (left). Top: virtual slice from the T2-weighted image (T2w), fractional anisotropy (FA), and axonal water fraction (AWF) -from White Matter Tract Integrity analysis10,13. Bottom: fiber orientation maps; main orientation (tensor fitting) and orientation distribution (multi-shell constrained spherical deconvolution) for a region (black box) with partly crossing fibers in the corona radiata (cr). cc = corona radiata, Cd = caudate nucleus.
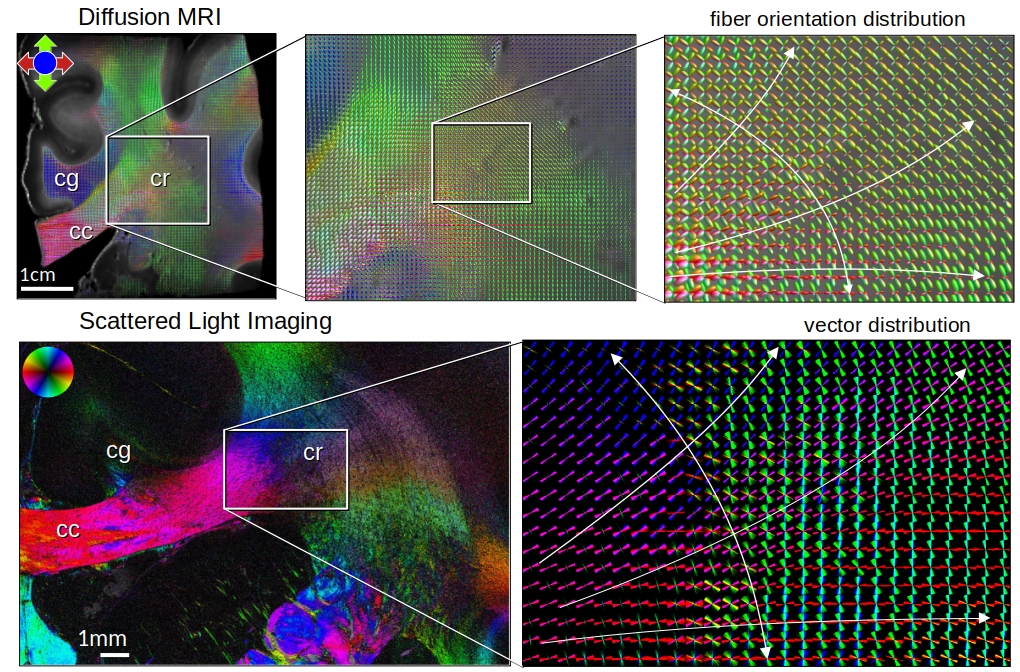
Figure 5. Fiber orientation distributions in the corona radiata from dMRI (human brain sample, top) and SLI (vervet brain section, bottom). The dMRI fiber orientations were calculated for each 200μm isotropic voxel. In the SLI vector distribution map, each pixel depicts orientations of 50x50 image pixels (px=3μm) superimposed. SLI has higher analysis and sharper orientation distributions, and can inform and disambiguate the dMRI orientations. cc = corpus callosum, cg = cingulum, cr = corona radiata.
DOI: https://doi.org/10.58530/2022/0763