0760
Respiration artifact-free 3D DESS T2 mapping of the human brain1Centre de Résonance Magnétique des Systèmes Biologiques, UMR5536, CNRS, Bordeaux, France
Synopsis
The Dual Echo Steady State (DESS) sequence has the potential to be used for 3D human brain imaging and 3D T2 mapping. It is however known to be sensitive to respiration. The DESS sequence was therefore modified to include a self-gating approach in order to investigate the influence of breathing on brain images and then extract artifact-free images. To apply this method for high resolution T2 mapping at 3T, an acceleration method compatible with Compressed Sensing was implemented to maintain a clinically acceptable acquisition time.
Introduction
The Dual Echo Steady State (DESS) sequence has often been used in musculo-skeletal MRI to rapidly obtain 3D high-contrast morphological images and 3D T2 mapping. Recent studies have shown its potential in brain1 and breast2 imaging. However, the sequence was shown to be sensitive to motion and B0 fluctuation induced by respiration. As a result, information from acquired images and reconstructed T2 maps is prone to deterioration.The objective of this work is i) to evaluate the influence of respiration on anatomical DESS brain images and the corresponding T2 maps, ii) to propose a method that allows the suppression of the alleged respiratory-artifacts whilst iii) ensuring that the acquisition time is clinically acceptable. This was achieved by developing a DESS sequence coupled with a retrospective self-gating (SG) method as well as a Compressed-Sensing (CS) reconstruction at 3T.
Methods
MR SystemThe acquisitions were carried out on a Siemens 3T PRISMA scanner and performed on two healthy volunteers. Respiration was recorded with a respiratory belt. Image reconstruction was done using Matlab in conjunction with the Berkeley Advanced Reconstruction Toolbox3 (BART).
Sequence
An in-house 3D DESS sequence was implemented with a self-gating approach (SG-DESS), acquiring 4 center k-space points at every TR, before the encoding gradients. A Compressed-Sensing4 encoding trajectory was then added (SG-CS-DESS) where a variable density Poisson disk CS mask was employed in the ky-kz plane, ensuring a fully sampled center of 24x24 voxels.
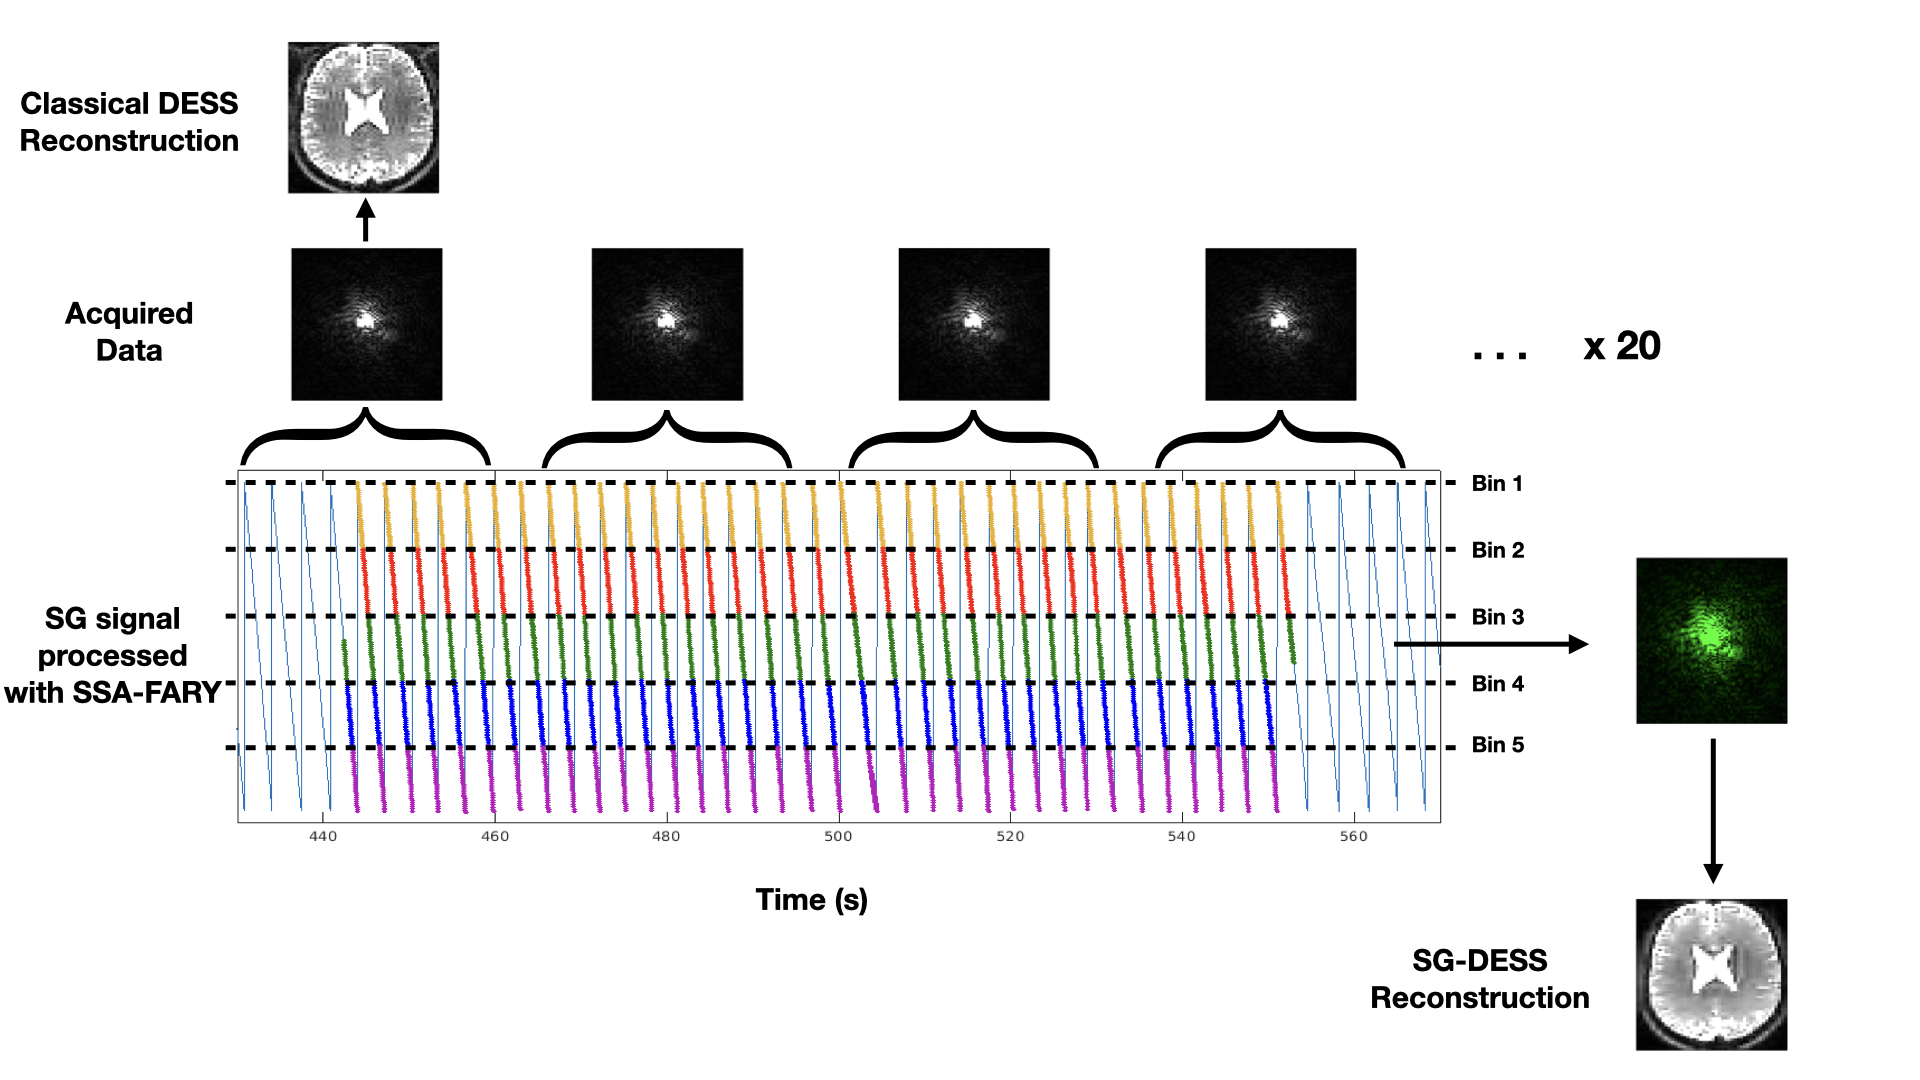
Reconstruction
For each DESS sequence, FID and Echo images were reconstructed. The SG points allowed grouping of the acquired data into 5 bins by following the SSA-FARY procedure5 and images were reconstructed from the 5 resulting k-spaces (Fig. 1). For CS reconstruction, joint parallel imaging and CS with spatial wavelet regularization and temporal regularization along the bins was performed. 3D T2 maps were obtained by fitting the image data to a previously computed dictionary simulated with extended phase graphs algorithms6,7, by using a range of T1 and B1 values. A MP2RAGE sequence4 (6min21sec for a 0.8mm isotropic) and a PreSat-TFL B1 mapping sequence8 (33sec, 1.7 x 1.7 x 6 mm3) were then acquired in order to obtain specific T1 and B1 values and increase estimation precision.
MR Acquisition
The classical DESS sequence was performed with 3mm and 1.5mm isotropic resolutions and NR=1 (Number of Repetitions) in 59sec and 4min33sec, respectively. The SG-DESS sequence with a 3mm isotropic resolution and NR=20 was acquired in 18min30sec to generate 5 sets of images (one for each bin). The SG-CS-DESS sequence with an acceleration factor 8, a 1.5mm isotropic resolution and NR=14 was performed in 9min48sec to generate 5 sets of images.
Results
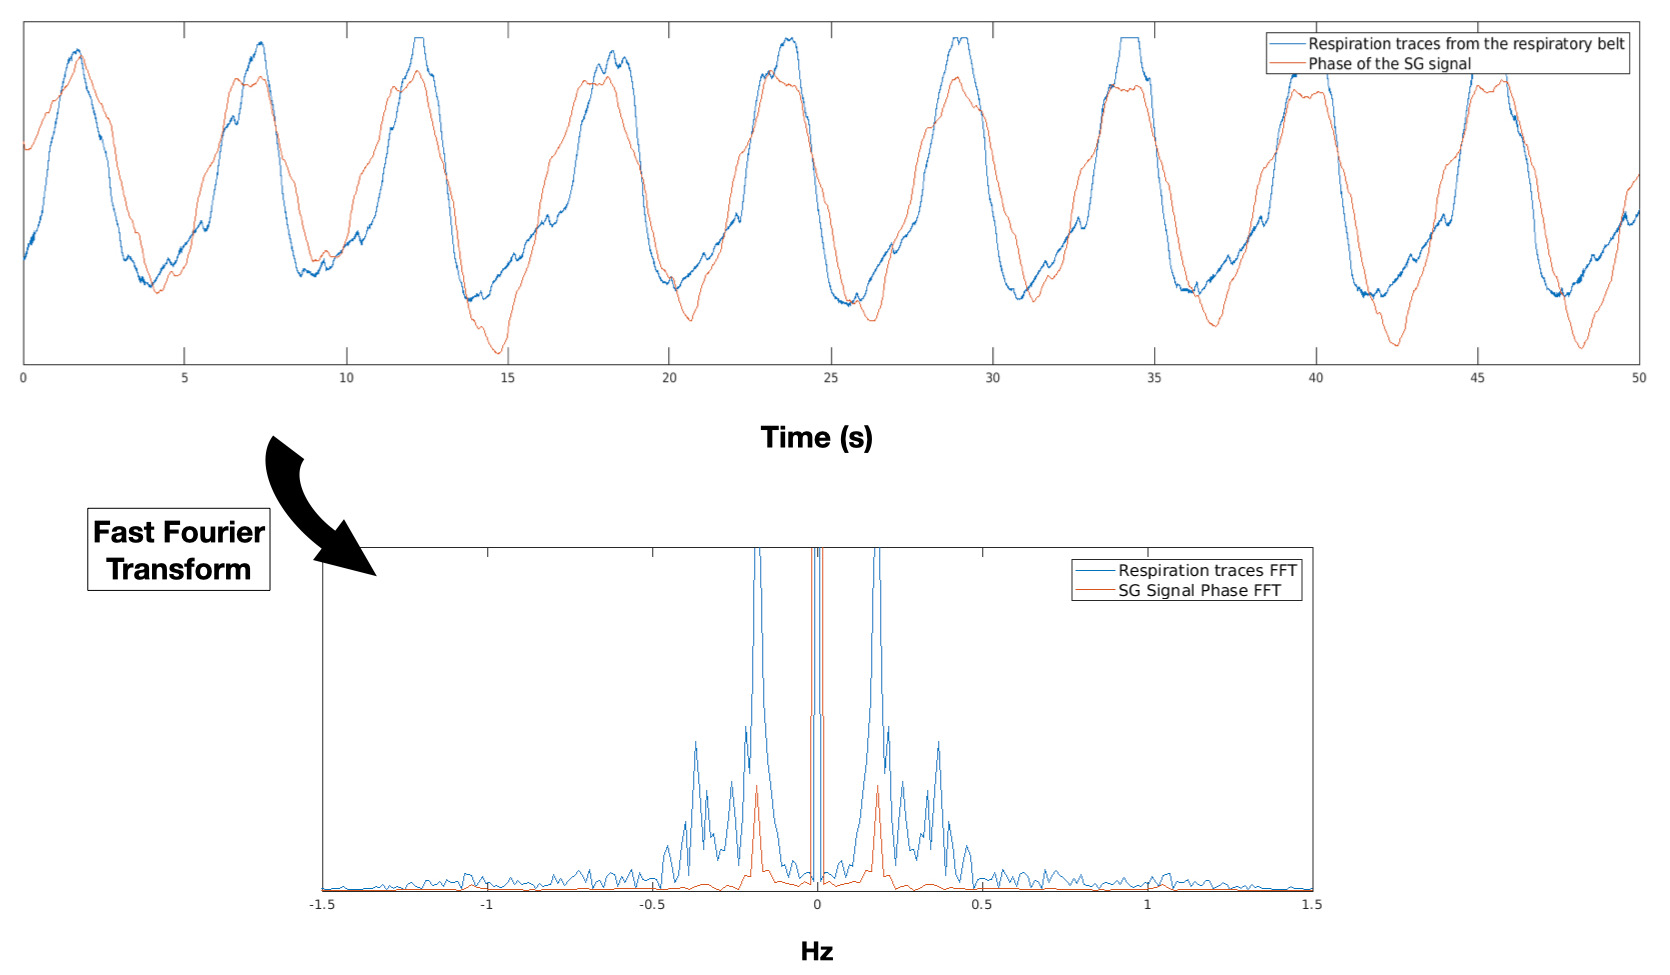
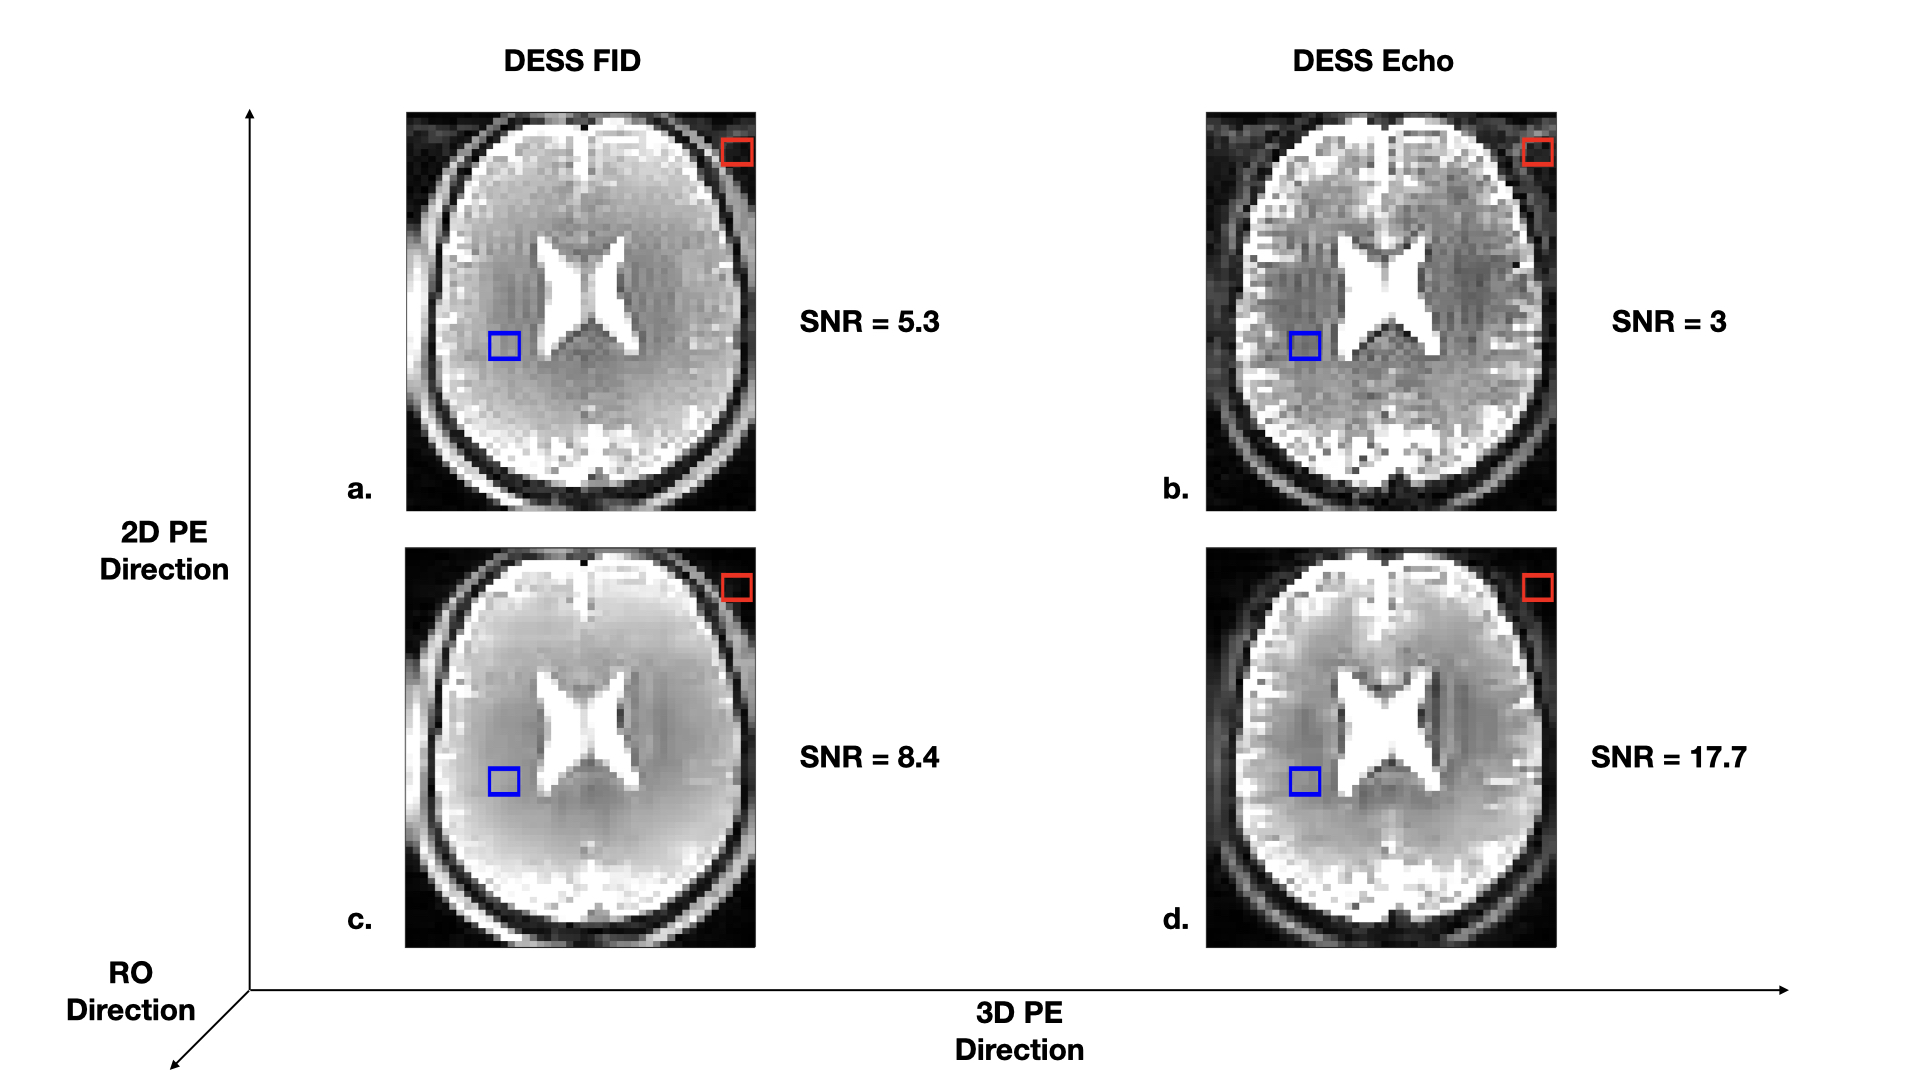
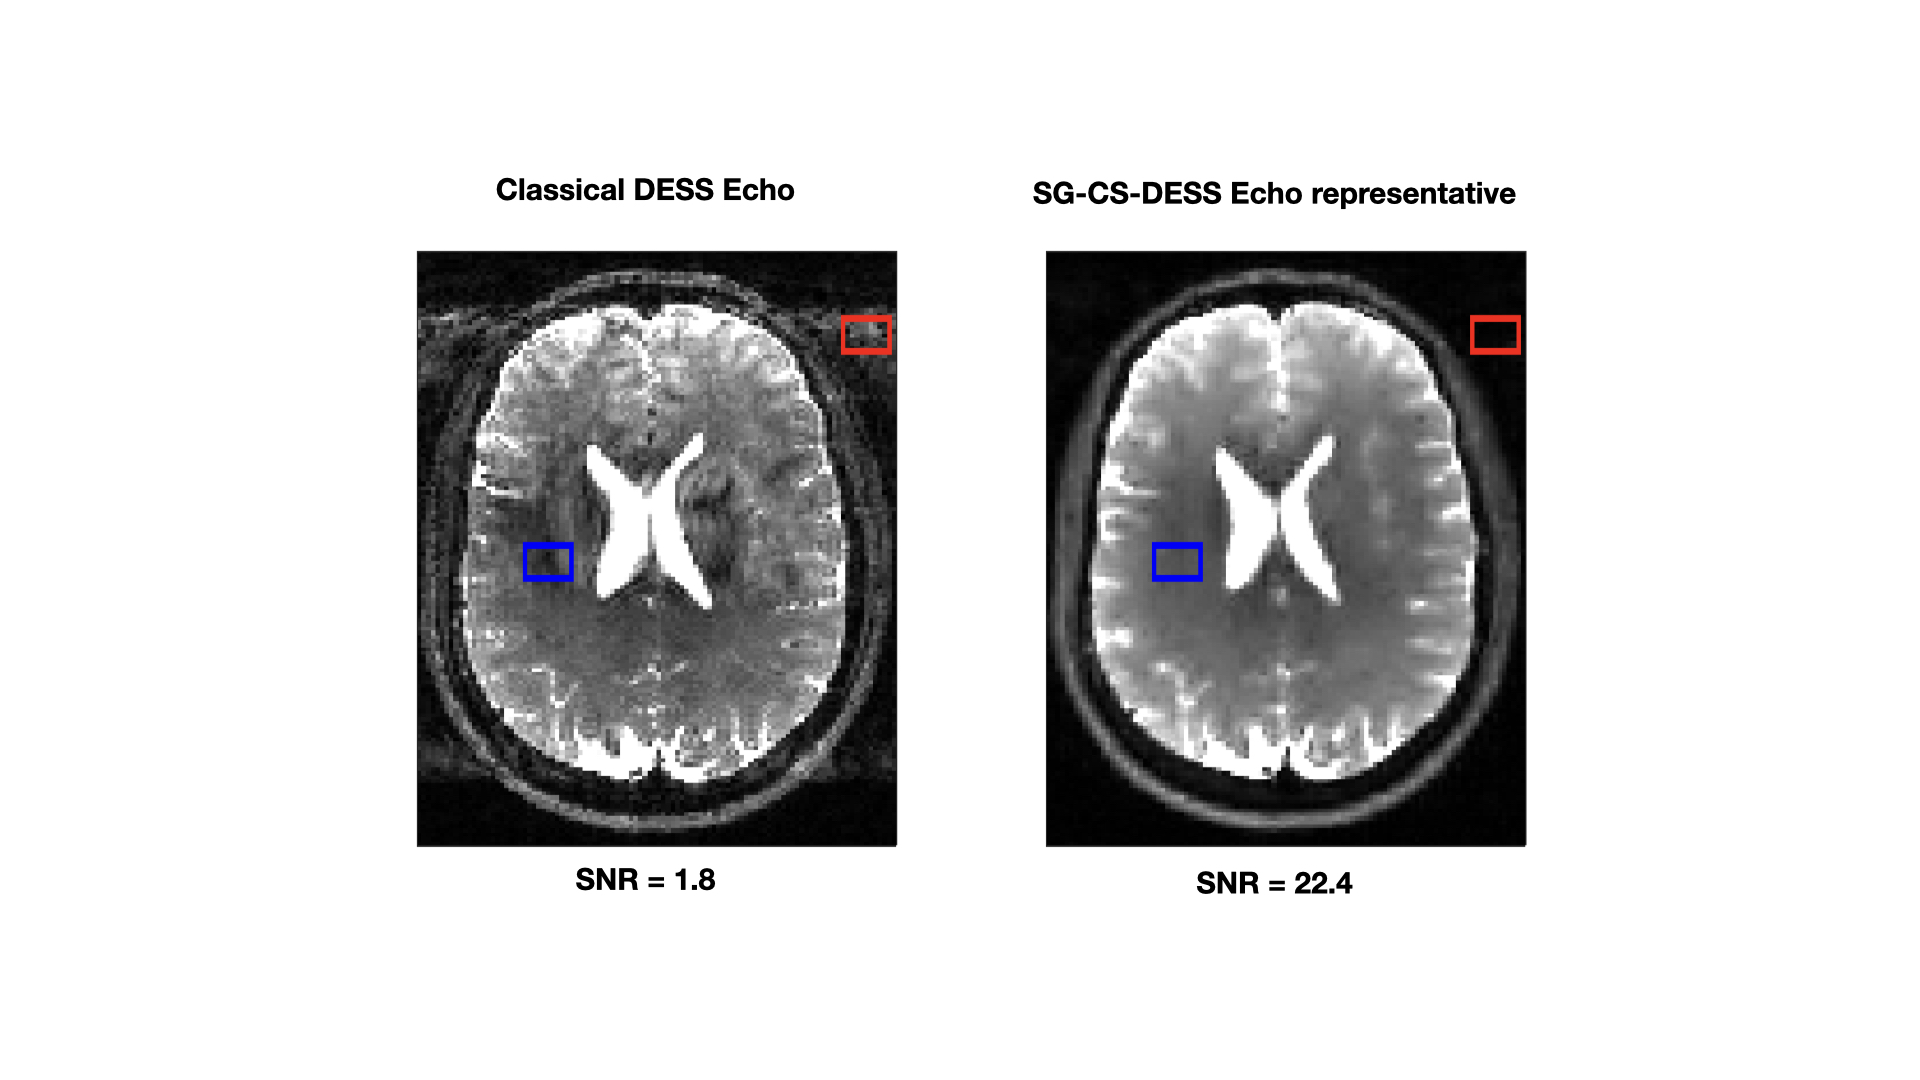
The phase of the SG signal was observed to be highly correlated with the retrieved respiration signal (Fig. 2).The classical DESS sequence produced ghosting artifacts in the 3D phase encoding direction in both the FID and Echo images (Fig 3a. and Fig. 4a). The 5 sets of images reconstructed after respiratory binning were artifact-free and the signal-to-noise ratio (SNR) was largely increased (8.4 for the FID, 17.7 for the Echo) when compared to the classical DESS images (5.3 for the FID, 3 for the Echo) (Fig. 3). The CS acceleration generated images with 1.5 mm isotropic resolution in less than 10 min that showed neither artifacts nor intense blurring that could have arisen from CS regularization. Additionally, the SNR was improved once again (1.8 increased to 22.4 in the Echo) (Fig. 4).
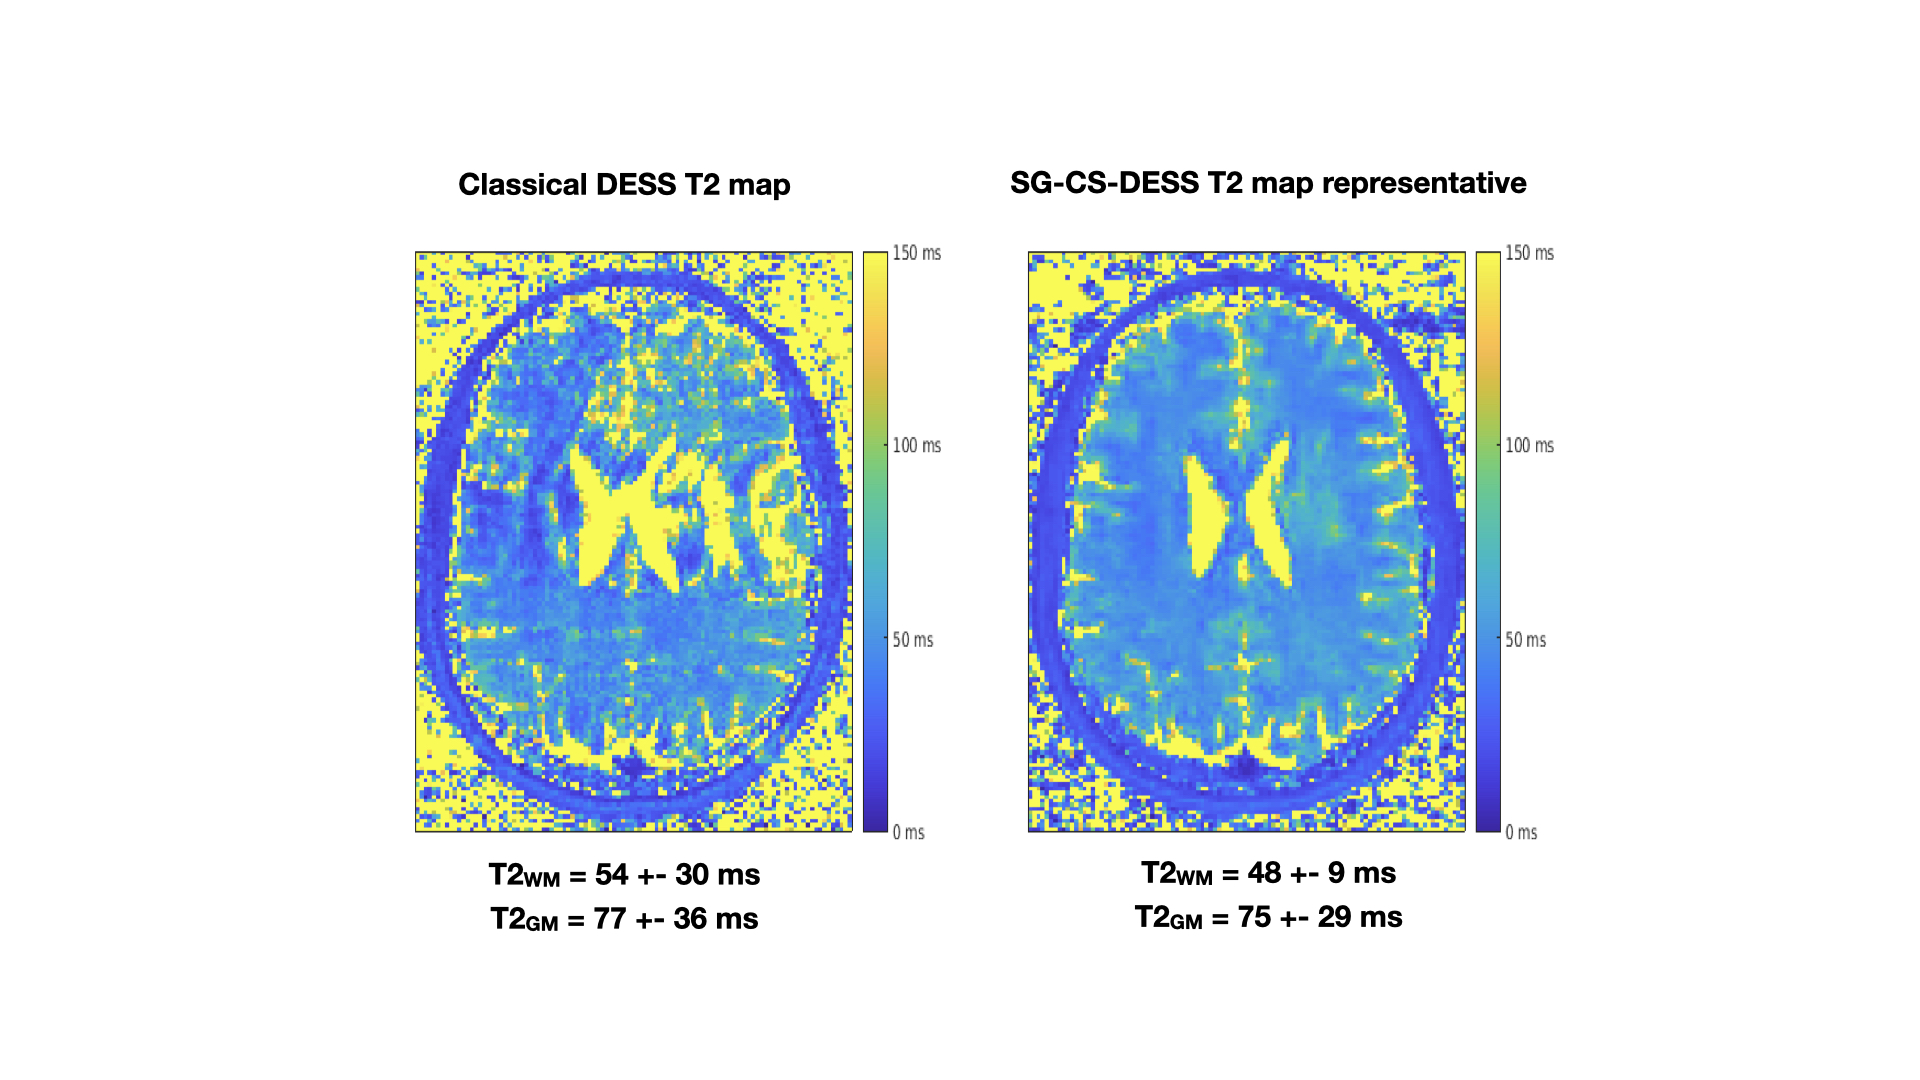
The subsequent 3D T2 maps (Fig. 5) displayed remarkable improvements in quality. The ghosting artifacts could still be seen in the classical DESS T2 maps, whereas the SG-CS-DESS provided more homogenous maps, with a lower T2 standard deviation.
Discussion
This work demonstrated that the SG signal recorded at the brain level is correlated with respiration. By reconstructing images according to the different respiratory phases, ghosting artifacts observed in DESS brain imaging were suppressed. These artifacts might come from respiratory induced B0 variation as already observed in breast imaging2. However, using this method to obtain artifact-free high resolution images and T2 maps results in a time-consuming sequence. It was hence necessary to implement CS acquisition in order to render this duration clinically acceptable. Consequently, a robust method to obtain DESS images and T2 mapping of the brain, without the presence of ghosting artifacts, was developed. Mean T2 values remain similar to those found in literature1 and yet differ from those defined as the gold standard9. Establishing a method that combines the information from all 5 sets of images could be a first step towards increasing signal-to-noise ratio and enhancing T2 estimation precision.Conclusion
In this work, we developed a DESS sequence optimized for brain imaging, using acceleration methods and respiratory artifact correction. This protocol provides a high resolution sequence with short acquisition time (<10 min) and offers 3D T2 mapping that can be highly useful for tissue microstructure investigation.Acknowledgements
This study was achieved within the context of the Laboratory of Excellence TRAIL ANR-10-LABX-57. This work was also supported by the French National Research Agency (ANR-19-CE19-0014).References
1. Gras, V. et al. (2017) ‘Diffusion-weighted DESS protocol optimization for simultaneous mapping of the mean diffusivity, proton density and relaxation times at 3 Tesla’, Magnetic Resonance in Medicine, 78(1), pp. 130–141.
2. Moran, C.J. et al. (2015) ‘Respiration Induced B0 Variation in Double Echo Steady State Imaging (DESS) in the Breast’, 23rd annual Meeting and Exhibition of the ISMRM, pp. 498.
3. BART Toolbox for Computational Magnetic Resonance Imaging, DOI: 10.5281/zenodo.592960
4. Trotier, A. J. et al. (2019) ‘Compressed-Sensing MP2RAGE sequence: Application to the detection of brain metastases in mice at 7T’, Magnetic Resonance in Medicine, 81(1), pp. 551–559.
5. Rosenzweig, S. et al. (2020) ‘Cardiac and Respiratory Self-Gating in Radial MRI using an Adapted Singular Spectrum Analysis (SSA-FARY)’, IEEE Transactions on Medical Imaging, 39(10), pp. 3029–3041.
6. Weigel, M. (2015) ‘Extended phase graphs: Dephasing, RF pulses, and echoes - pure and simple’, Journal of Magnetic Resonance Imaging, 41(2), pp. 266–295.
7. Lamy, J. et al. (2020) ‘Sycomore: an MRI simulation toolkit’, 28th annual Meeting and Exhibition of the ISMRM, pp. 1038.
8. Chung, S. et al. (2010) ‘Rapid B1+ mapping using a preconditioning RF pulse with TurboFLASH readout’, Magnetic Resonance in Medicine, 64(2), pp. 439–446.
9. Sumpf, T. J. et al.(2014) ‘Fast T2 Mapping With Improved Accuracy Using Undersampled Spin-Echo MRI and Model-Based Reconstructions With a Generating Function’, IEEE Transactions on Medical Imaging, 33(12), pp. 2213-2222.
10. https://www.fil.ion.ucl.ac.uk/spm
Figures