0754
Mapping the myelin bilayer with short-T2 MRI: Validation studies1Institute for Biomedical Engineering, ETH Zurich and University of Zurich, Zurich, Switzerland, 2Neuroimmunology and MS Research Section, Neurology Clinic, University of Zurich, University Hospital Zurich, Zurich, Switzerland, 3Department of Neuroradiology, Clinical Neuroscience Center, University Hospital Zurich, University of Zurich, Zurich, Switzerland
Synopsis
Various techniques for myelin mapping based on signal from the lipid-protein bilayer have been proposed, and a common way of validating these techniques is using ex-vivo tissue samples. However, it is still unclear to what extent experimental factors such as tissue storage conditions and processing affect MR signal. In this work, we investigate how long-term deep-frozen storage impacts tissue signal, and evaluate whether signal component mapping is feasible in non-D2O-exchanged samples. We also determine whether animal tissue can act as a substitute for human tissue and investigate signal differences between white and grey matter.
Introduction
Several diseases such as multiple sclerosis critically disrupt the myelin sheath. Hence, noninvasively tracking myelin content by means of imaging poses an urgent medical need. However, despite several attempts at mapping the myelin bilayer directly using short-T2 MRI techniques1-7, it is not yet clear how best to interpret the observed signal in-vivo. Experimental approaches to signal analysis frequently involve the use of animal2,5,6,8 or human9 tissue samples where the background water signal is reduced by D2O exchange5,6,8,9, but this raises additional questions related to the preparation and storage of samples. Common practice is to freeze the tissue, but it is not yet known if this alters the MR signal like with formalin fixation10. Similarly, it is unclear how well signal properties of animal and human tissue match, and whether the employed analysis approaches would work in samples without D2O exchange.In this work, we investigate the signal components observable with state-of-the-art short-T2 imaging techniques in healthy human brain samples to address how different experimental procedures affect tissue signal. Additionally, we investigate signal differences between white matter (WM) and grey matter (GM).
Methods
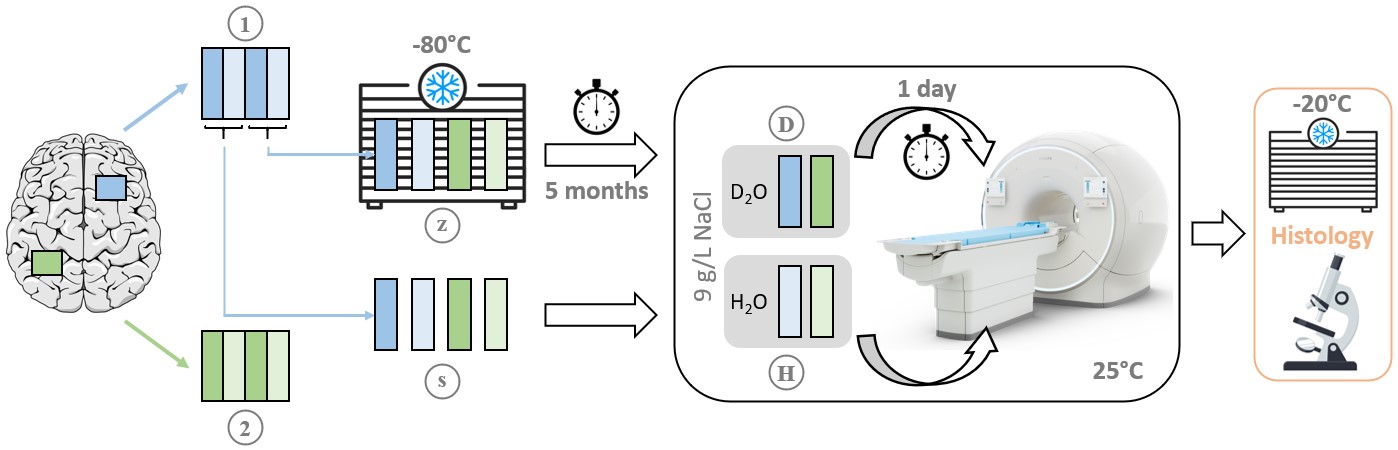
SamplesEight tissue samples of approximately 5x25x18 mm3 from two regions of the cerebrum of a 56-year-old male were studied. The patient died of a cardiovascular event and neuropathological workup did not suggest gross brain pathology. Tissue preparation included D2O exchange and frozen storage for certain samples. A schematic of the full procedure is given in Figure 1.
Imaging
A 3T Philips Achieva system equipped with a high-performance gradient11, fast transmit/receive switches12 and a proton-free loop coil of 40 mm diameter were used. Two imaging protocols were applied, one using single-point imaging (SPI)13 and one using the zero-TE variant HYFI14. The SPI protocol consisted of 14 images at TE between 33-2000 µs with an isotropic resolution of 1.56 mm, which are used for model fitting. The HYFI images have an isotropic resolution of 0.39 mm. Details on the protocols can be found in Ref.9.
Analysis
The signal behaviour of the SPI series was analysed via a fitting procedure based on that used in Ref.6, consisting of the following steps:
- ROIs for WM were drawn in each sample, and in D2O samples also for GM.
- The average signal in each ROI was calculated and used for the fits in steps 3 and 4.
- The 3-component fitting model described in Ref.6 was applied to all D2O samples. This model splits the non-aqueous signal into an ultrashort (U) and a short (S) component of super-Lorentzian lineshape representing the myelin bilayer and residual non-aqueous content, respectively, and the aqueous signal is represented by one component (W) with a T2 of 50 ms and chemical shift (δ) of 4.7 ppm.
- The component parameters of the U- and S-components (T2,min and δ) were fixed at the average values found for WM in step 3, and a second fit was run on all samples to determine the amplitudes of each signal component in the different ROIs.
- The fixed-component fitting procedure from step 4 was applied on a single-voxel basis for all samples, yielding amplitude maps of the signal components.
Interpolation was applied to all images. Amplitude maps for the non-aqueous components in H2O samples were masked based on the sample outline in the W-component map.
Histology
The tissue samples were cryosectioned (20 µm) and underwent myelin staining by immunohistochemistry for myelin oligodendrocyte glycoprotein (MOG, 1:50).
Results
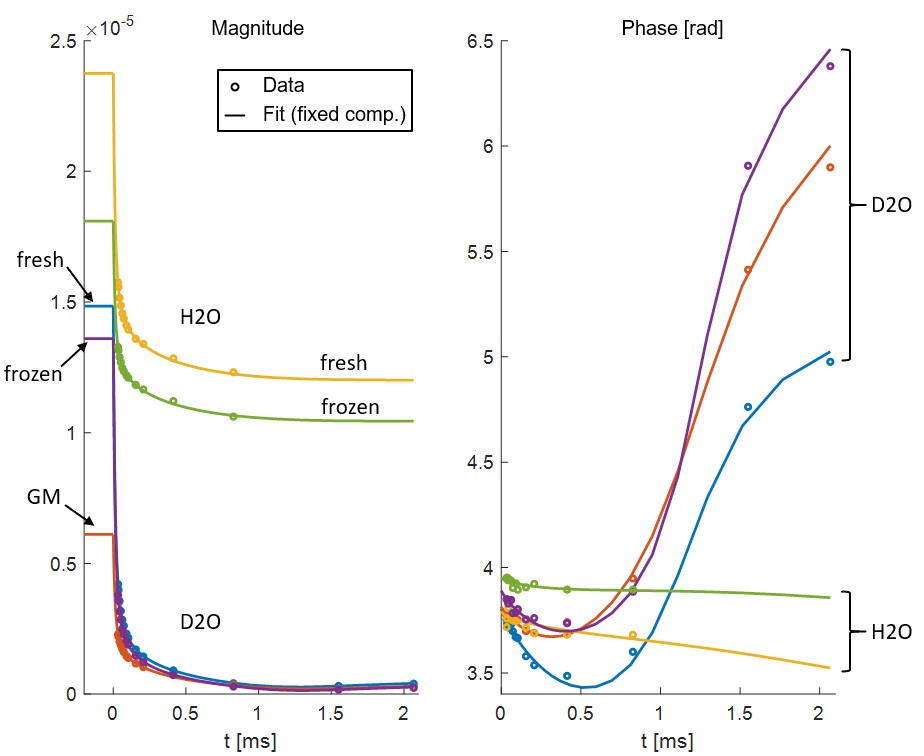
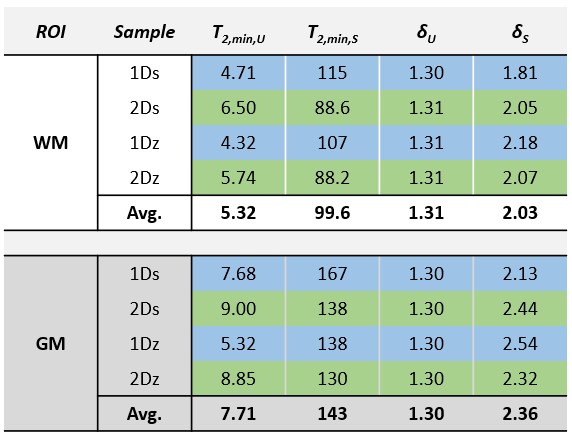
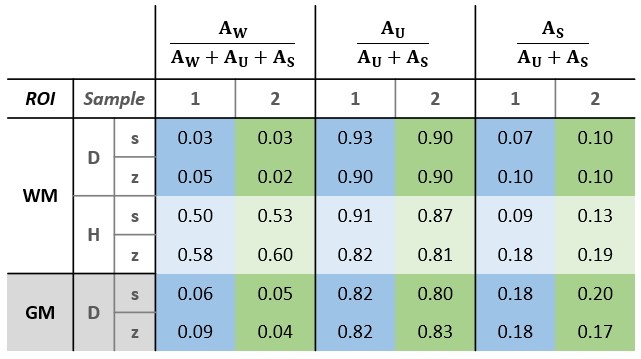
SPI data points and fitted curves (analysis step 4) for several ROIs in tissue block 2 are shown in Figure 2.The fitted values of T2,min and δ from step 3 are shown in Table 1. The amplitudes found in step 4 are given in Table 2.
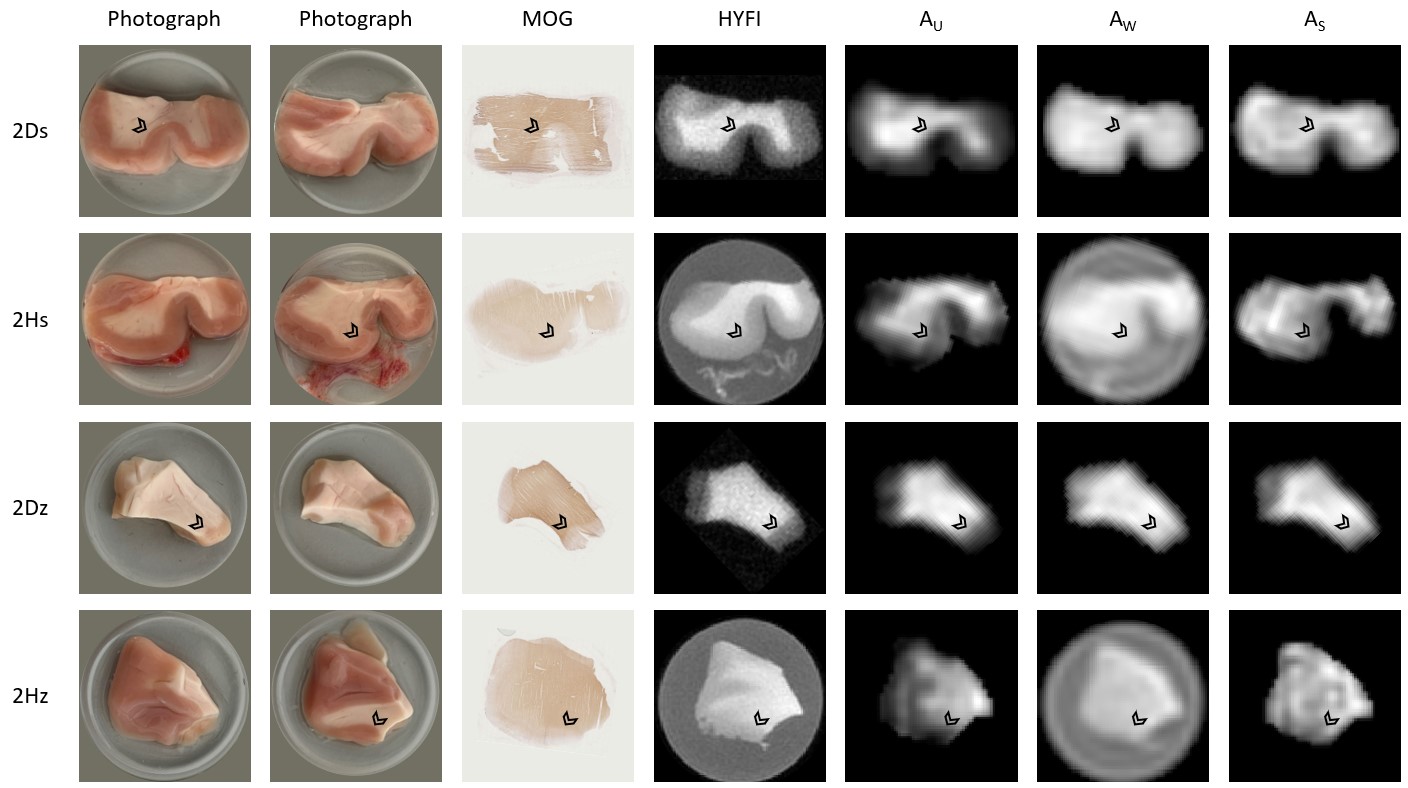
Figure 3 shows photographs (both sides), MOG stains, reference HYFI images and the fitted amplitude maps from step 5 for all samples from tissue block 2.
Discussion and Conclusions
Based on data presented in Table 2 and Figure 2, we conclude that storing samples under frozen conditions appears to affect the T1 of the different signal components, which alters the steady-state signal magnitudes and the amplitude relationship of the U- and S-components. However, the component parameters remain largely unchanged. Thus, frozen samples are at least qualitatively equivalent to fresh samples.From Table 1 we see that GM has different component parameters than WM, which reflects the different composition of the two tissue types. However, as seen in Figure 3, fixing fit components based on WM values produces reasonable amplitude maps also in GM.
The component parameters found in this study for human samples are similar to those found previously in animal brain tissue2,6. Therefore, animal brain tissue can be a useful phantom depending on the particular purpose of the study.
As seen in Figure 3, component mapping works well also in samples without D2O exchange, bringing model-fitting approaches significantly closer to in-vivo applications.
Overall, results obtained for the experimental procedures investigated here can act as a foundation for signal interpretation in in-vivo studies.
Acknowledgements
The authors would like to thank Karl Frontzek from the Institute of Neuropathology, University Hospital Zurich, Switzerland for providing the brain samples.References
1. Nayak KS, Pauly JM, Gold GE, Nishimura DG. Imaging ultra-short T2 species in the brain. In Proceedings of the 8th Annual Meeting of ISMRM, Denver, USA, 2000. p.509.
2. Wilhelm MJ, Ong HH, Wehrli SL et al. Direct magnetic resonance detection of myelin and prospects for quantitative imaging of myelin density. Proc Natl Acad Sci. 2012;109:9605-9610.
3. Du J, Ma G, Li S et al. Ultrashort echo time (UTE) magnetic resonance imaging of the short T2 components in white matter of the brain using a clinical 3T scanner. NeuroImage. 2014;87:32-41.
4. Sheth V, Shao H, Chen J et al. Magnetic resonance imaging of myelin using ultrashort echo time (UTE) pulse sequences: Phantom, specimen, volunteer and multiple sclerosis patient studies. NeuroImage. 2016;136:37-44.
5. Seifert AC, Li C, Wilhelm MJ, Wehrli SL, Wehrli FW. Towards quantification of myelin by solid-state MRI of the lipid matrix protons. NeuroImage. 2017;163:358-367.
6. Weiger M, Froidevaux R, Baadsvik EL, Brunner DO, Rösler MB, Pruessmann KP. Advances in MRI of the myelin bilayer. NeuroImage. 2020;217:116888.
7. Waldman A, Rees J, Brock C, Robson M, Gatehouse P, Bydder G. MRI of the brain with ultra-short echo-time pulse sequences. Neuroradiology. 2003;45:887-892.
8. Fan SJ, Ma Y, Zhu Y et al. Yet more evidence that myelin protons can be directly imaged with UTE sequences on a clinical 3T scanner: Bicomponent T2* analysis of native and deuterated ovine brain specimens. Magn Reson Med. 2018;80:538-547.
9. Baadsvik EL, Weiger M, Froidevaux R, Faigle W, Ineichen BV, Pruessmann KP. Mapping myelin content in ex-vivo MS brain tissue using short-T2 MRI of the lipid-protein bilayer. In Proceedings of the 29th Annual Meeting of the ISMRM, Vancouver, Canada, 2021. p.2827.
10. Seifert AC, Umphlett M, Hefti M, Fowkes M, Xu J. Formalin tissue fixation biases myelin-sensitive MRI. Magn Reson Med. 2019;82:1504-1517.
11. Weiger M, Overweg J, Rösler MB et al. A high-performance gradient insert for rapid and short-T2 imaging at full duty cycle. Magn Reson Med. 2018;79:3256-3266.
12. Brunner DO, Furrer L, Weiger M et al. Symmetrically biased T/R switches for NMR and MRI with microsecond dead time. J Magn Reson. 2016;263:147-155.
13. Balcom BJ, MacGregor RP, Beyea SD, Green DP, Armstrong RL, Bremner TW. Single-point ramped imaging with T1 enhancement (SPRITE). J Magn Reson Ser A. 1996;123:131-134.
14. Froidevaux R, Weiger
M, Rosler MB, Brunner DO, Pruessmann KP. HYFI: Hybrid filling of the dead-time
gap for faster zero echo time imaging. NMR in biomedicine. 2021;34:e4493.
Figures