0753
Voxel-wise compartmental modelling of blood-brain barrier water exchange measurements using FEXI1Centre for Medical Image Computing, Department of Computer Science, University College London, London, United Kingdom, 2Division of Neuroscience and Experimental Psychology, University of Manchester, Manchester, United Kingdom, 3Geoffrey Jefferson Brain Research Centre, University of Manchester, Manchester, United Kingdom, 4NMR Research Unit, Queen Square Multiple Sclerosis Centre, Department of Neuroinflammation, UCL Queen Square Institute of Neurology, University College London, London, United Kingdom, 5Centre for Medical Image Computing, Department of Medical Physics and Biomedical Engineering, University College London, London, United Kingdom, 6Bioxydyn Limited, Manchester, United Kingdom
Synopsis
We propose compartmental modelling of blood-brain barrier (BBB) water exchange measurements using diffusion-filtered exchange imaging (FEXI), with the aim of providing greater biophysical insight into BBB function than is possible using the apparent exchange rate (AXR) approach. As relaxation time differences between blood and extravascular tissue have not yet been accounted for in FEXI-based BBB permeability measurements, we use simulations to quantify potential biases in exchange rates from both the AXR and compartmental approaches. Finally, we evaluate the repeatability of the AXR and compartmental models in a cohort of healthy subjects.
Introduction
Changes in blood-brain barrier (BBB) permeability are associated with many neurological conditions, including neurodegeneration, multiple sclerosis and stroke. Water exchange across the BBB is a promising new biomarker for identifying subtle changes in BBB integrity1.The diffusion-filtered exchange imaging (FEXI) method2,3, originally developed to measure exchange across cell membranes, can be adapted to probe water exchange across the BBB4,5. While initial results show promise, current methods rely on several critical assumptions and simplifications. For example, relaxation time differences between blood and extravascular tissue have to date not been accounted for; although biases from T1 relaxation can be approximated6, T2 effects are harder to compensate for7. Moreover, compartmentalisation is not explicitly modelled, with an apparent exchange rate (AXR) often assumed to approximate the true water exchange rate. The most appropriate acquisition and model fitting scheme therefore remain unclear.The AXR approach is typically used in vivo, both for cellular3,6 and BBB4 water exchange measurements. However, compartmental modelling2,5 may also be suited to probing BBB permeability, offering three key potential benefits over the AXR approach: (i) it can provide an exchange rate estimate that is theoretically more accurate; (ii) it can provide an estimate of equilibrium blood and extravascular signal fractions ($$$f^{eq}_b$$$, $$$f^{eq}_e$$$), which can be used to estimate the intravascular residence time ($$$\tau_b=1/k_b$$$) from the exchange rate ($$$k=k_b/f^{eq}_e$$$); (iii) it may be more easily adapted to disentangle exchange and relaxation time effects8, particularly for T2 differences.
Here we demonstrate the application of a compartmental model for BBB water exchange measurements, allowing greater biophysical insight into BBB function than is possible using the AXR approach. We quantify the repeatability of both AXR and compartmental models in a cohort of healthy subjects.
Methods
Signal modelsAXR was defined using3,6:
$$ADC'\left(t_m\right)=ADC\left[1-\sigma\exp\left(-t_m\cdot AXR\right)\right],$$
where $$$\text{ADC}$$$ and $$$\text{ADC}'(t_m)$$$ are the apparent diffusion coefficients at equilibrium (filter inactive) and at each mixing time with the filter active, and $$$\sigma$$$ is the filter efficiency.
The compartmental model was defined as:
$$S=S_f\left(f_b\left(t_m\right)e^{-bD_b}+f_e\left(t_m\right)e^{-bD_e}\right),$$
where $$$D_b$$$, $$$D_e$$$ are blood and extravascular tissue diffusivities, $$$S_f$$$ the signal at $$$b=0$$$s/mm2, and the blood and extravascular signal fractions $$$f_b(t_m)$$$, $$$f_e(t_m)$$$ are modulated by the exchange rate, $$$k$$$, during the mixing time according to:
$$f_{b,e}\left(t_m\right)=f_{b,e}^{eq}-\left(f_{b,e}^{eq}-f_{b,e}^0\right)e^{-kt_m}.$$
Signal fractions at equilibrium and immediately after the filter block (i.e. $$$t_m=0$$$) are denoted $$$f_{b,e}^{eq}$$$ and $$$f_{b,e}^0$$$ respectively. Relaxation time effects were incorporated into Eqs.2&3 using the matrix representation8.
Simulations
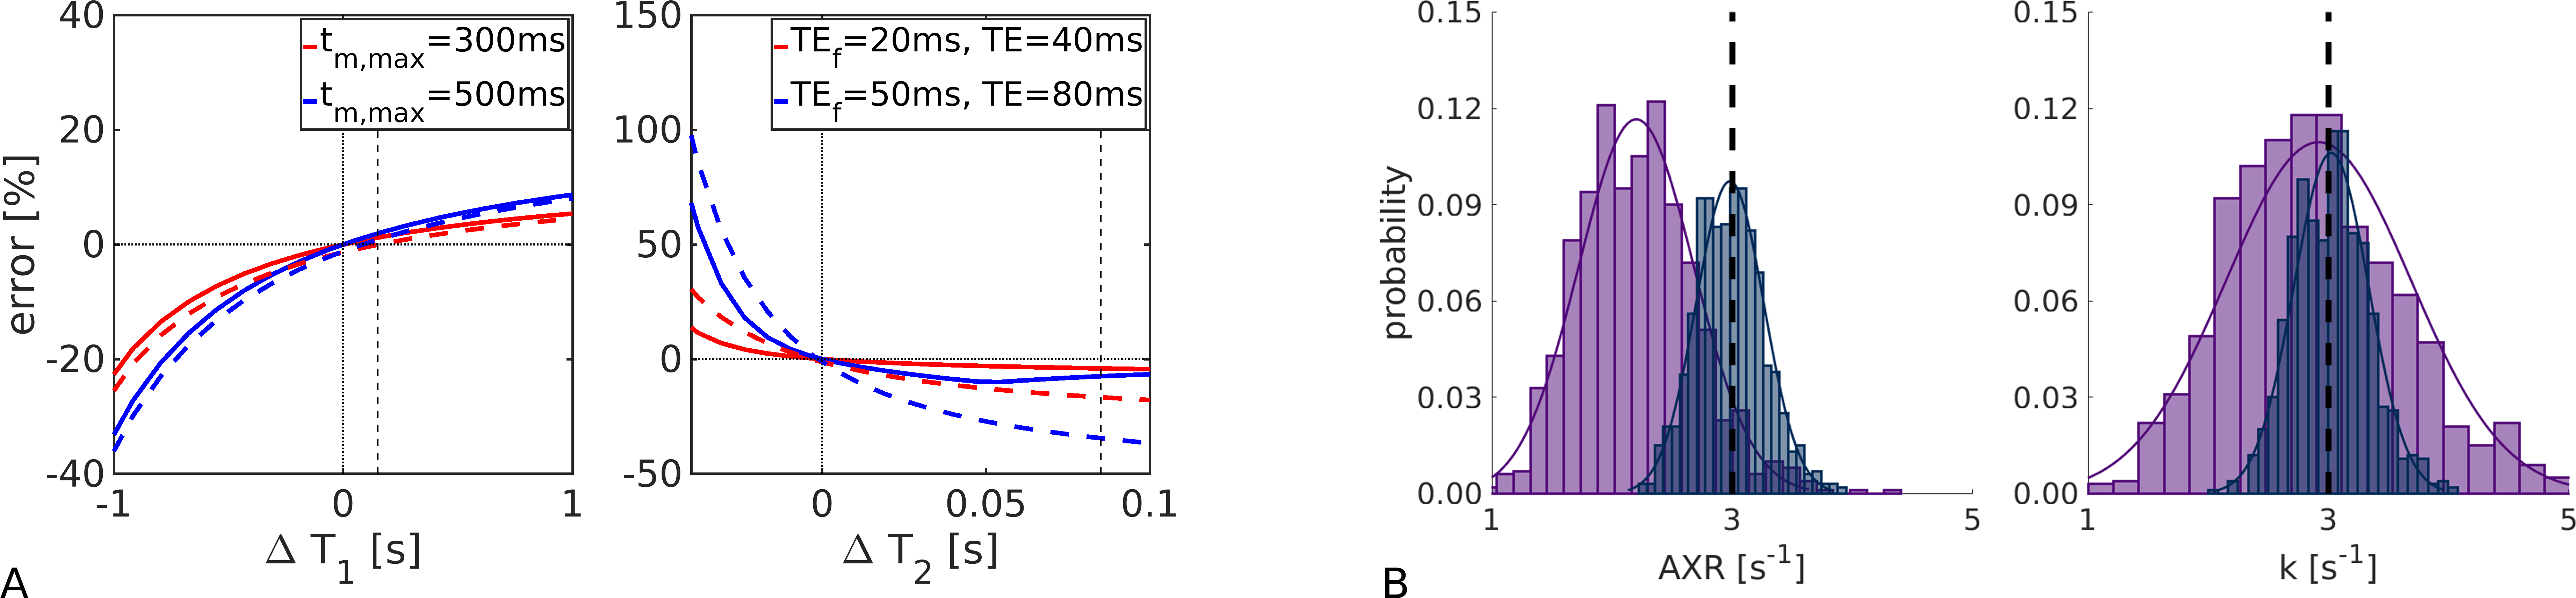
To elucidate potential biases in exchange rates in vivo arising from inter-compartmental T1 and T2 differences, synthetic data were generated using a bi-exponential model with8 and without relaxation effects. The impact of echo and mixing times were investigated using noise-free data. Accuracy and precision were assessed using model fits to 1000 synthetic signals with added zero-mean Gaussian noise ($$$\sigma=0.0013$$$). Fitting was performed in Matlab (R2019b) using a Nelder-Mead algorithm, with $$$f_b^{eq}$$$ assumed known a priori and fixed.
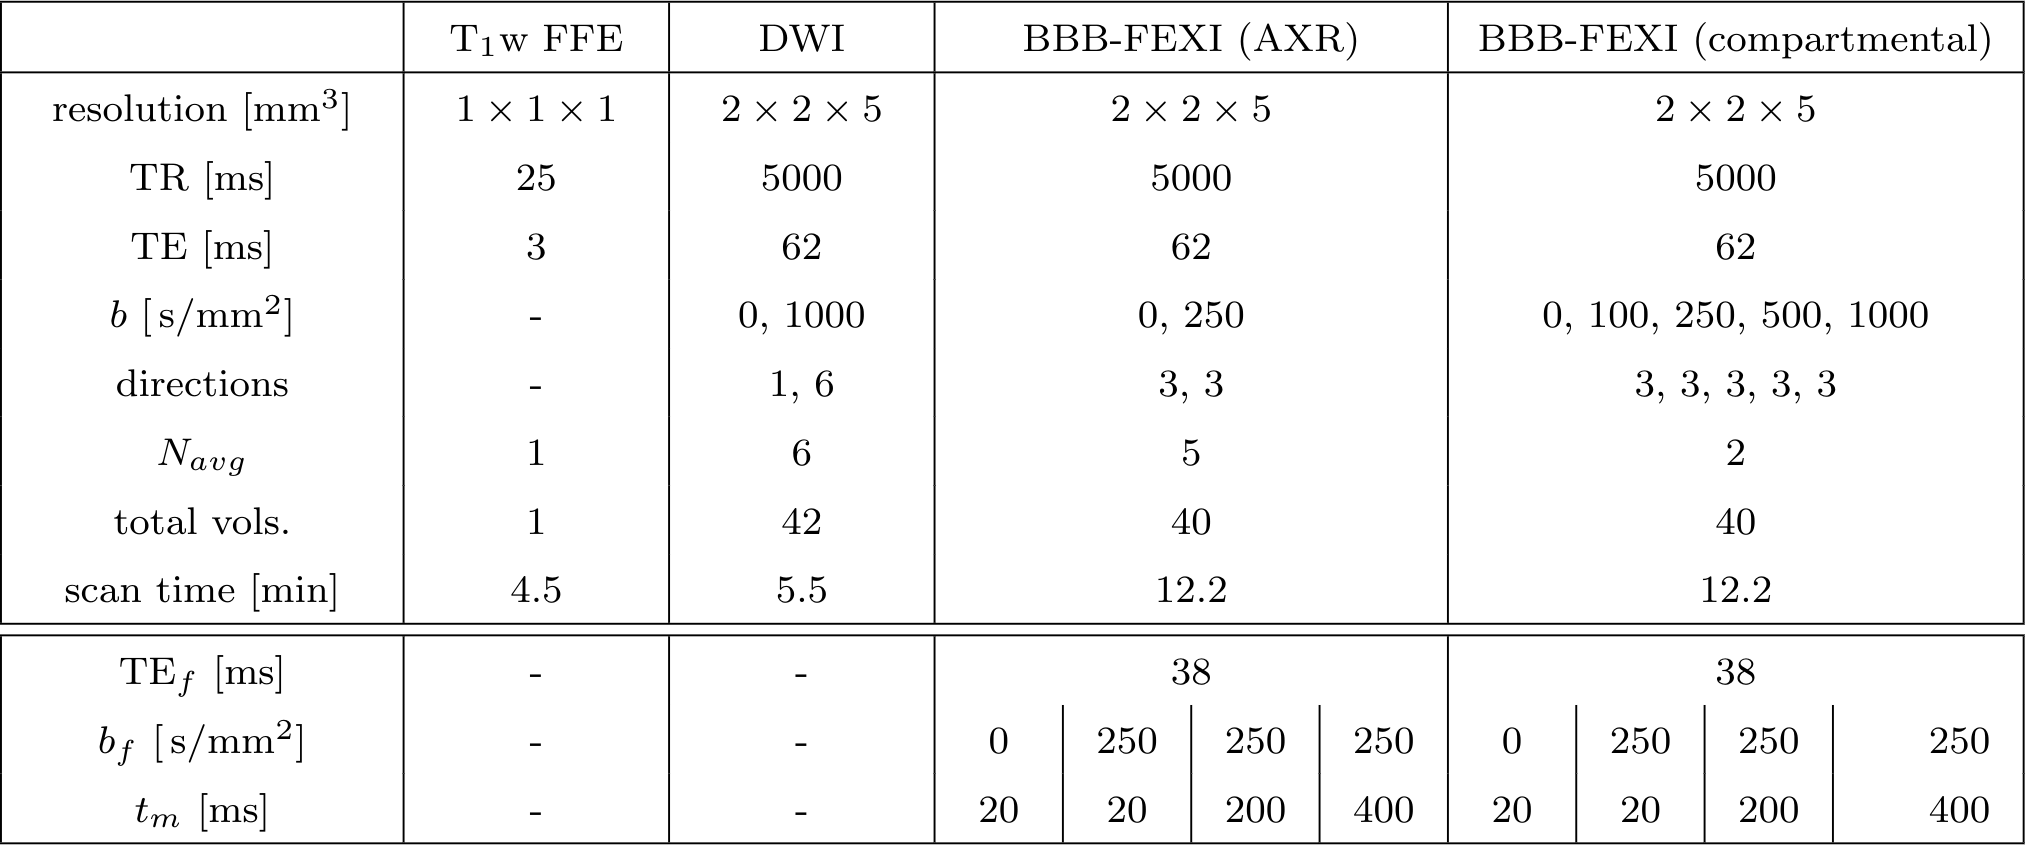
Data acquisition and analysis
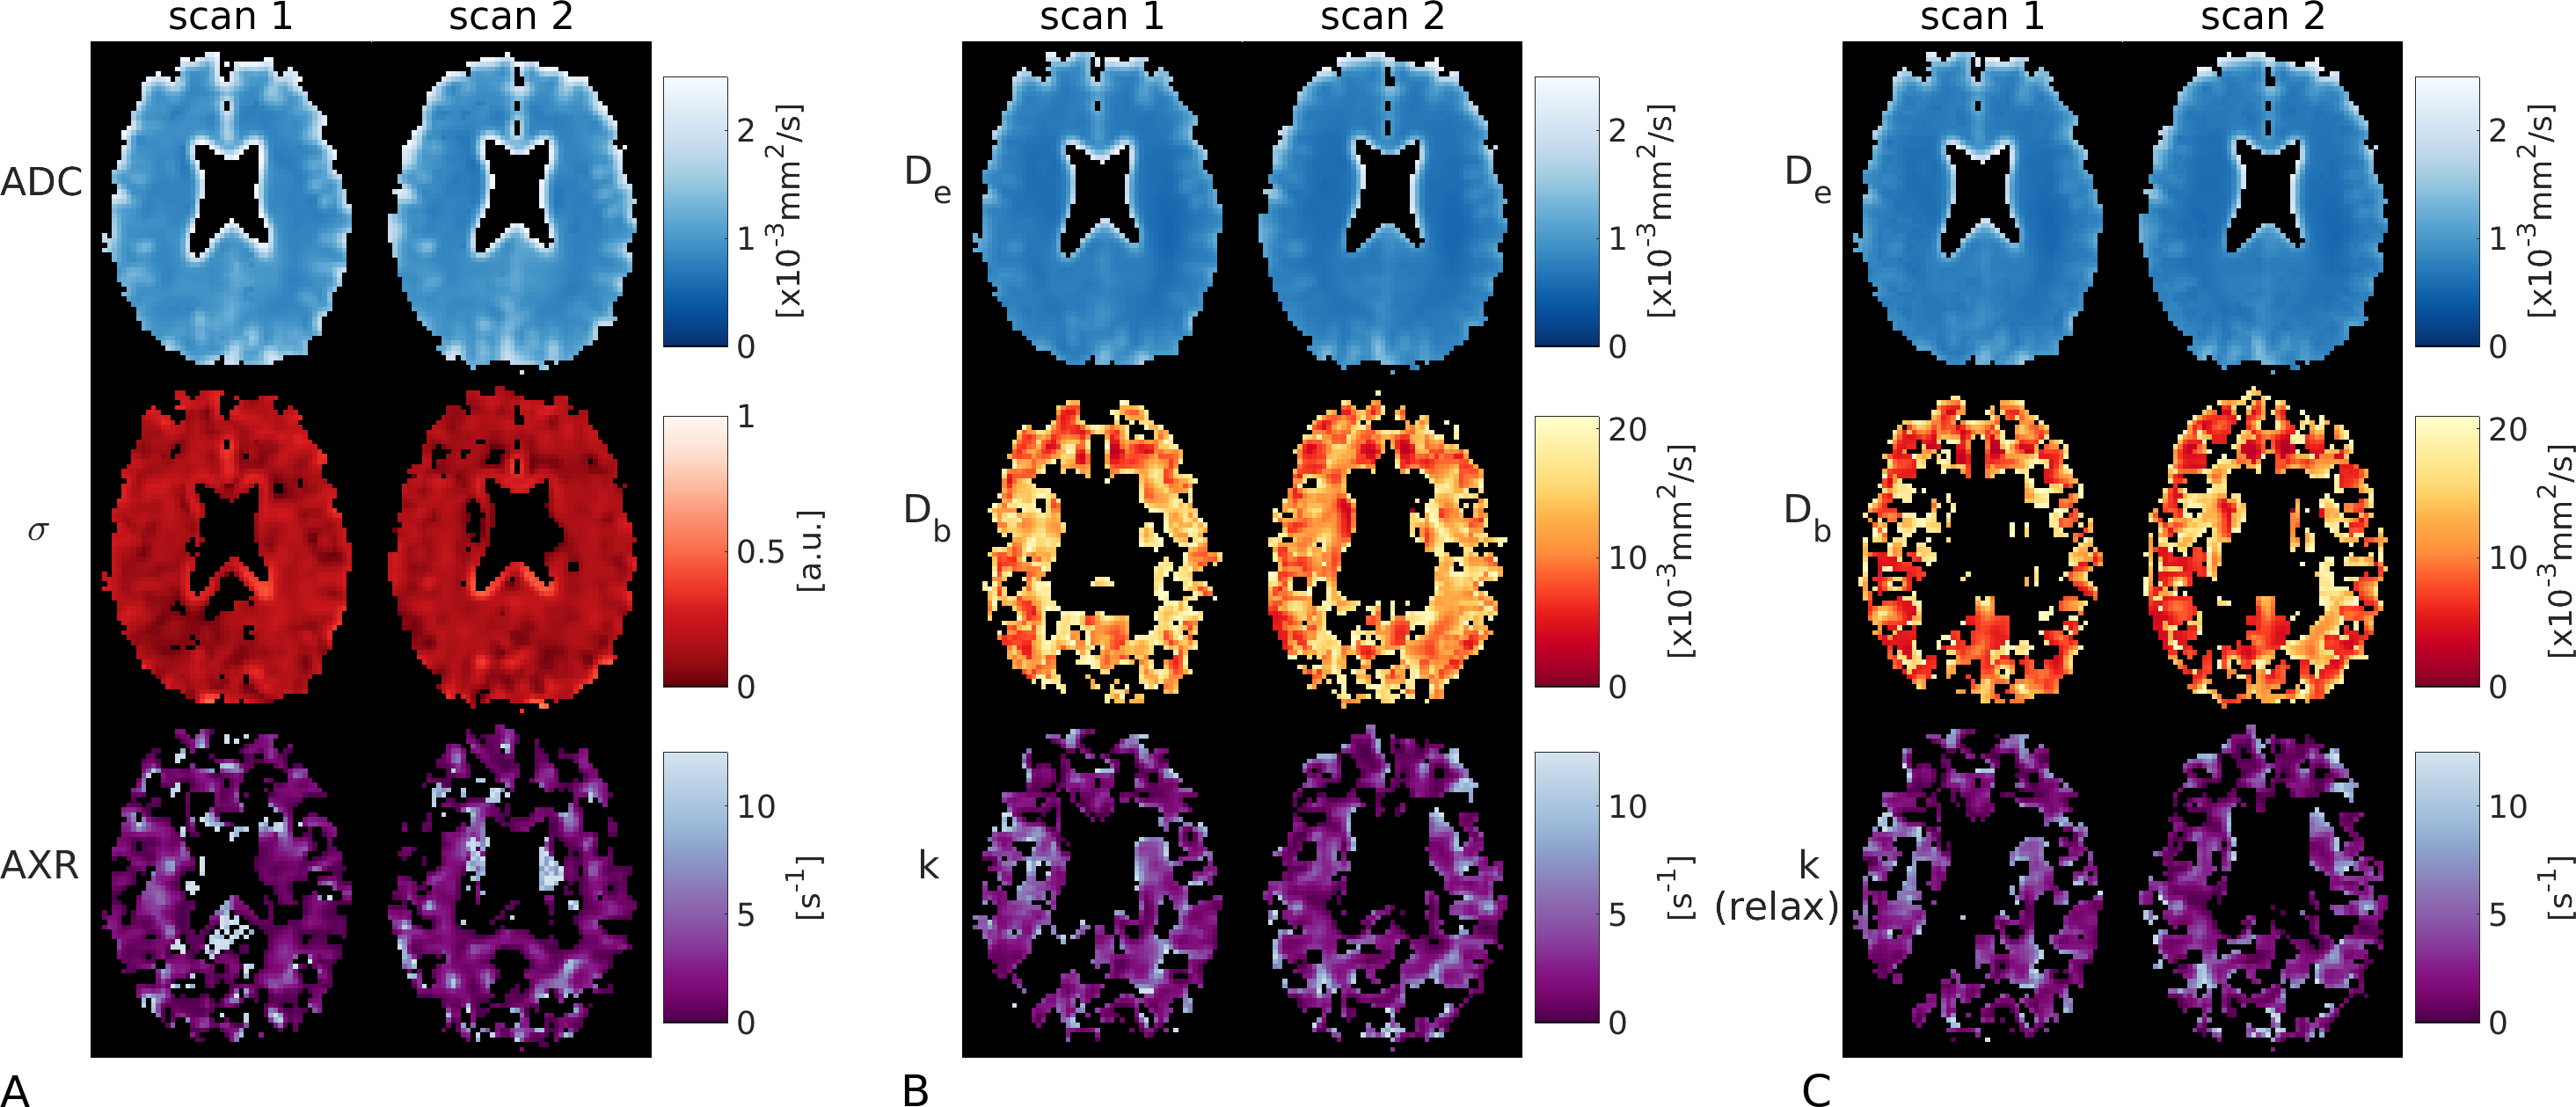
Six healthy subjects (mean age=37years; 3 female) were each scanned twice on a 3T Philips Ingenia CX system. Single slice BBB-FEXI data were acquired using a double diffusion encoding sequence developed in-house, along with whole brain DWI and T1-weighted images (acquisition parameters in Fig.1). The AXR and compartmental models were fitted to the BBB-FEXI data. For the compartmental model, we fixed $$$f_b^{eq}=3$$$% and $$$f_b^{eq}=5$$$% in white matter (WM) and grey matter (GM) voxels respectively. The compartment model was fitted without and with fixed ($$$T_{1,b}=1.65$$$s, $$$T_{1,e}=1.50$$$s9, $$$T_{2,b}=0.180$$$s10 and $$$T_{2,e}=0.095$$$s9) relaxation times to give $$$k$$$ and $$$k_{relax}$$$ respectively. Repeatability was quantified using the coefficient of variation (CoV) in WM/GM ROIs.
Results
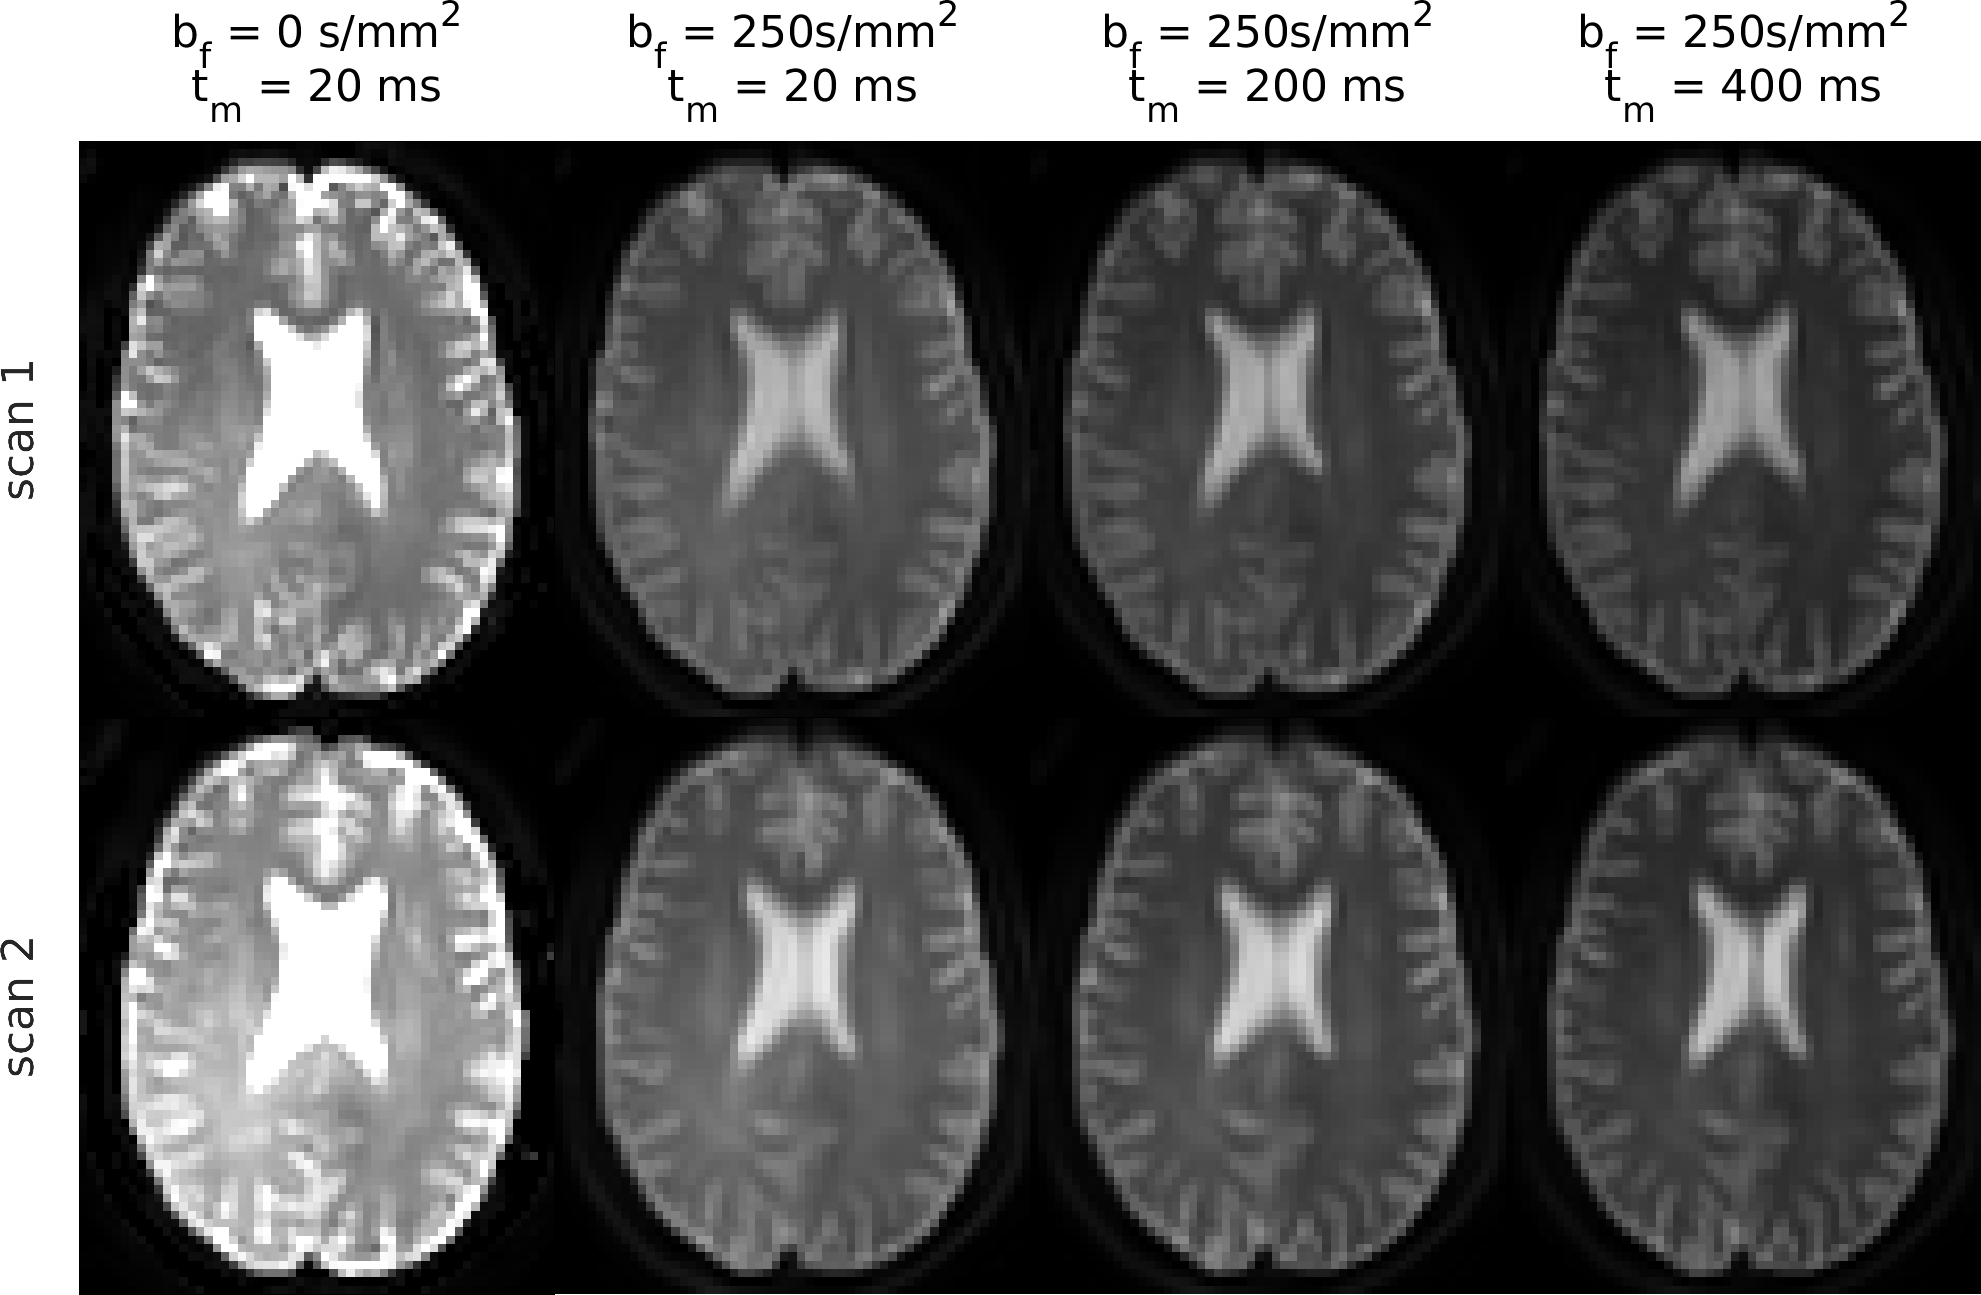
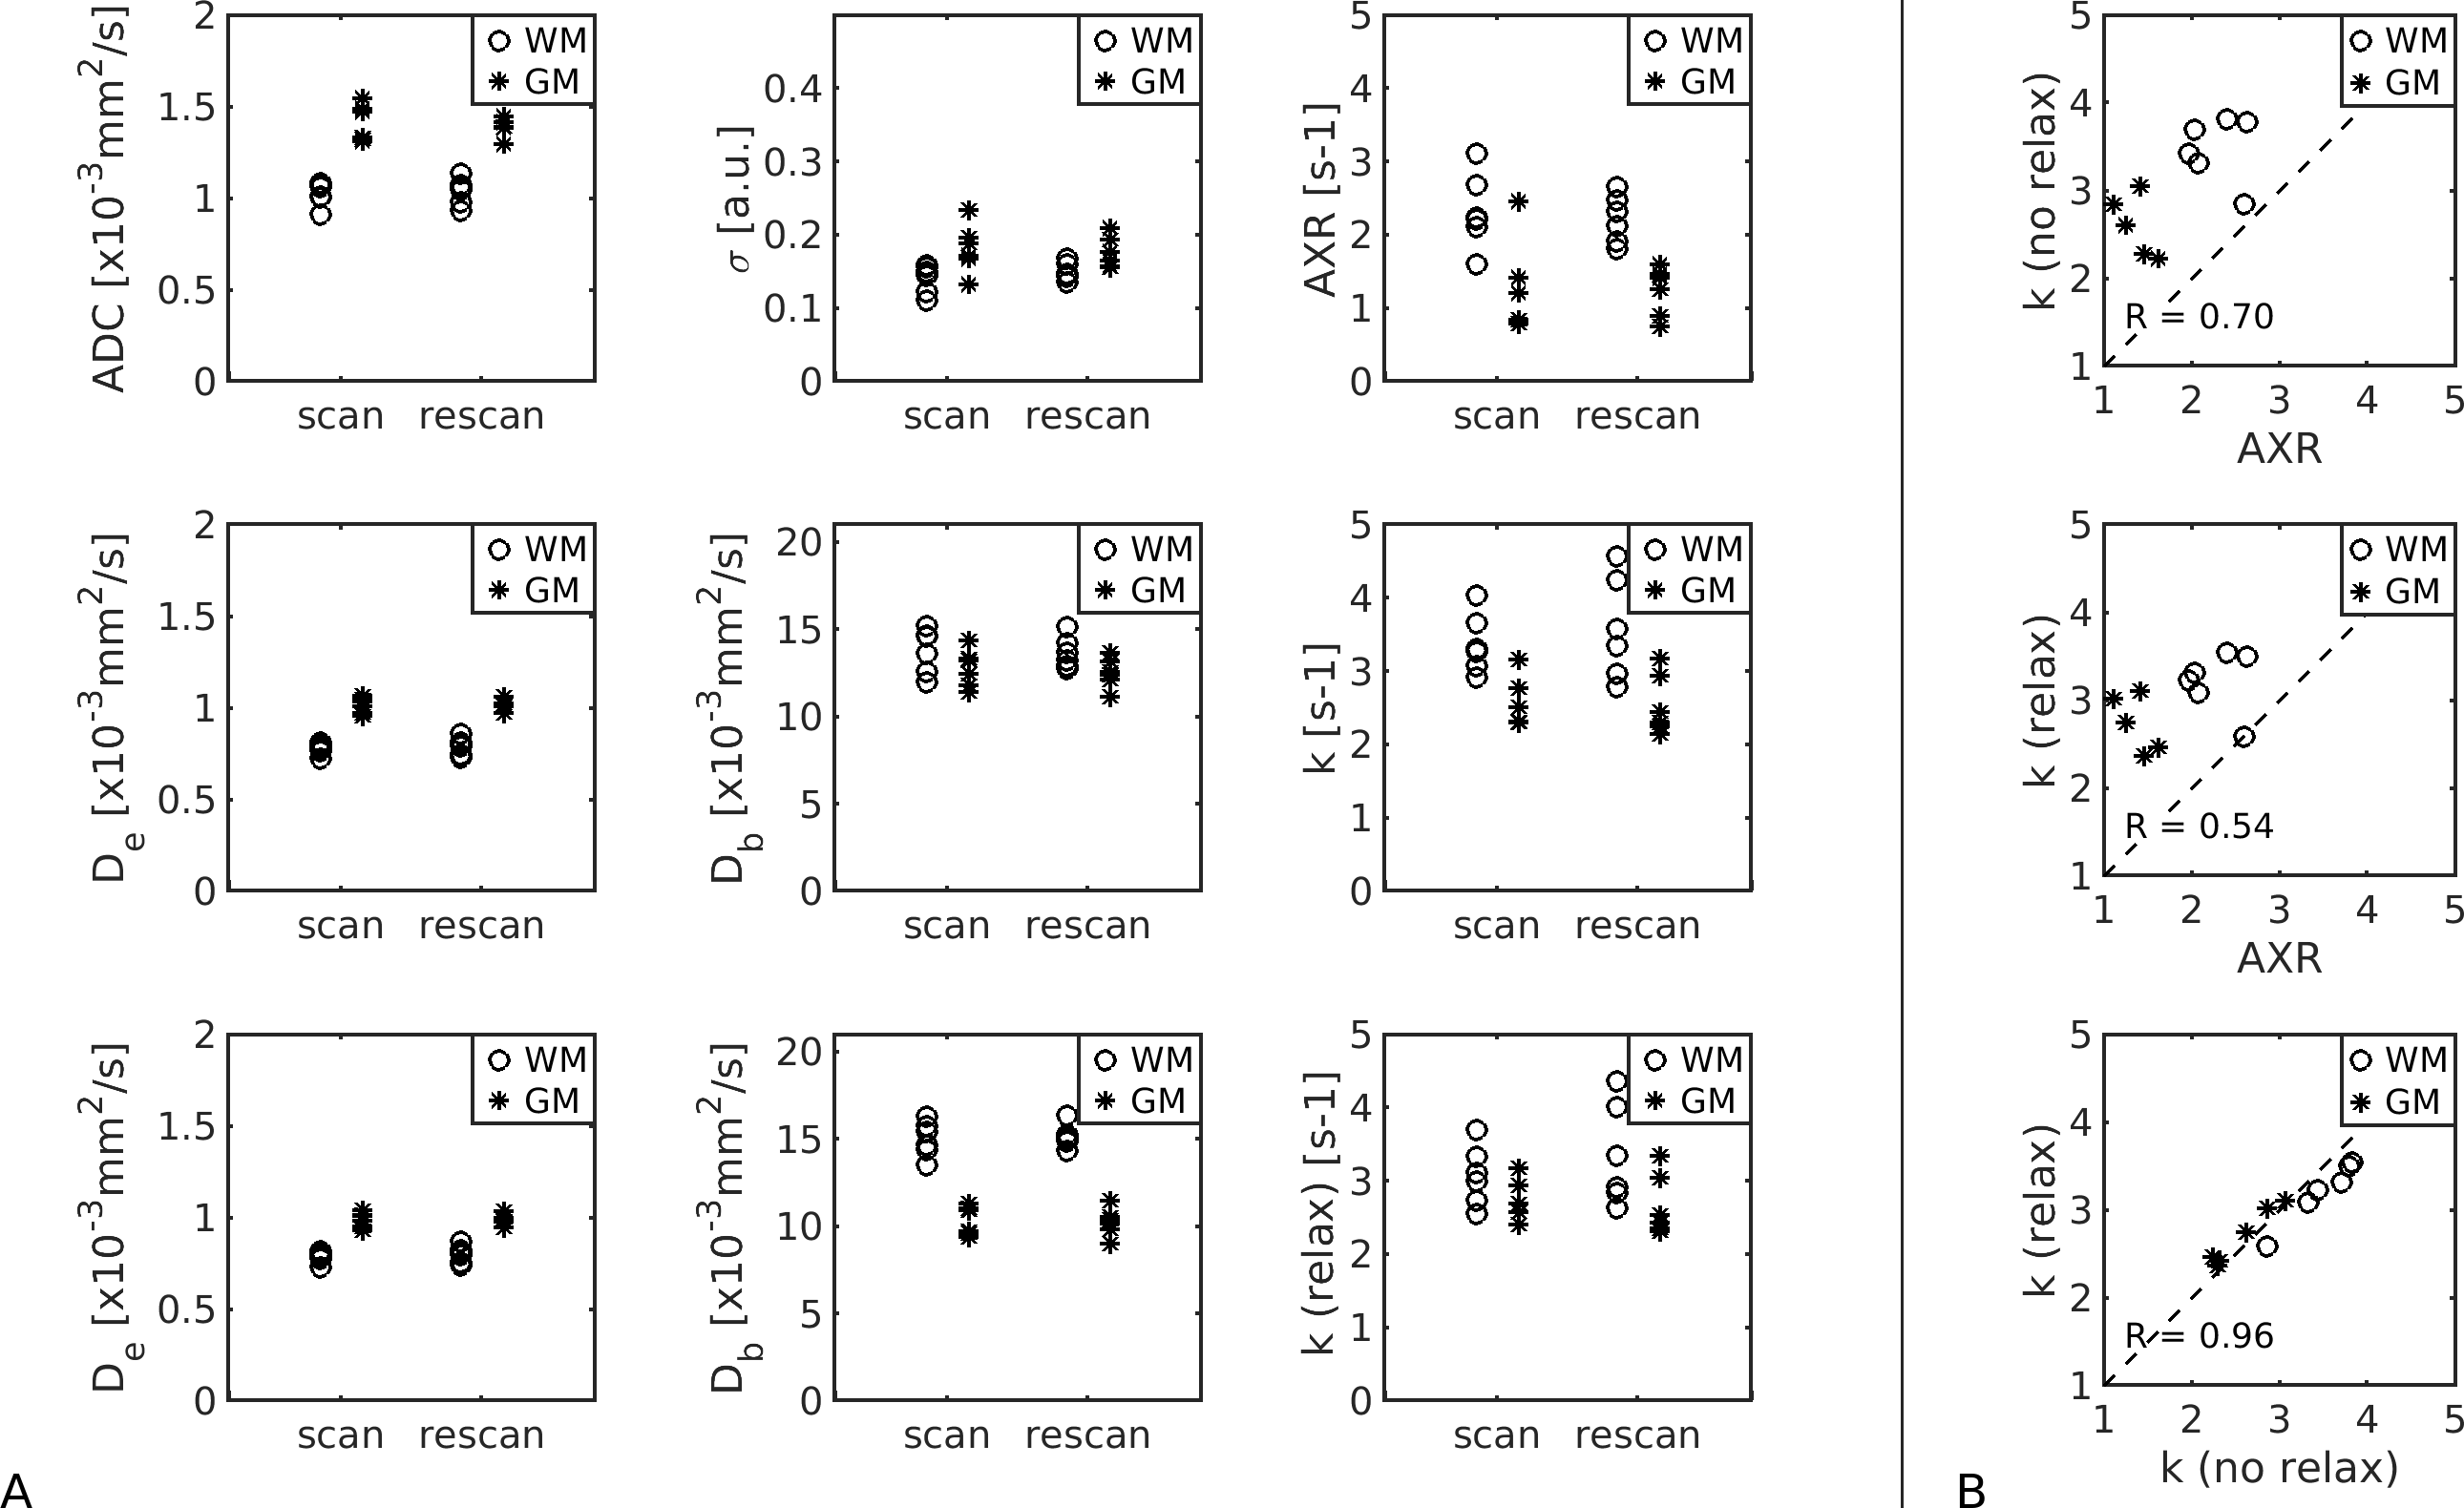
Fig.2 shows simulation results. T2 relaxation caused significant underestimations in exchange rate (AXR/k reduced 26/9%); the effect of T1 was less pronounced (AXR/k reduced <2%). Relaxation time biases increased with longer echo and mixing times (Fig.2a). The AXR model was more susceptible to biases than the compartment model (Figs.2a,b), but precision under noisy conditions was better (Fig.2b).Fig.3 shows representative BBB-FEXI data; derived parameter maps are in Fig.4. Fig.5 shows mean parameter values for all models across WM and GM in each subject. In WM/GM, mean exchange rates across subjects and time points were: $$$\text{AXR}=2.28/1.28$$$s-1, $$$k=3.48/2.56$$$s-1 and $$$k_{relax}=3.22/2.69$$$s-1. Repeatability measures in WM/GM were: AXR $$$\text{CoV}=19/38$$$%, k $$$\text{CoV}=17/15$$$%, and krelax $$$\text{CoV}=18/14$$$%.
Discussion and Conclusions
We demonstrate that compartmental modelling of BBB water exchange rate is feasible in vivo, allowing greater biophysical insight into BBB function. Compartmental modelling also appears to be more repeatable and less susceptible to relaxation time effects than the AXR approach. In vivo AXR estimates were consistently lower than, and poorly correlated with, k (Fig.5), potentially due to biases from relaxation time differences between compartments6-8 (Fig.2). Adjusting for relaxation times in the compartmental model primarily influenced GM Db estimates (Figs.4,5), reducing them in line with expected values11. Extreme values of the fitted exchange rate (i.e. <0.1s-1 or >12.5s-1) were visible in both AXR and k parameter maps (Fig.4); however k appeared more susceptible to fitting errors, likely due to greater complexity in the compartmental model.Exchange rates were lower in GM than WM (Fig.5), consistent with a recently reported trend across multiple studies1; however, this result should be investigated further as the lower blood volume in WM reduces the precision of exchange rate measurements.
Acknowledgements
Thanks to Dr David Higgins and Dr Matthew Clemence of Philips Healthcare MR Clinical Science for their support of this work. Thanks to the UK MS Society and the UCL-UCLH Biomedical Research Centre for ongoing support. This work was supported by EPSRC grant number EP/S031510/1; MB was supported by the UK Multiple Sclerosis Society grant number 77/2017.References
1. Dickie BR, Parker GJ, and Parkes LM. Measuring water exchange across the blood-brain barrier using MRI. Progress in Nuclear Magnetic Resonance Spectroscopy 2020;116:19–39.
2. Aslund I, Nowacka A, Nilsson M, and Topgaard D. Filter-exchange PGSE NMR determination of cell membrane permeability. Journal of Magnetic Resonance 2009;200:291–5.
3. Nilsson M, Latt J, Van Westen D, Brockstedt S, Lasic S, Stahlberg F, and Topgaard D. Noninvasive mapping of water diffusional exchange in the human brain using filter-exchange imaging. Magnetic Resonance in Medicine 2013;69:1573–81.
4. Bai R, Li Z, Sun C, Hsu Y, Liang H, and Basser P. Feasibility of filter-exchange imaging (FEXI) in measuring different exchange processes in human brain. NeuroImage 2020:117039.
5. Powell E, Battiston M, and Parker GJ. Diffusion-filtered exchange measurements of blood-brain barrier permeability to water. In:Proceedings of the 29th ISMRM Annual Meeting.2021.
6. Lasic S, Nilsson M, Latt J, Stahlberg F, and Topgaard D. Apparent exchange rate mapping with diffusion MRI. Magnetic Resonance in Medicine 2011;66:356–65.
7. Eriksson S, Elbing K, Soderman O, Lindkvist-Petersson K, Topgaard D, and Lasic S. NMR quantification of diffusional exchange in cell suspensions with relaxation rate differences between intra and extracellular compartments. PLoS ONE 2017;12:1–18.
8. Van Landeghem M, Haber A, D’espinose De Lacaillerie JB, and Blumich B. Analysis of multisite 2D relaxation exchange NMR. Concepts in Magnetic Resonance Part A 2010;36A:153–69.
9. Bojorquez JZ, Bricq S, Acquitter C, Brunotte F, Walker PM, and Lalande A. What are normal relaxation times of tissues at 3T? Magnetic Resonance Imaging 2017;35:69–80.
10. Chen JJ and Pike GB. Human whole blood T2 relaxometry at 3 tesla. Magnetic Resonance in Medicine 2009;61:249–54.
11. Le Bihan D. What can we see with IVIM MRI? NeuroImage 2018:1–12.
12. Andersson JLR, Skare S, and Ashburner J. How to correct susceptibility distortions in spin-echo echo-planar images: application to diffusion tensor imaging. NeuroImage 2003;20:870–88.
13. Smith SM, Jenkinson M, Woolrich MW, et al. Advances in functional and structural MR image analysis and implementation as FSL. NeuroImage 2004;23:208–19.
14. Zhang Y, Brady M, and Smith S. Segmentation of brain MR images through a hidden Markov random field model and the expectation-maximization algorithm. IEEE Transactions on Medical Imaging 2001;20:45–57.
15. Jenkinson M and Smith S. A global optimisation method for robust affine registration ofbrain images. Medical Image Analysis 2001;5:143–56.
Figures