0750
Phase distribution graphs for differentiable and efficient simulations of arbitrary MRI sequences
Jonathan Endres1, Hoai Nam Dang1, Felix Glang2, Alexander Loktyushin2, Simon Weinmüller1, and Moritz Zaiss1,2
1Department of Neuroradiology, Universitätsklinik Erlangen, Erlangen, Germany, 2Magnetic Resonance Center, Max-Planck-Institute for Biological Cybernetics, Tübingen, Germany
1Department of Neuroradiology, Universitätsklinik Erlangen, Erlangen, Germany, 2Magnetic Resonance Center, Max-Planck-Institute for Biological Cybernetics, Tübingen, Germany
Synopsis
We propose an alternate method for simulating arbitrary MRI sequences, forming complete Bloch simulations. It is closely related to Extended Phase Graphs but imposes no restrictions on the alignment of timing or gradients, extends it to support T2' relaxation and 3D gradient encoding, is fully differentiable, provides additional insight into the composition of the measured signal while outperforming isochromat-based Bloch simulations in execution speed by using an analytical description of the signal instead of relying on a Monte-Carlo simulation.
Motivation
Extended Phase Graphs [1] (EPGs) are a useful tool for fast simulations of MRI sequences. Even though it is often acknowledged that it can be used for arbitrary sequences, this creates a worst-case scenario of having to simulate $$$O(3^n)$$$ states, where $$$n$$$ is the number of pulses in the sequence. While this can be reduced to $$$O(n)$$$ by quantization, these simulations are not suitable for use in whole-sequence optimization where arbitrary gradients and timings are required. Furthermore, EPGs are not capable of describing $$$T_2'$$$ relaxation, because this type of relaxation results in magnetization that can’t be described as the sum of delta distributions after Fourier transformation.Materials and Methods
Phase Distribution Graphs (PDGs) are the result of removing the Fourier transformation from the description of EPGs by replacing states with distributions. These are then expanded to support the description of $$$T_2'$$$ relaxation. With this change, isochromat-based Bloch simulations can be seen as a Monte-Carlo approximation of PDGs and therefore be replaced by them.A single distribution can represent longitudinal (z) or transversal (+) magnetization and contains a complex tensor describing the per-voxel magnetization. Additionally, the amount of intra-voxel dephasing is stored as a four-dimensional vector. It describes the spatial frequency of the magnetization, extended by time to describe location-independent dephasing e.g., $$$T_2'$$$ relaxation. This time component is not monotonic because it can be inverted by refocusing pulses.
Figure 1 shows an exemplary graph of a Turbo Spin Echo [2] (TSE) sequence. PDG provides insight in the magnetization like the k-space trajectories and the $$$T_2'$$$ dephasing of different parts of the magnetization, which an isochromat-based Bloch simulation cannot.
A major challenge of simulating arbitrary sequences is the reduction of the number of distributions needed. While simulating $$$3^n$$$ distributions is impractical even for a low number of pulses $$$n$$$, this count can be reduced by merging distributions with near identical dephasing and omitting distributions with little signal. Because MRI sequences try to achieve a high signal, most of the signal is produced by a small, non-dephased subset of all possible distributions.
To implement these optimizations, the simulation is split into two parts. First, a pre-pass runs a PDG simulation on a single voxel, which allows to use a high number of distributions. It omits distributions with very little magnetization and merges ones with identical dephasing properties. Additionally, it simulates an estimate for the signal of every distribution, which is used to calculate the impact of completely removing a distribution on the overall signal. The pre-pass then returns a graph like the one shown in figure 1, augmented with the information about signal and importance of every distribution. The second part of the simulation, the main-pass, then runs a simulation based on this graph while using thresholds to determine which distributions to measure and which to omit completely.
Results
Figure 2 shows the simulation of a TSE sequence with a 90° excitation 120° refocusing, resulting in a resolution of 64x64 without acceleration. It was simulated using the PDG implementation that is part of the MRzero [3] pipeline and is compared to an isochromat-based Bloch simulation, using brain data acquired from the BrainWeb [4] database. The difference of the magnitude of the two resulting reconstructions is 0.00012 ± 0.00025 and therefore not significant. Simulating on a Nvidia RTX 3090 with an internal resolution of 128 x 128 x 1, the isochromat-based Bloch simulation with 100 isochromats per voxel took (10.83 ± 0.03) s, the PDG simulation took (1.909 ± 0.0005) s. When reusing a precomputed graph between similar sequences, simulation time is reduced to (0.7698 ± 0.0014) s.As the simulation is used as part of the MRzero framework, it must be able to provide derivatives of the signal with respect to all sequence parameters. This is realized with backpropagation by using PyTorch [5]. Figure 3 shows the exemplary minimization of $$$L_2$$$ and timing of a TSE sequence, demonstrating the differentiability of the simulation in time.
As mentioned before, PDG provides tools that allow better insight into the constitution of the measured signal. This can be done by selecting distributions by any classification, as shown in figure 4. For example, when only measuring distributions that had a spin echo before the previous pulse and where then refocused, one gets the 1st order echo (fig. 4, plot 3). When measuring only previously fully relaxed and then excited magnetization, the FID path can be reconstructed (fig. 4, plot 6).
Conclusion
We introduced Phase Distribution Graphs as a new type of Bloch simulation, used to replace and extend isochromat-based Bloch simulations. Our PDG approach shifts the paradigm that Fourier domain or EPG-like simulations “explode” when leaving coherent sequences, as shown by the optimization of the timing of a completely incoherent sequence (fig. 3). Because it is fully differentiable and does not suffer from the noise introduced by an isochromat-based Bloch simulation, which is random in nature, it is ideal for end-to-end MR sequence optimization.Acknowledgements
No acknowledgement found.References
- Weigel, Extended phase graphs: dephasing, RF pulses, and echoes - pure and simple. J Magn Reson Imaging. 2015 Feb; 41(2):266-95TSE
- Kiefer, Turbo Spin-Echo Imaging. In: Echo-Planar Imaging. Springer, Berlin, Heidelberg. 1998
- Loktyushin, Herz, Dang, MRzero - Automated discovery of MRI sequences using supervised learning. Magn Reson Med. 2021; 86: 709– 724
- http://www.bic.mni.mcgill.ca/brainweb/
- Paszke et al, PyTorch: An Imperative Style, High-Performance Deep Learning Library, In: Advances in Neural Information Processing Systems 32, https://github.com/pytorch/pytorch
Figures
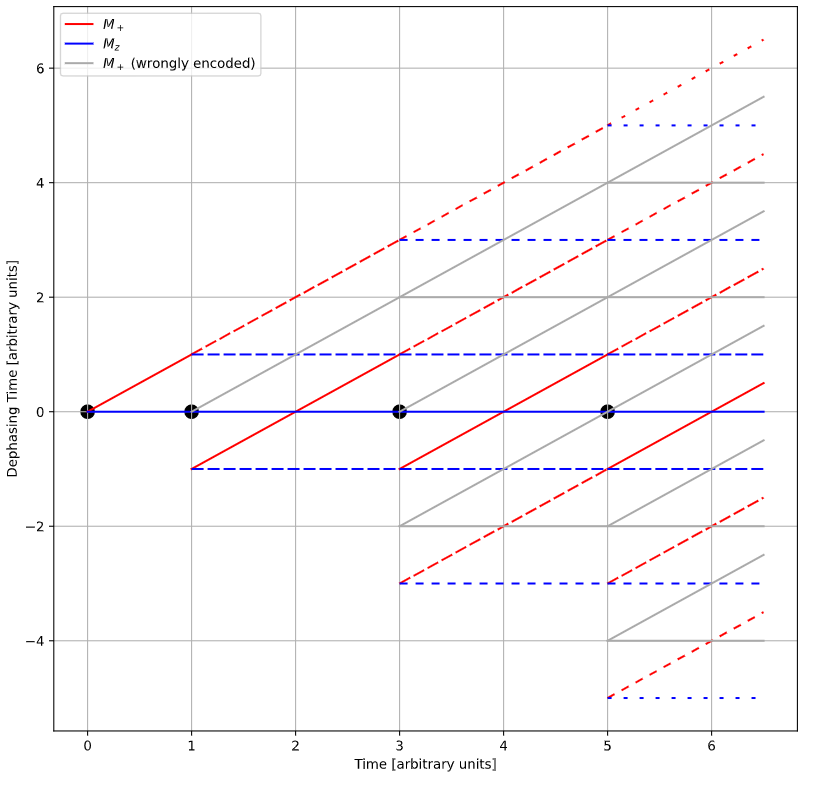
Phase
Distribution Graph of a TSE sequence. The leftmost black dot symbolizes the
location of the excitation pulse, the other dots refocusing pulses. Red lines
are distributions of transversal magnetization, blue lines are longitudinal
magnetization. Plotted along the y-axis is the dephasing time, which is
proportional to the width of the T2' induced spin distribution, i.e., red lines crossing
zero represent parts of the magnetization experiencing a spin echo. Grey lines symbolize magnetization excited by refocusing pulses,
especially prevalent if using low flip angles.
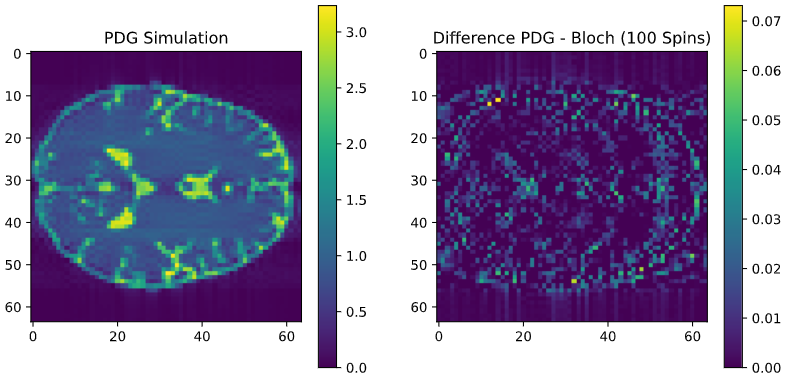
Comparison
of a PDG simulation with the isochromat-based Bloch simulation of a TSE sequence with 120°
refocusing pulses.
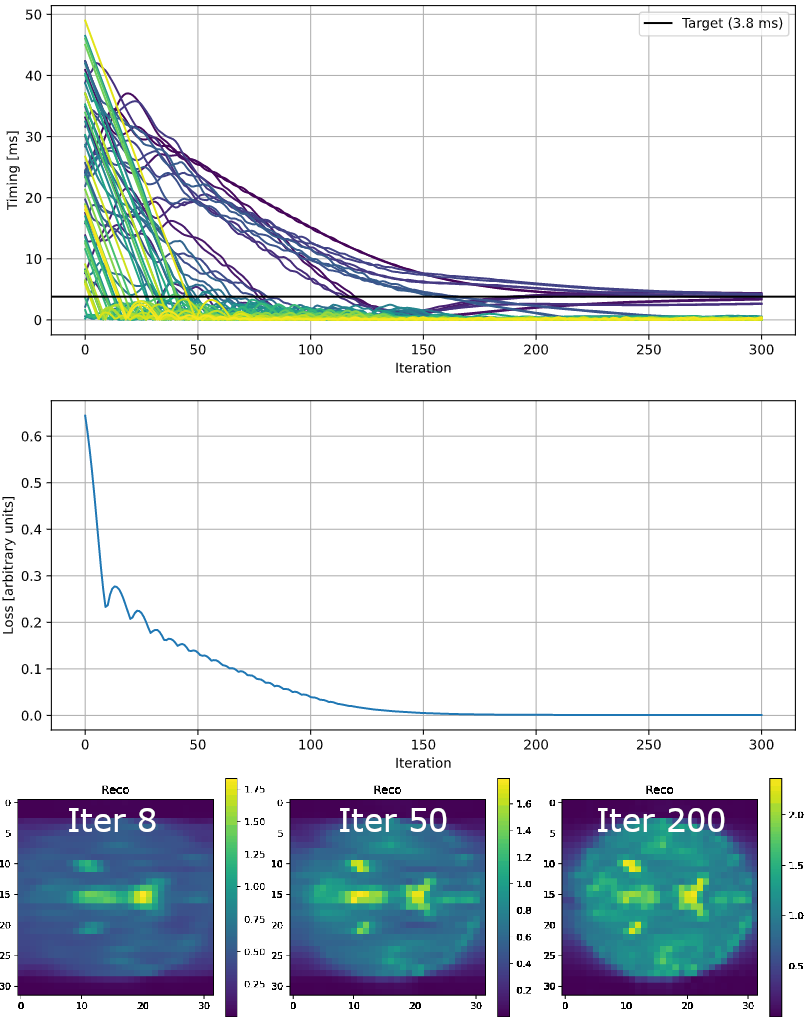
Optimization
of the delays before and after every pulse in a TSE sequence. The loss is
calculated from the sum of all timings and the L2 norm of the difference to a target sequence
that uses for all delays. The optimization starts with
random delays of [0, 50] ms and results in delays of 0.9 ± 1.5 ms. Optimizing
all 65 delays in a 32x32 TSE for 100 iterations takes 28.9 s on a NVIDIA RTX
3090. An animated version is available at: https://www.cest-sources.org/MRzero/Endres/optim_process_TSE_timing.gif
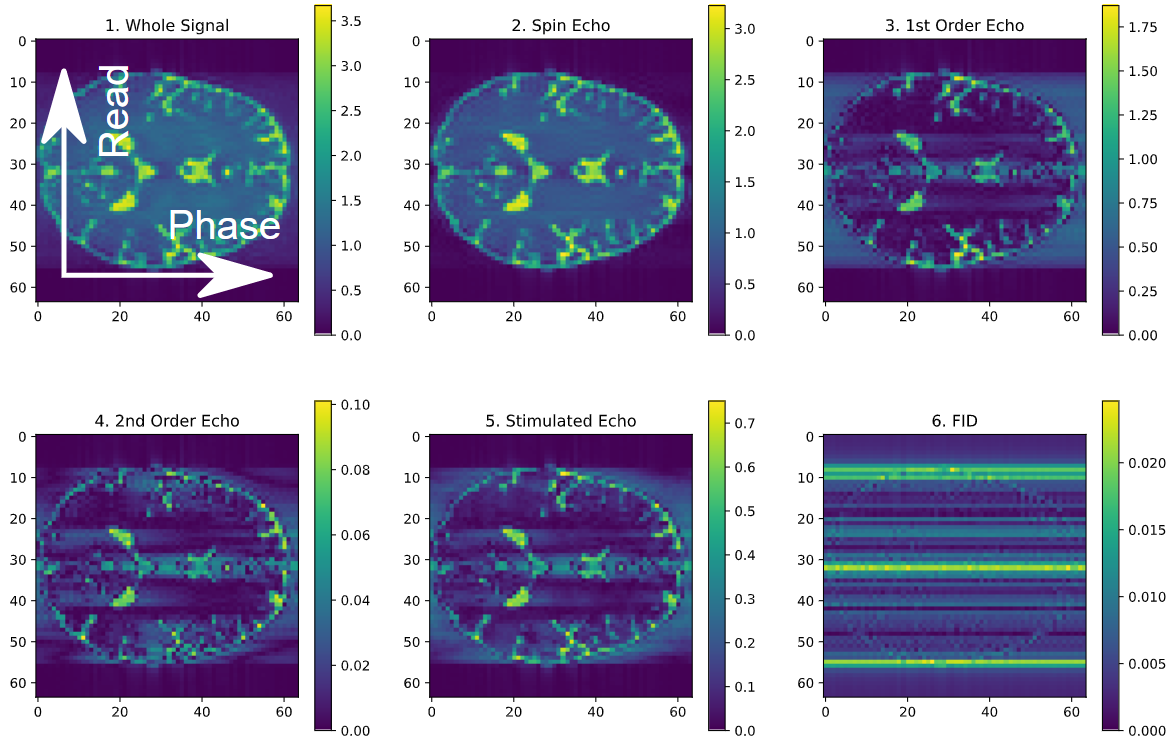
Using
PDG to split the signal into its parts by classifying distributions and
selecting only certain types. Shown is a 64x64 TSE sequence with noticeable T2 blurring in phase encoding direction,
reconstructed with an inverse Fourier transformation.
DOI: https://doi.org/10.58530/2022/0750