0743
A biphasic pattern of cerebral blood flow increases during infancy revealed with 3D multi-shot, stack-of-spirals pCASL and phase-contrast MRI
Minhui Ouyang1,2, John Detre3, Jessica L Hyland1, Kay Laura Sindabizera1, Yun Peng4, J. Christopher Edgar1,2, and Hao Huang1,2
1Department of Radiology, Children's Hospital of Philadelphia, Philadelphia, PA, United States, 2Department of Radiology, Perelman School of Medicine, University of Pennsylvania, Philadelphia, PA, United States, 3Department of Neurology, Perelman School of Medicine, University of Pennsylvania, Philadelphia, PA, United States, 4Department of Radiology, Beijing Children’s Hospital, Capital Medical University, Beijing, China
1Department of Radiology, Children's Hospital of Philadelphia, Philadelphia, PA, United States, 2Department of Radiology, Perelman School of Medicine, University of Pennsylvania, Philadelphia, PA, United States, 3Department of Neurology, Perelman School of Medicine, University of Pennsylvania, Philadelphia, PA, United States, 4Department of Radiology, Beijing Children’s Hospital, Capital Medical University, Beijing, China
Synopsis
Infancy is one of the most prominent times of daily energy expenditure across the lifespan. Here, using cutting-edge pCASL with high-resolution at isotropic 2.5mm and phase-contrast MRI, we delineated the developmental trajectory of the infant’s global and regional cerebral blood flow (rCBF) supporting the metabolic needs for brain development in 0-28months. Significant age-related CBF increases during infancy were better modeled with biphasic linear models, with break-point ages observed earlier in sensorimotor and auditory cortices and later in association cortices. The established population-averaged rCBF maps across infancy can serve as normative rCBF atlases for neuroscientific research or clinical care.
Introduction
Infancy, especially from birth to 12 months of age, is one of the most prominent times of daily energy expenditure across the lifespan1. The adjusted total expenditure increases rapidly during infancy, with a break point around 0.7 years of age1. The infant brain consumes greater than 20% of total body metabolism 2,3 to meet the high energy needs for striking development4. Cerebral blood flow (CBF) is closely related to regional metabolism 5,6. Delineating the developmental pattern of global and regional CBF (rCBF) during infancy may provide insight into the physiological basis of brain development during this critical stage. Here, we sought to determine the normative developmental pattern of infant global CBF obtained from phase-contrast MRI, as well as high-resolution rCBF with isotropic 2.5mm, acquired with a 3D multi-shot, stack-of-spirals pseudo-continuous arterial spin labeled (pCASL) sequence optimized for infant brains.Methods
Infant subjects and acquisition of perfusion pCASL and phase-contrast MRI: Phase-contrast (PC) MRI was acquired in 99 typically developing infants (51M/48F, age range: 0 to 28 months) at 4 feeding arteries to quantify global CBF 7 (Fig. 1). High-resolution ASL images were acquired in forty-three of these infants with a 3D multi-shot, stack-of-spirals pCASL sequence 8,9 in a 3T Siemens Prisma system. The pCASL MRI parameters were: four-shot acquisition, field of view = 192×192 mm2, matrix = 76×76, in-plane resolution = 2.53×2.53 mm2, 48 slices, slice thickness = 2.5 mm, no gap between slices, labeling duration=1600ms, post labeling delay (PLD) = 1800ms, center of labeling slab located between cervical vertebrae C2 and C3 (Fig. 1), repetition time = 4s, echo time = 12ms, number of controls/labels = 10 pairs. In addition, high-resolution T1-weighted images (T1w) with a voxel size of 0.8 mm3 were acquired. rCBF quantification: rCBF were calculated using the single-compartment model 10:$$$ rCBF=(6000*\lambda\cdot\triangle M*exp(\frac{PLD}{T_{1a}}))/(2\alpha\cdot M_b^0\cdot {T_{1a}}\cdot(1-exp(\frac{-LabelDur}{{T_{1a}}}))) $$$ where ΔM is the difference between dynamic-averaged signal intensity in the control image versus the label image; labeling efficiency was assumed to be 0.85, and blood T1 value of arterial blood was assumed to be 1800ms11, $$$ M_b^0 $$$values were estimated with the M0 images from the acquisition. Establishment of population-averaged rCBF maps: All infants’ rCBF maps were mapped to the JHU atlas space 12. Briefly, infants’ T1w images were first registered to their M0 images in the native CBF space. Then, a 12-parameter affine registration transformed the co-registered T1w image of each infant to the template T1w image in the JHU atlas space, followed by a non-linear transformation. Six population-averaged rCBF maps across infancy (age-groups: 0-3, 3-6, 6-9, 9-12, 12-18 and 18-28 months) were then generated. Age-related changes in global and regional CBF: Trajectories of age-related CBF changes were modeled using biphasic linear regression. Clustering of rCBF across cortex: A data-driven clustering approach based on nonnegative matrix factorization (NMF) identified the cortical voxels with similar rCBF changing patterns 13,14.Results
The developmental trajectory of global CBF during infancy was better fitted with a biphasic linear model than a linear model (ANOVA, F(2,97)=12.89, p<1.2x10⁻⁵). As shown in Fig. 2, the global CBF values demonstrated significant age-related increases (r=0.768, p<6.5×10⁻⁸). Specifically, global CBF rose at a rate of 3.49ml/100g/min per month from birth to the break point at 9.8 months of age, followed by sequentially slower change. Fig. 3 shows high-resolution population-averaged rCBF maps from six representative infant age groups. RCBF increases can be seen from the representative axial slices across age groups. Distinct rCBF distribution patterns at different ages are easily observed after mapping to the template cortical surface. Whereas in younger age groups high rCBF values are prominent in the primary auditory/sensorimotor cortices (white arrows in Fig. 3), in the older age groups high rCBF values are located in the frontal and parietal cortices. To reveal the rCBF development pattern across the cortex, instead of using cortical parcellations predefined based on adult brains, we adopted the NMF method on rCBF maps. Five distinct clusters were identified (Fig. 4A). Similarly, rCBF trajectories reproduced the biphasic pattern seen in the analysis of global CBF trajectory, with the age break point varying across clusters (Fig. 4B). Notably, a younger break-point age of 6.6months was observed in cluster 2 (sensorimotor cortices) and cluster 3 (primary auditory cortex). Clusters 4 and 5 were located predominately in the frontal and parietal cortices, and had a break point at 11.2 and 7.8months respectively. Cluster 1, covering primary visual and visual association areas, had a later break point at 11.8months.Discussion and conclusion
The present study demonstrated that CBF increases during early infancy in a biphasic fashion. Interestingly, the global CBF had a similar rise and break point as the adjusted total expenditure during infancy1, consistent with the notion that much of infant whole-body metabolism is dedicated to brain development15. The break point of rCBF increases varied across the cortex - earlier in primary cortices and later in association cortices. Using an optimized infant pCASL protocol with isotropic 2.5mm resolution, the established population-averaged rCBF maps throughout infancy can serve as normative rCBF atlases for neuroscientific research or clinical pediatric care. Analysis to determine the optimal rCBF cluster number is underway.Acknowledgements
This study is funded by NIH MH092535, MH092535-S1, MH123930, EB031284 and HD093776.References
- Pontzer H, Yamada Y, Sagayama H, Ainslie P, Andersen LF, et a., 2021. Daily energy expenditure through the human life course. Science, 373: 808-812.
- Rolfe DFS, Brown GC, 1997. Cellular energy utilization and molecular origin of standard metabolic rate in mamals. Physiol Rev 77: 731-758.
- Kennedy, C. and Sokoloff, L., 1957. An adaptation of the nitrous oxide method to the study of the cerebral circulation in children; normal values for cerebral blood flow and cerebral metabolic rate in childhood. J Clin Invest., 36(7):1130-1137.
- Ouyang M, Dubois J, Yu Q, Mukherjee P, Huang H, 2019. Delineation of early brain development from fetuses to infants with diffusion MRI and beyond. Neuroimage, 185: 836-850.
- Fox PT, Raichle ME, 1986. Focal physiological uncoupling of cerebral blood flow and oxidative metabolism during somatosensory stimulation in human subjects. Proc Natl Acad Sci USA 83(4):1140-1144.
- Gur RC, Ragland JD, Reivich M, Greenberg JH, Alavi A, Gur RE, 2009. Regional differences in the coupling between resting cerebral blood flow and metabolism may indicate action preparedness as a default state. Cerebral Cortex, 19(2): 375-382.
- Ouyang M, Liu P, Jeon T, Chalak L, Heyne R, Rollins NK, Licht DJ, Detre JA, Roberts TP, Lu H, Huang, H., 2017. Heterogeneous increases of regional cerebral blood flow during preterm brain development: Preliminary assessment with pseudo-continuous arterial spin labeled perfusion MRI. Neuroimage, 147: 233-242.
- Chang YV, Vidorreta M, Wang Z, Detre JA, 2017. 3D-Accelerated, Stack-of-Spirals acquisitions and reconstruction of arterial spin labeling MRI. Magn Reson Med 78:1405-1419.
- Vidorreta M, Wang Z, Chang YV, Wolk DA, Ferandez-Seara MA, Detre JA, 2017. Whole-brain background suppressed pCASL MRI with 1D-accelerated 3D RARE stack-of-spirals readout. PLoS one 12(8): e0183762.
- Alsop DC, Detre JA, Golay X, Günther M, Hendrikse J, Hernandez-Garcia L, Lu H, et al, 2015. Recommended implementationof arterial spin-labeled perfusion MRI for clinical applications: a consensus of the ISMRM perfusion study group and the European consortium for ASL in dementia. Magn Reson Med 73:102–116.
- Varela M, Hajnal JV, Petersen ET, Golay X, Merchant N, Larkman DJ, 2011. A method for rapid in vivo measurement of blood T1. NMR Biomed. 24: 80–88.
- Oishi K, Faria A, Jiang H, Li X, Akhter K, Zhang J, et al, 2009. Atlas-based whole brain white matter analysis using large deformation diffeomorphic metric mapping: application to normal elderly and Alzheimer's disease participants. Neuroimage, 46(2): 486-499.
- Sotiras A, Resnick SM, Davatzikos C, 2015. Finding imaging patterns of structural covariance via non-negative matrix factorization. Neuroimage,108: 1-16.
- Ouyang M, Jeon T, Sotiras A, Peng Q, Mishra V, Halovanic C, Chen M, Chalak L, Rollins N, Roberts TP, Davatzikos C, Huang, H, 2019. Differential cortical microstructural maturation in the preterm human brain with diffusion kurtosis and tensor imaging. Proc. Natl. Acad. Sci. USA, 116(10): 4681-4688.
- Kuzawa CW, Chugani HT, Grossman LI, Lipovich L, Muzik O, Hof PR, Wildman DE, Sherwood CC, Leonard WR, Lange N, 2014. Metabolic costs and evolutionary implications of human brain development. Proc. Natl. Acad. Sci. USA, 111(36): 13010-13015.
Figures
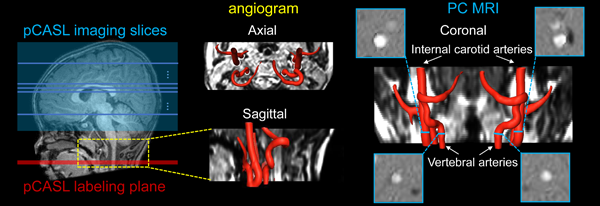
Fig. 1: Perfusion pCASL and PC MRI for regional and global CBF measurements. Labeling (red line) and
imaging (blue box) planes of pCASL are shown on a mid-sagittal slice
of T1w image from a representative infant on the left panel. Axial
and sagittal view of angiogram with reconstructed internal carotid and
vertebral arteries are shown in middle panels. On the right panels, coronal view of the arteries is placed in the middle with four
slices (blue bars) of the PC MRI scans positioned perpendicular to the
respective arteries. PC MRI images are shown on the four panels
surrounding the view.
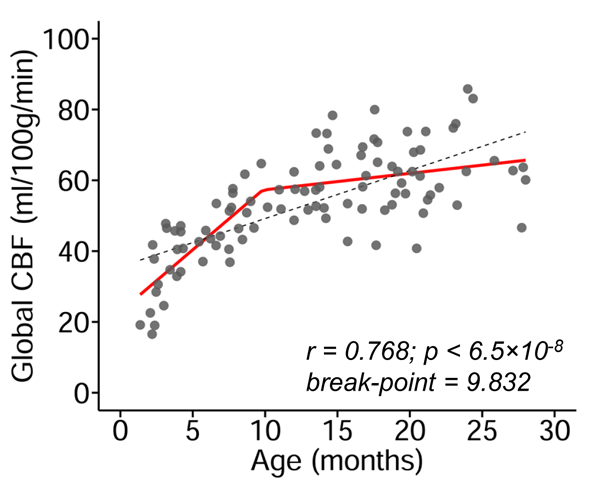
Fig. 2: Main effect of age on global cerebral
blood flow (CBF) during infancy. Global CBF increases during infancy is better
modeled with biphasic linear fitting (red line) than linear fitting (black
dashed line). Data points represent global CBF measured with phase-contrast MRI
of each infant.
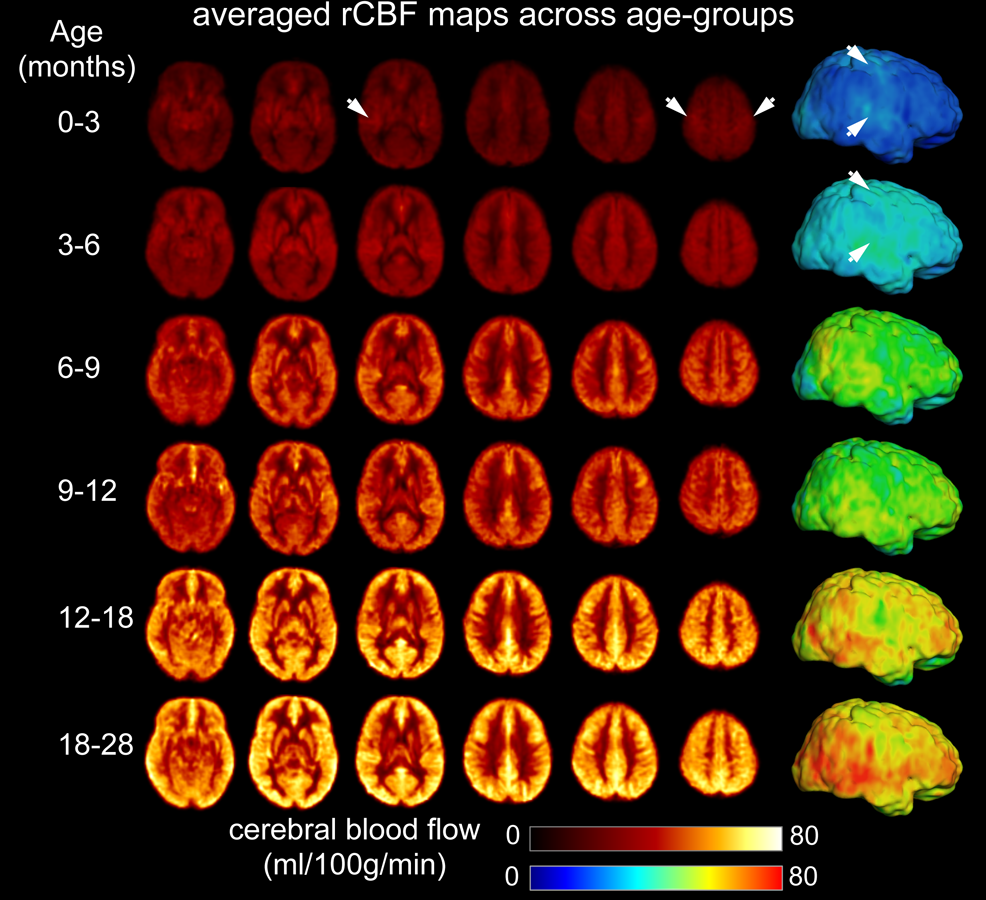
Fig.
3: Population-averaged regional cerebral blood flow (rCBF) maps in template space
from infant age groups of 0-3, 3-6, 6-9, 9-12, 12-18 and 18-28 months. High-resolution
(2.5x2.5x2.5mm3) rCBF maps were acquired with 3D multi-shot,
stack-of-spirals pCASL. Six representative axial slices of averaged rCBF maps
from inferior to superior are shown from the left to right for each age group.
Averaged rCBF maps are projected to the 3D reconstructed template cortical surface. White arrows indicate high CBF values in the primary sensorimotor
and auditory cortices at younger age groups.
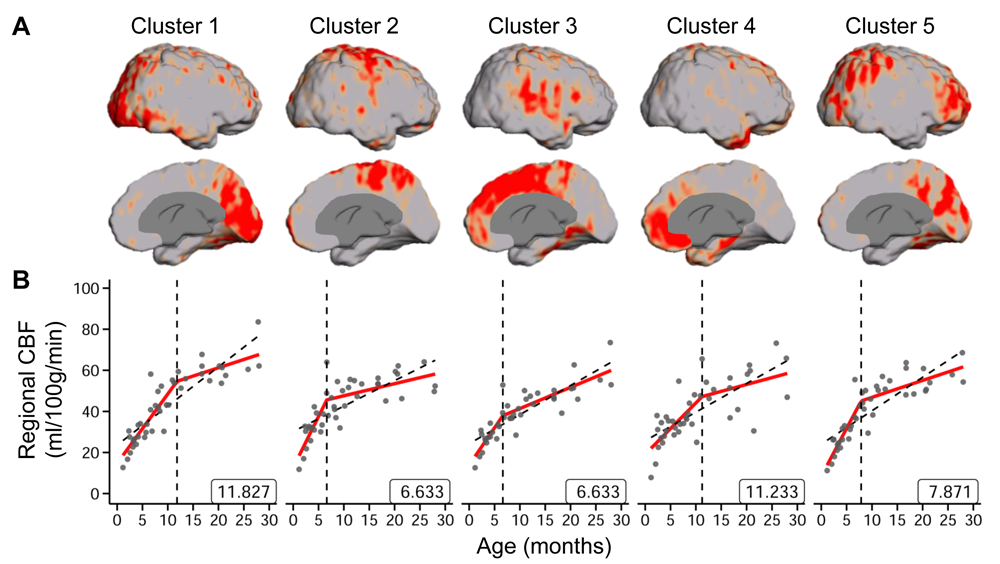
Fig. 4: (A) Cortical voxels were clustered into five groups identified
by non-negative matrix factorization (NMF) according to the trajectory of
change in rCBF over time. The respective locations of the five clusters on the
cortical surface are shown. (B) The rCBF developmental patterns of the five
clusters were modeled with biphasic linear fitting (red lines) and with a linear fitting as reference (black
dashed line). The identified break point from biphasic linear fitting is
provided at the bottom right of each plot. Data points represent rCBF measured
with pCASL MRI for each infant.
DOI: https://doi.org/10.58530/2022/0743