0742
The effects of preterm birth on GABA+, Glx and GSH in the neonatal brain1Centre for the Developing Brain, School of Biomedical Engineering and Imaging Sciences, King’s College London, London, United Kingdom, 2Department of Forensic and Neurodevelopmental Sciences, Institute of Psychiatry, Psychology & Neuroscience, King's College London, London, United Kingdom, 3Russell H. Morgan Department of Radiology and Radiological Science, The Johns Hopkins University School of Medicine, Baltimore, MD, United States, 4Biomedical Engineering Department, School of Biomedical Engineering and Imaging Sciences, King’s College London, London, UK, London, United Kingdom
Synopsis
We have performed the first simultaneous measurement of GABA+, Glx and GSH in the preterm brain. Our main findings show that GABA+ and Glx significantly increased with postmenstrual age in preterm neonates during the 31-45 week period. We additionally found that metabolites underpinning glutamate and GABA neurotransmission levels in preterm babies were significantly lower than normative neonatal values, even when measured at the term time equivalent timepoint. We also identified higher GABA+ and Glx in the thalamus compared with the cortex. Our findings provide further support for the application of edited MRS in neurodevelopment.
INTRODUCTION:
Balance between inhibitory and excitatory neurotransmitter systems and the protective role of the major antioxidant glutathione (GSH) are central to healthy brain development1,2. Disruption to these systems has been implicated in early life pathophysiology of psychiatric disorders and neurodevelopmental conditions including autism spectrum disorder3-5, all of which are more prevalent across the lifespan in people born preterm.The aims of this study are threefold: 1) To measure GABA+, Glx and GSH levels using edited MRS in a “healthy” preterm neonatal population. 2) To establish age trajectories across the full neonatal age range in two regions with contrasting development but both implicated in adverse outcomes following preterm birth (anterior cingulate cortex and thalamus) and 3) To evaluate the effects of preterm birth effects on GABA+, Glx and GSH levels, compared with normative healthy term neonatal metabolite levels6.
METHODS:
Participants 21 healthy preterm babies were recruited with median gestational age at birth: 32 (26-36) weeks. They were scanned at two timepoints: at 34 (31-36) weeks postmenstrual age (preterm timepoint) and at 41 (37-45) weeks postmenstrual age (term equivalent timepoint). A subset of preterm neonates (n=10) were scanned longitudinally at both timepoints.Imaging Participants were scanned without sedation on a Philips Achieva 3T at St. Thomas’ Hospital London (32-channel neonatal head coil7). Anatomical data were collected using T1-weighted MPRAGE and motion-corrected T2-weighted TSE8. MRS data were acquired in two different voxels following ‘pencil-beam’ shimming: left thalamus 24x24x23mm3 and anterior cingulate cortex 31.25x25x17mm3, see Figure 1, using HERMES9 (TR=2s, TE=80ms, 2kHz BW, 2048 points, 320 averages).
Analysis MRS data were pre-processed and quantified using Gannet 3.110 with an optimised double Gaussian 3ppm peak for neonatal data6. Anatomical images were segmented using the developing Human Connectome Project pipeline11, using age-specific brain templates, and tissue and relaxation corrections were applied to metabolic concentrations. A single measures parametric analysis (ANOVA) was used to evaluate the differences between voxel, timepoint of scan and their interaction. Pearson's correlation coefficient was used to investigate metabolic correlations with age.
RESULTS:
Figure 2 shows all the individual and group-averaged GABA+, Glx and GSH edited spectra in the ACC and THA voxels. GABA+ and Glx levels are higher overall in the THA than in the ACC (p<0.0001 for GABA+, p=0.0002 for Glx) and significantly lower in preterm babies than normative neonatal values (p<0.0001), even at term time equivalent age as shown in Figure 3, which illustrates the comparison between the GABA+, Glx and GSH values between three different timepoints (preterm, term equivalent and term).GABA+ and Glx concentrations significantly increase with advancing post-menstrual age in the ACC (p=0.0005, p=0.0040) and THA (p=0.0055, p<0.0001), as shown in Figure 4, which displays the relationship between GABA+ and Glx values with age for the preterm babies. GSH concentrations do not change with advancing post-menstrual age in preterms (data not shown). Longitudinal changes in GABA+ and Glx in preterm babies are displayed in Figure 5.
DISCUSSION & CONCLUSION:
We have performed the first simultaneous measurement of GABA+, Glx and GSH in the preterm brain. Our results show robust GABA+, Glx and GSH estimates in this population and furthermore, demonstrate that edited-MRS can be used to measure distinct maturational trajectories in different brain regions. Our main findings show that GABA+ and Glx significantly increased with postmenstrual age in preterm neonates during the 31-45 week period. Similar age trends have been previously reported for Glx in frontal white matter12,13 and right basal ganglia14, with mixed reports for GABA in the literature, which could be explained by the use of variable voxel sizes, sedation status and tissue composition/relaxation corrections.We additionally found that metabolites underpinning glutamate and GABA neurotransmission levels in preterm babies were significantly lower than normative neonatal values, even when measured at the term time equivalent timepoint. This is consistent with preterm birth causing long-lasting changes in brain growth and development which associate with adverse neurodevelopmental outcomes15. Of particular interest are the effects observed on thalamic growth, cortical microstructure and connectivity16, which our results suggest may associate with/or may be caused by altered neurotransmission.
We identified higher GABA+ and Glx in the thalamus which is in agreement with the known high levels of metabolic activity in this region in during this period, as it has a key role in establishing neural circuits and network connectivity17.
Our findings provide further support for the application of edited MRS in neurodevelopment. The study of how GABA+, Glx and GSH levels and balance are altered by early-life brain injury or genetic risk can provide valuable new insight into the pathophysiology underlying neurodevelopmental disorders in this vulnerable population.
Acknowledgements
The authors thank the clinical staff on the neonatal intensive care unit at St Thomas Hospital London for supporting the work and the parents who consented for their infants to participate in the work. M.Y.L. and the work were funded through a project grant awarded by Action Medical Research [GN2728].
References
1. Blankenship AG, Feller MB. Mechanisms underlying spontaneous patterned activity in developing neural circuits. Nat Rev Neurosci. 2010; 11(1):18-29.
2. McGann JC, Mandel G. Neuronal activity induces glutathione metabolism gene expression in astrocytes. Glia. 2018; 66(9):2024-2039.
3. Ajram LA, Pereira AC, Durieux AMS, et al. The contribution of [1H] magnetic resonance spectroscopy to the study of excitation-inhibition in autism. Prog Neuropsychopharmacol Biol Psychiatry. 2019; 89:236-244.
4. Gaetz W, Bloy L, Wang DJ, et al. GABA estimation in the brains of children on the autism spectrum: measurement precision and regional cortical variation. Neuroimage. 2014; 86:1-9.
5. Rae CD, Williams SR. Glutathione in the human brain: Review of its roles and measurement by magnetic resonance spectroscopy. Anal Biochem. 2017; 529:127-143.
6. Yanez Lopez M, Price NA, Puts N, et al. Simultaneous quantification of GABA, Glx and GSH in the neonatal human brain using magnetic resonance spectroscopy. NeuroImage 2021; 233.
7. Hughes EJ, Winchman T, Padormo F, et al. A dedicated neonatal brain imaging system. Magn Reson Med. 2017;78(2):794-804.
8. Cordero-Grande L, Hughes EJ, Hutter J, et al. Three-dimensional motion corrected sensitivity encoding reconstruction for multi-shot multi-slice MRI: Application to neonatal brain imaging. Magn Reson Med. 2018; 79(3):1365-1376.
9. Saleh MG, Oeltzschner G, Chan KL, et al. Simultaneous edited MRS of GABA and glutathione. Neuroimage. 2016; 142:576-582.
10. Edden RA, Puts NA, Harris AD, et al. Gannet: A batch-processing tool for the quantitative analysis of gamma-aminobutyric acid–edited MR spectroscopy spectra. J Magn Reson Imaging. 2014; 40(6):1445-52.
11. Makropoulos A, Robinson EC, Schuh A, et al. The developing human connectome project: A minimal processing pipeline for neonatal cortical surface reconstruction. Neuroimage. 2018; 173:88-112.
12. Basu SK, Pradhan S, Jacobs MB, et al. Age and Sex Influences Gamma-aminobutyric Acid Concentrations in the Developing Brain of Very Premature Infants. Sci Rep. 2020; 10(1):10549.
13. Kwon SH, Scheinost D, Lacadie C, et al. GABA, resting-state connectivity and the developing brain. Neonatology. 2014; 106(2):149-55.
14. Tanifuji S, Akasaka M, Kamei A, et al. Temporal brain metabolite changes in preterm infants with normal development. Brain Dev. 2017; 39(3):196-202.
15. Quigley MA, Poulsen G, Boyle E, et al. Early term and late preterm birth are associated with poorer school performance at age 5 years: a cohort study. Arch Dis Child Fetal Neonatal Ed. 2012; 97(3):F167-73.
16. Ball G, Boardman JP, Rueckert D, et al. The effect of preterm birth on thalamic and cortical development. Cereb Cortex. 2012; 22(5):1016-24.
17. Kostović I, Sedmak G, Judaš M. Neural histology and neurogenesis of the human fetal and infant brain. Neuroimage. 2019; 188:743-773.
Figures
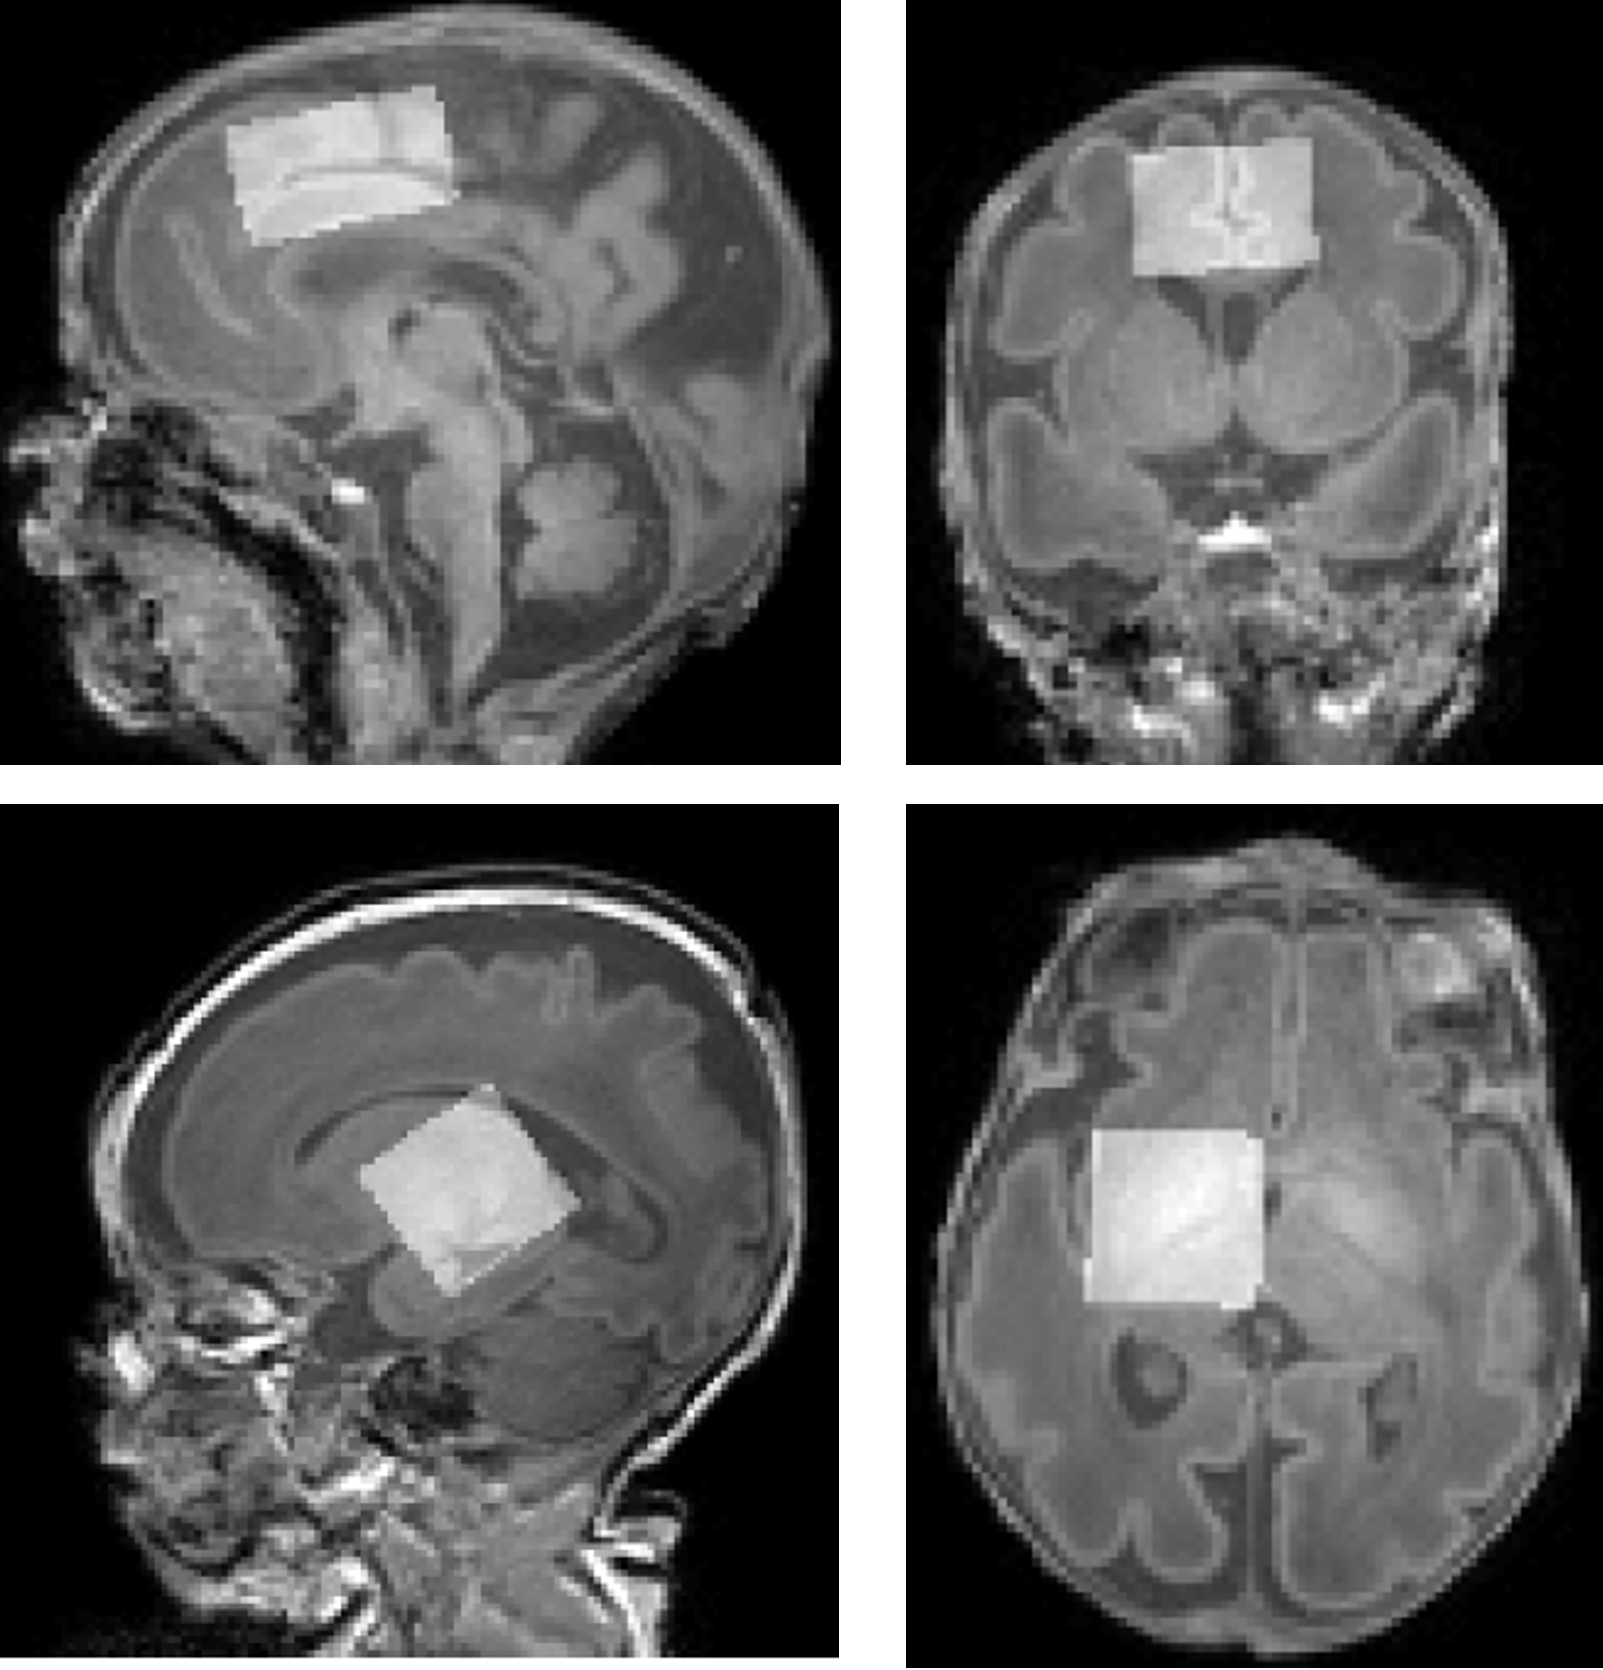
Figure 1: Representative voxels centred over the anterior cingulate cortex (top, 31.25x25x17 mm3) and the left thalamus (bottom: 24x24x23 mm3), superimposed on T1-weighted data.
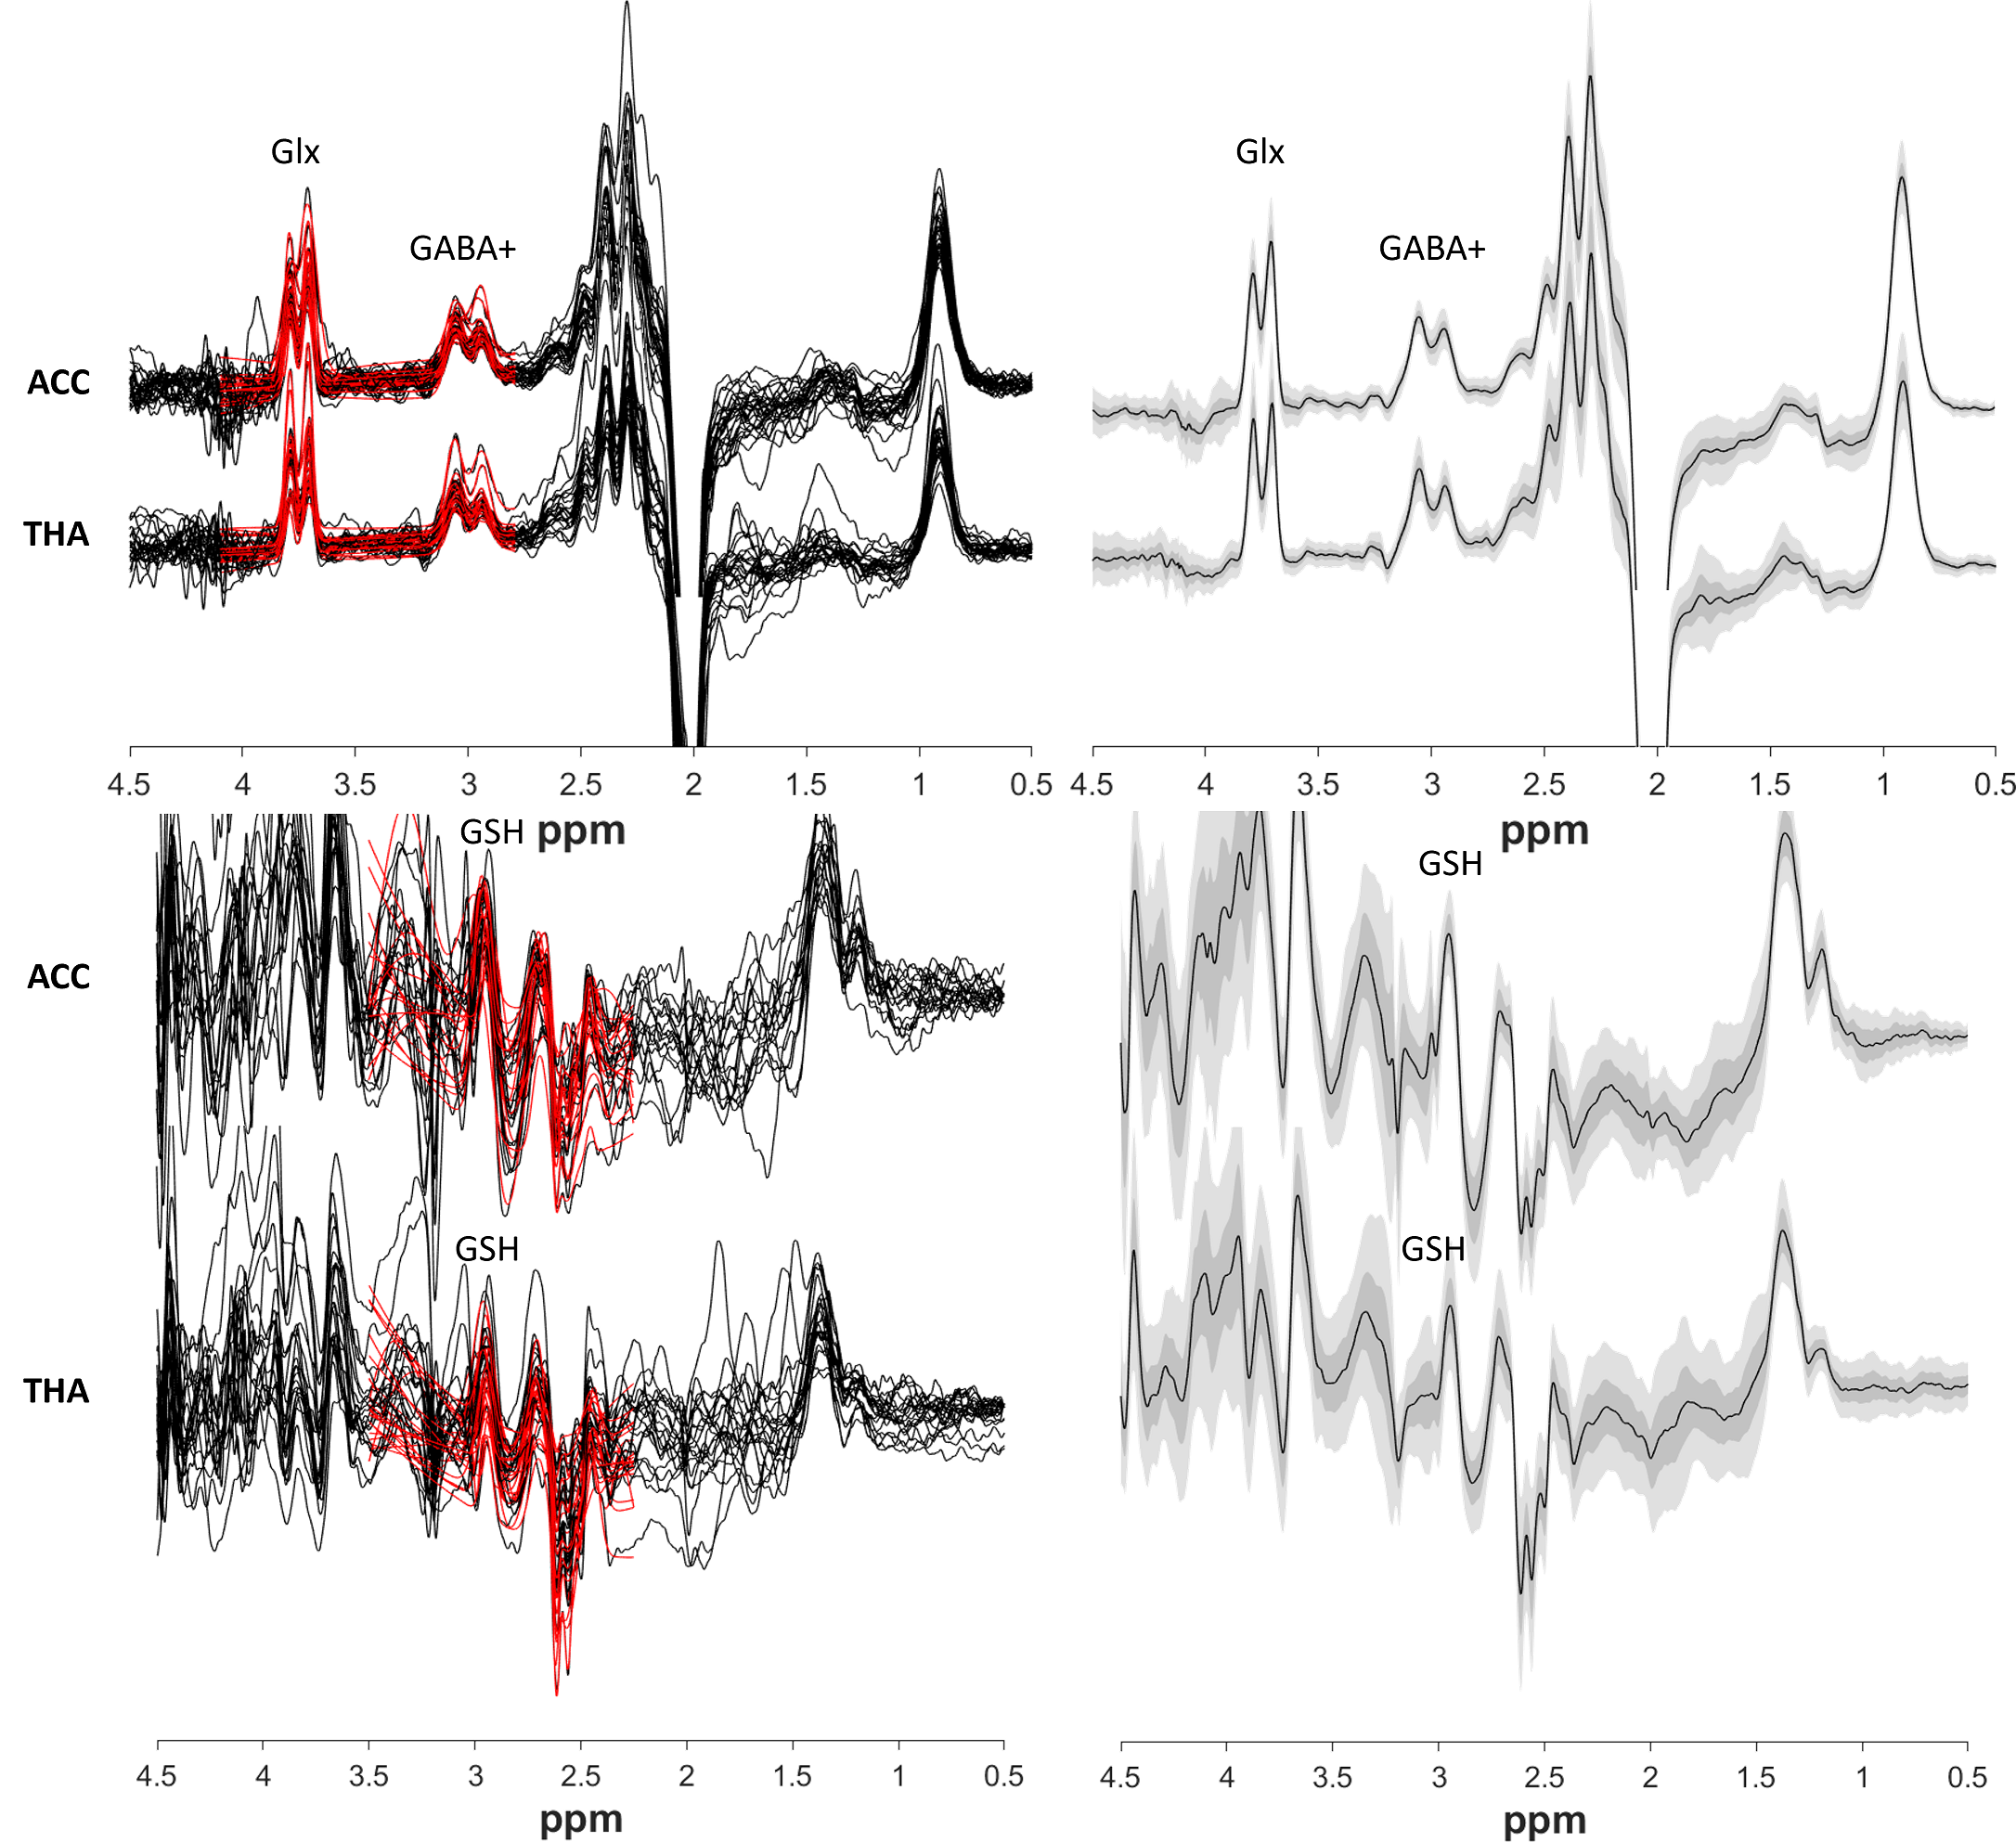
Figure 2: Left column) GABA+ and Glx edited spectra (top) and GSH edited spectra (bottom). Right column) Group averages in black, with the standard deviation in dark green/grey and the 95% confidence interval in light green/grey.
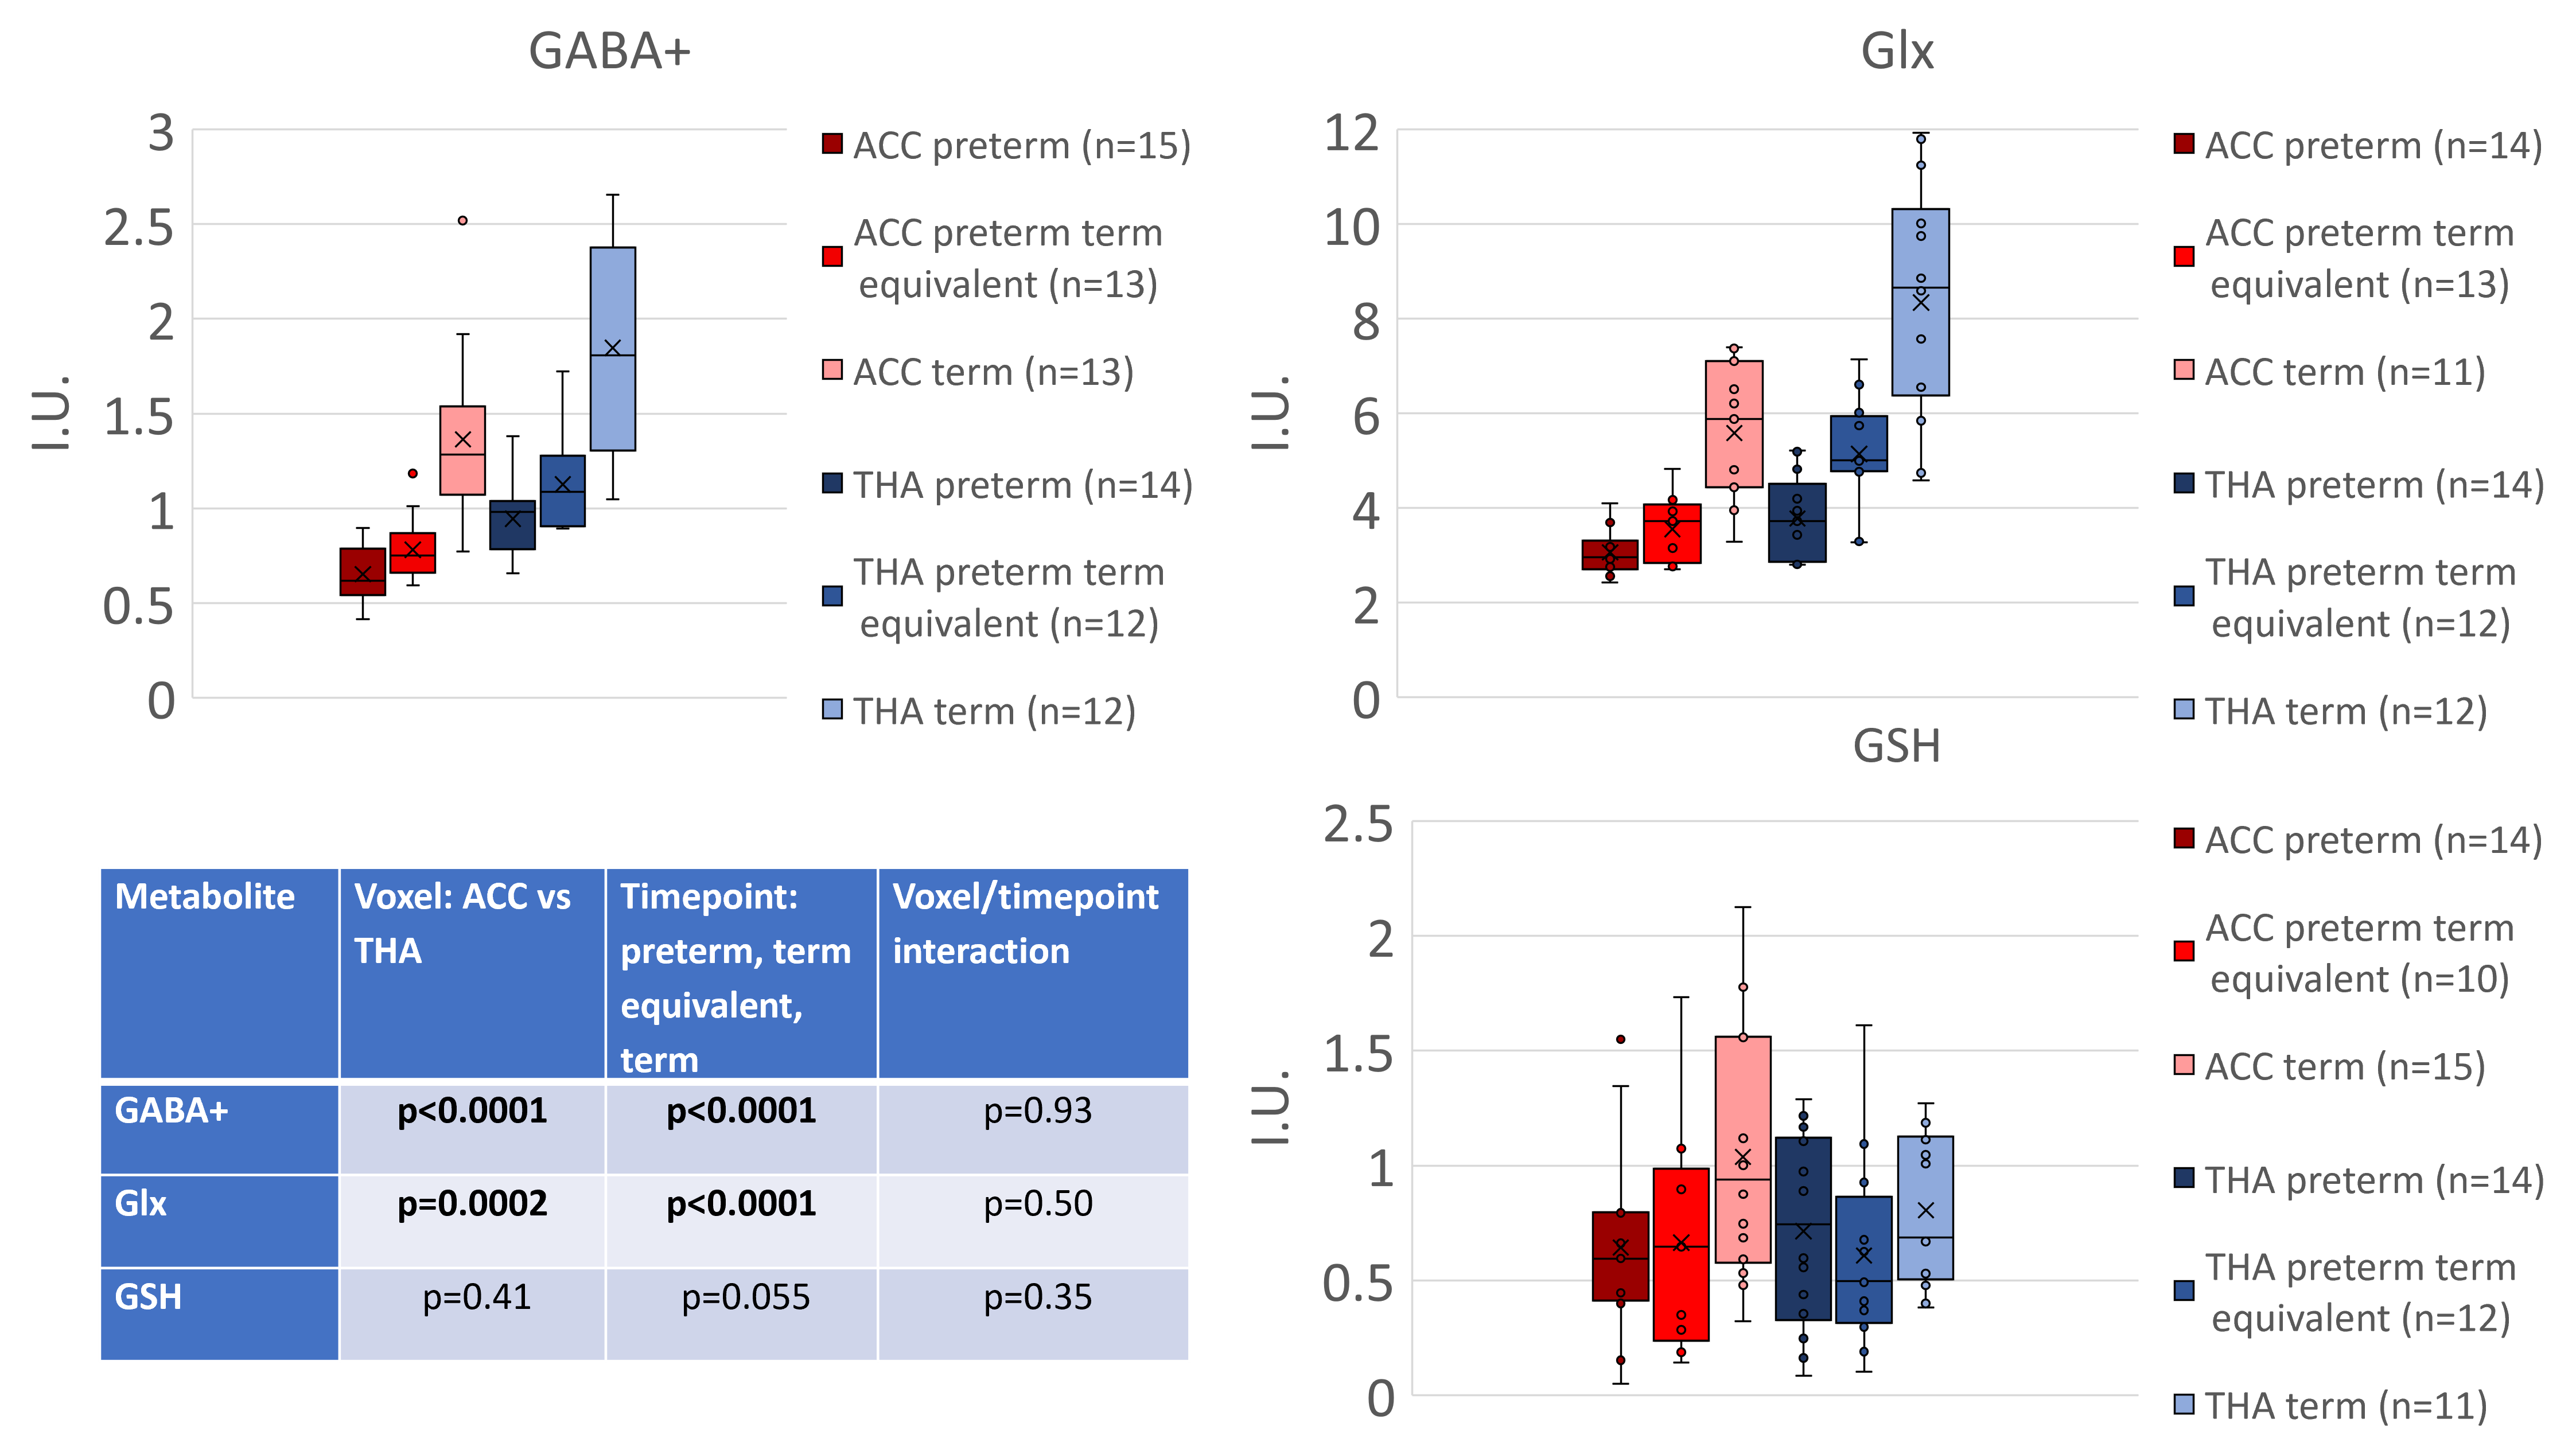
Figure 3: GABA+, Glx and GSH concentrations for three timepoints (preterm neonates at preterm and term equivalent timepoint, plus healthy term normative neonatal values6). Estimated metabolic concentrations are displayed in institutional units, with the water signal used as reference and tissue and relaxation corrections applied.
Table shows the results from single measures parametric analysis (ANOVA. There are statistically significant overall differences between the levels of Voxel and Timepoint of scan (for GABA+ and Glx).
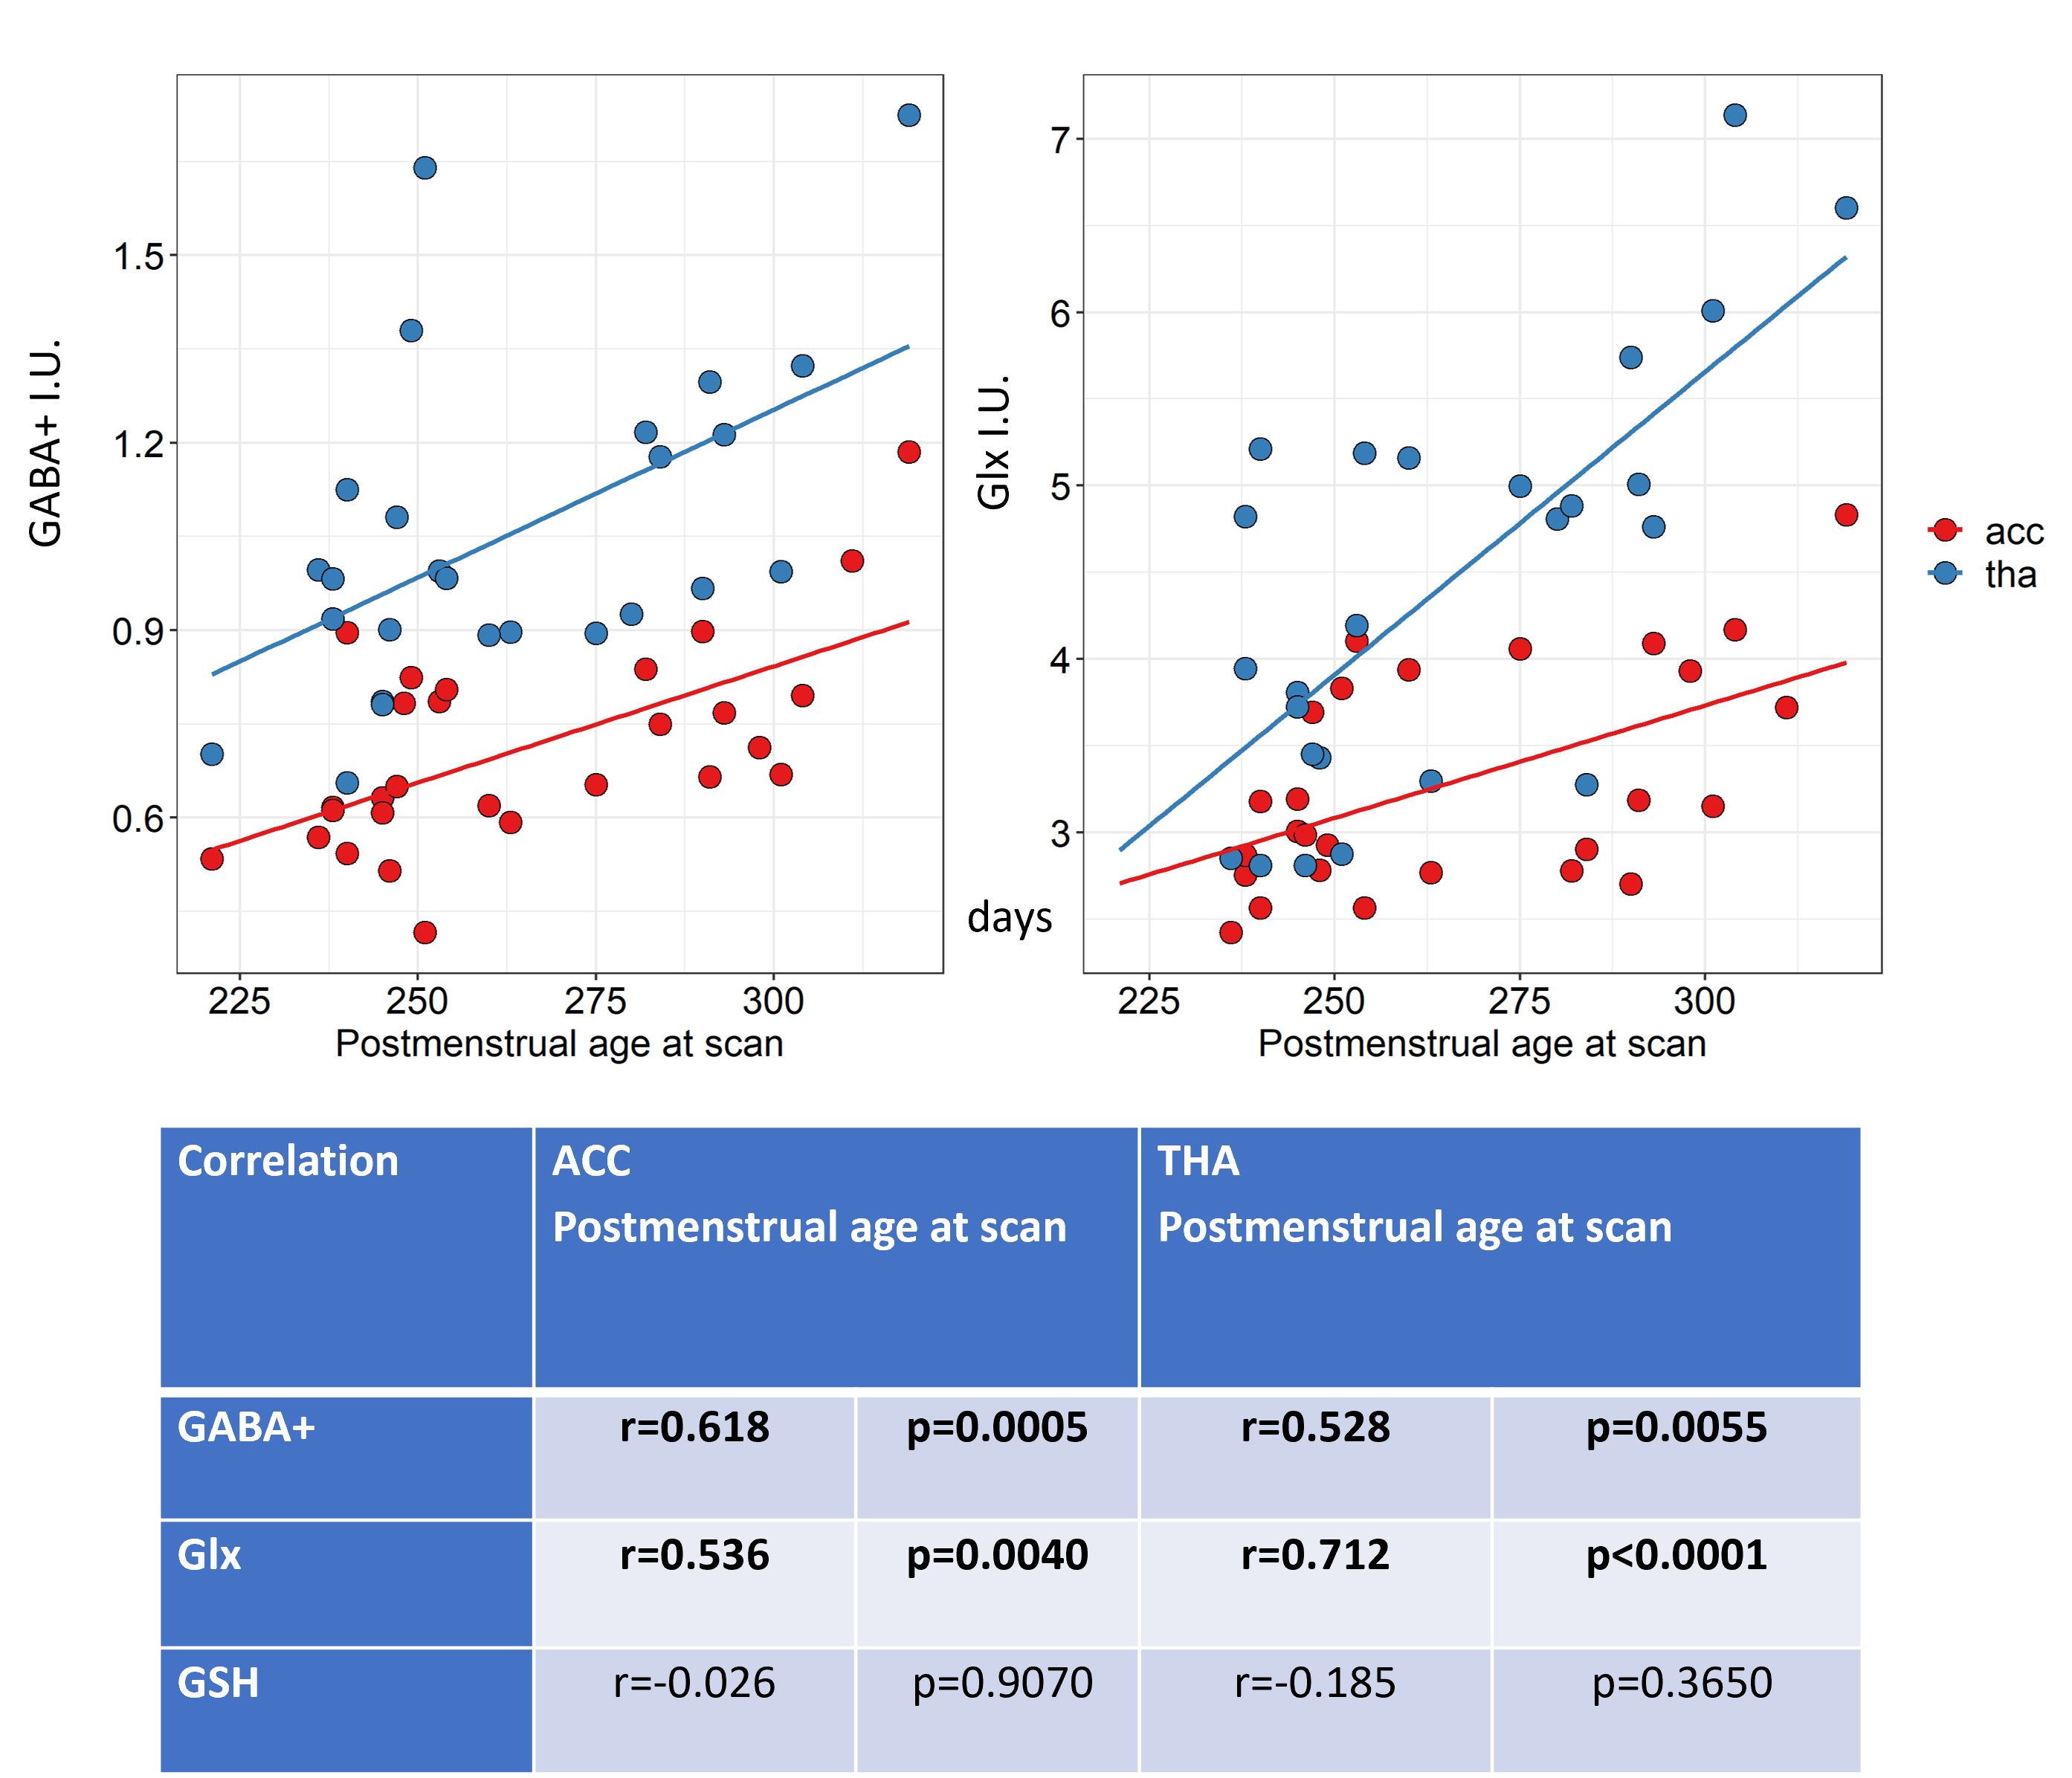
Figure 4: GABA+ and Glx correlations with postmenstrual age at scan (in days) for the ACC (in red) and the thalamus (in blue). Estimated metabolic concentrations are displayed in institutional units, with the water signal used as reference and tissue and relaxation corrections applied.
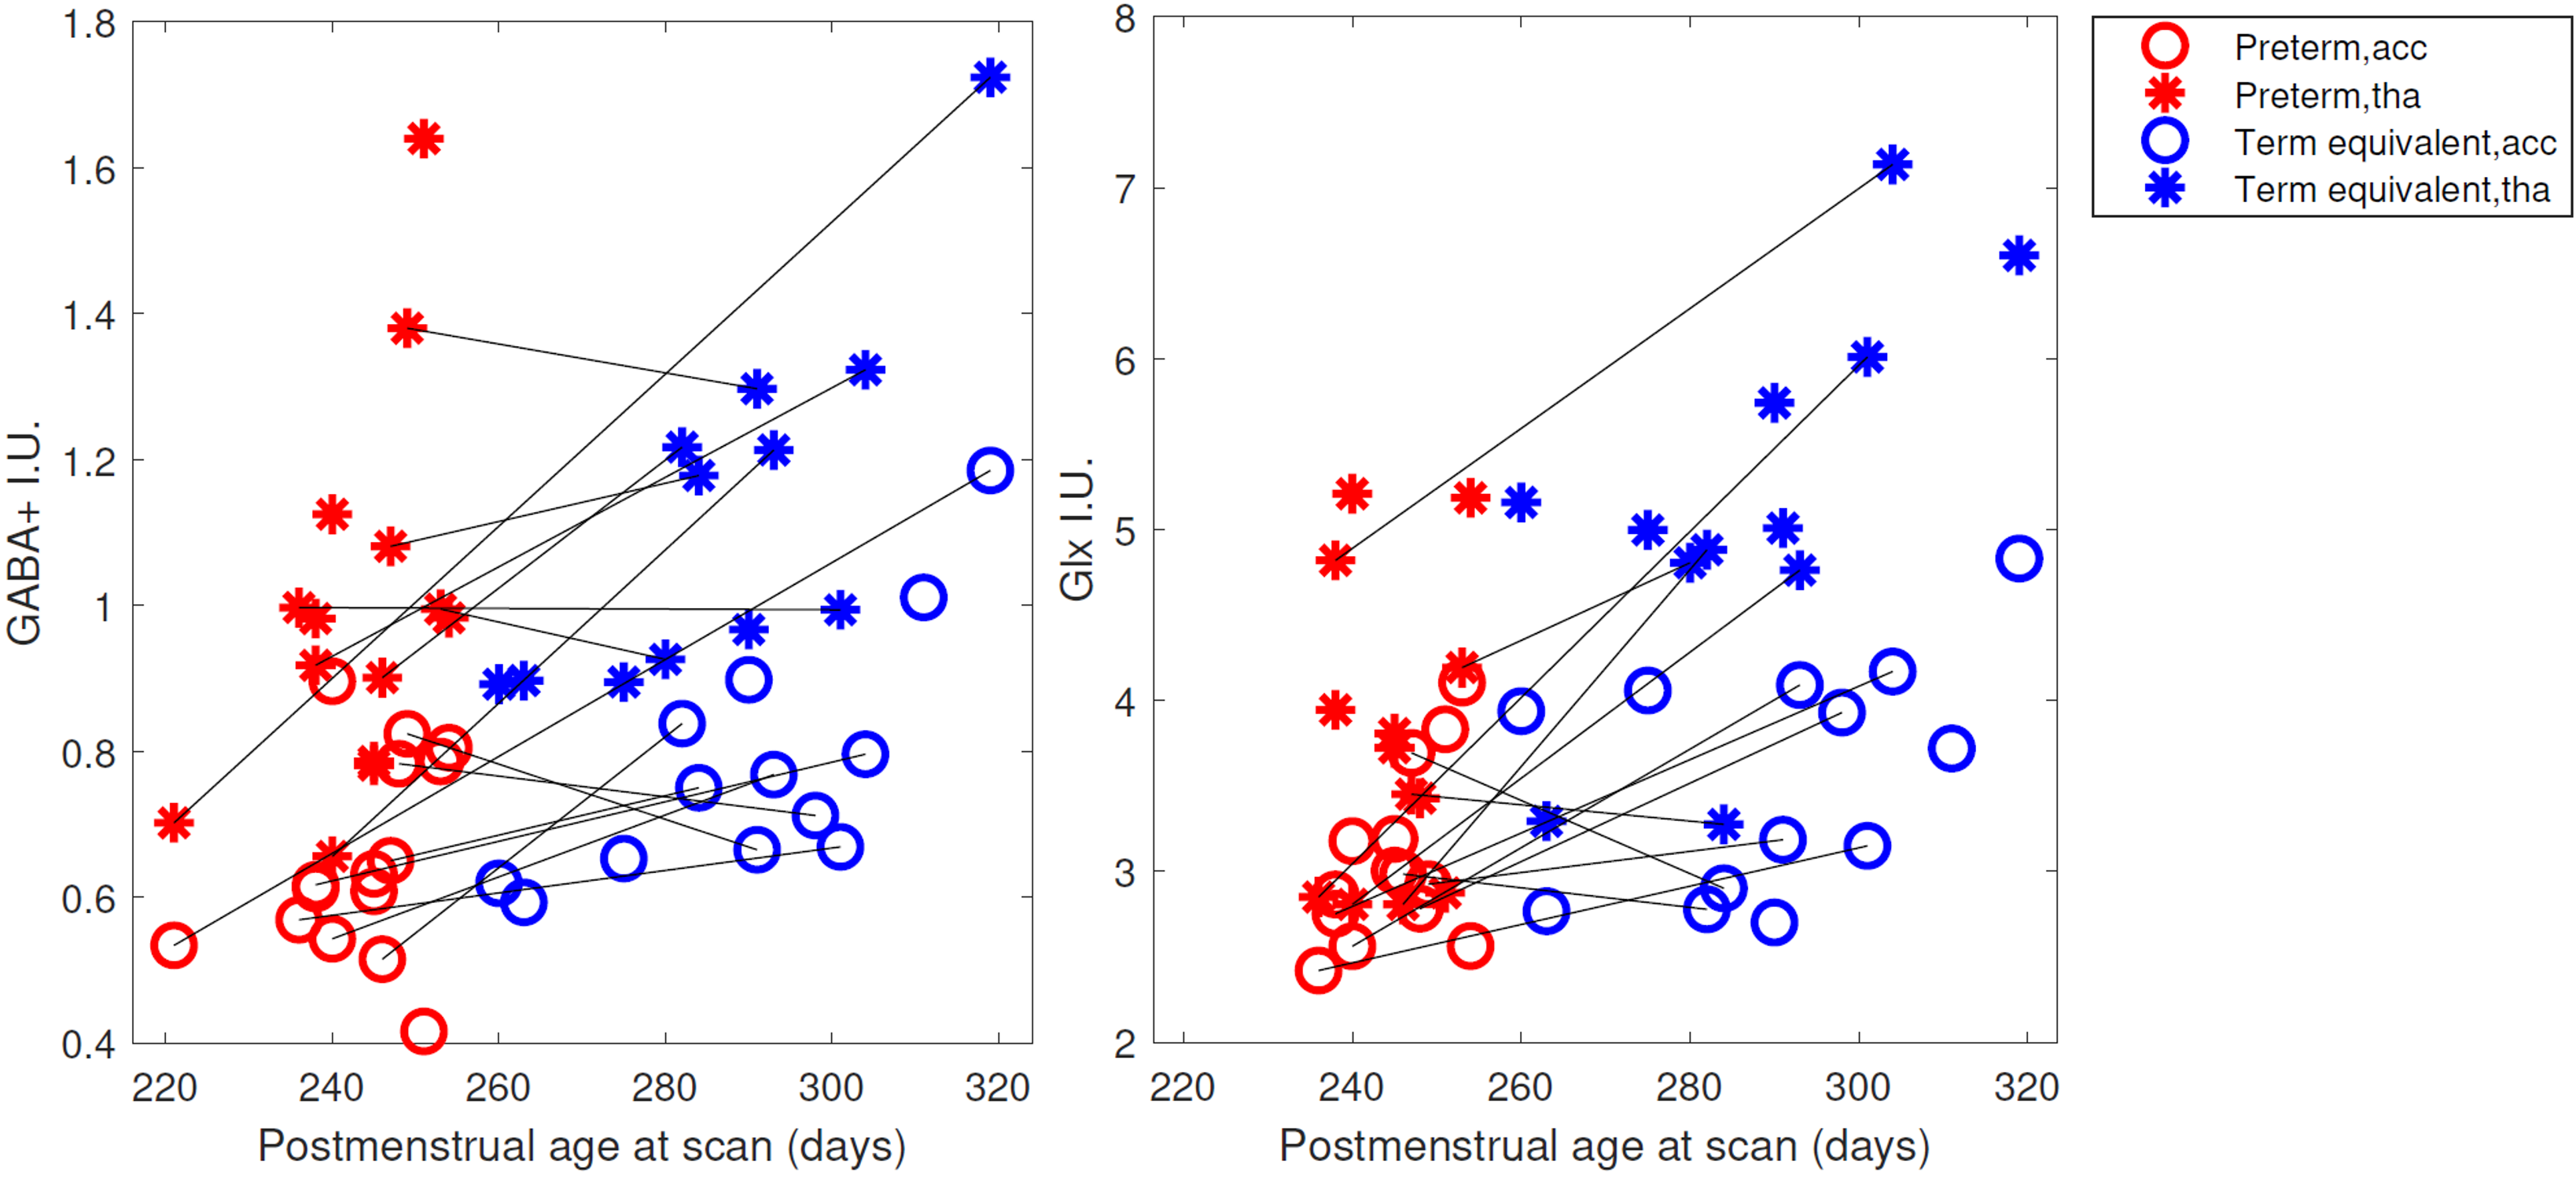
Figure 5: GABA+ and Glx changes with postmenstrual age at scan (in days) in the ACC (circles) and the thalamus (asterisks). Black lines link longitudinal measurements (same neonatal participant scanned at preterm, in red, and term equivalent timepoint, in blue). Estimated metabolic concentrations are displayed in institutional units, with the water signal used as reference and tissue and relaxation corrections applied.