0741
Regional assessment of cerebral oxygen extraction fraction in neonates with hypoxic-ischemic-encephalopathy: a pilot study1Department of Radiology, Johns Hopkins University School of Medicine, Baltimore, MD, United States, 2Department of Pediatrics, Johns Hopkins University School of Medicine, Baltimore, MD, United States, 3Department of Biomedical Engineering, Johns Hopkins University School of Medicine, Baltimore, MD, United States, 4F.M. Kirby Research Center for Functional Brain Imaging, Kennedy Krieger Research Institute, Baltimore, MD, United States, 5Department of Diagnostic Radiology and Nuclear Medicine, University of Maryland School of Medicine, Baltimore, MD, United States
Synopsis
Hypoxic-ischemic-encephalopathy (HIE) is the leading cause of neonatal mortality and severe neurological impairment in childhood. Quantification of cerebral oxygen-extraction-fraction (OEF) in neonates with HIE may provide valuable information to guide the treatment and predict clinical outcome. In this pilot study, we used a novel MRI technique, accelerated-T2-relaxation-under-phase-contrast (aTRUPC), to measure regional OEF in neonates with HIE. We demonstrated a trend towards lower cortical OEF in HIE neonates compared to healthy controls. In addition, neonates with severer brain injury had lower cortical OEF. These findings suggest that regional OEF measurement may be useful in evaluating cerebral injuries in HIE.
INTRODUCTION
Hypoxic-ischemic-encephalopathy (HIE), caused by disruption of cerebral blood flow and oxygen supply perinatally, is the leading cause of neonatal mortality and severe neurological impairment in childhood1. Cerebral oxygen-extraction-fraction (OEF), which indicates the balance between oxygen demand and supply, is an important index of brain function and tissue viability. Quantification of OEF in neonates with HIE may provide valuable information to guide the treatment and predict clinical outcome. Recently, an accelerated-T2-relaxation-under-phase-contrast (aTRUPC) MRI technique has been developed to measure region-specific OEF in neonates2. aTRUPC simultaneously quantifies OEF in major cerebral veins such as the superior-sagittal-sinus (SSS), vein-of-Galen (GV) and internal-cerebral-veins (ICVs), thus providing OEF information for both cortical and deep-brain regions. In this pilot study, we used aTRUPC to measure regional OEF in neonates with HIE and examined the association between OEF and the severity of brain injury evaluated by the National-Institute-of-Child-Health-and-Human-Development (NICHD) score3.METHODS
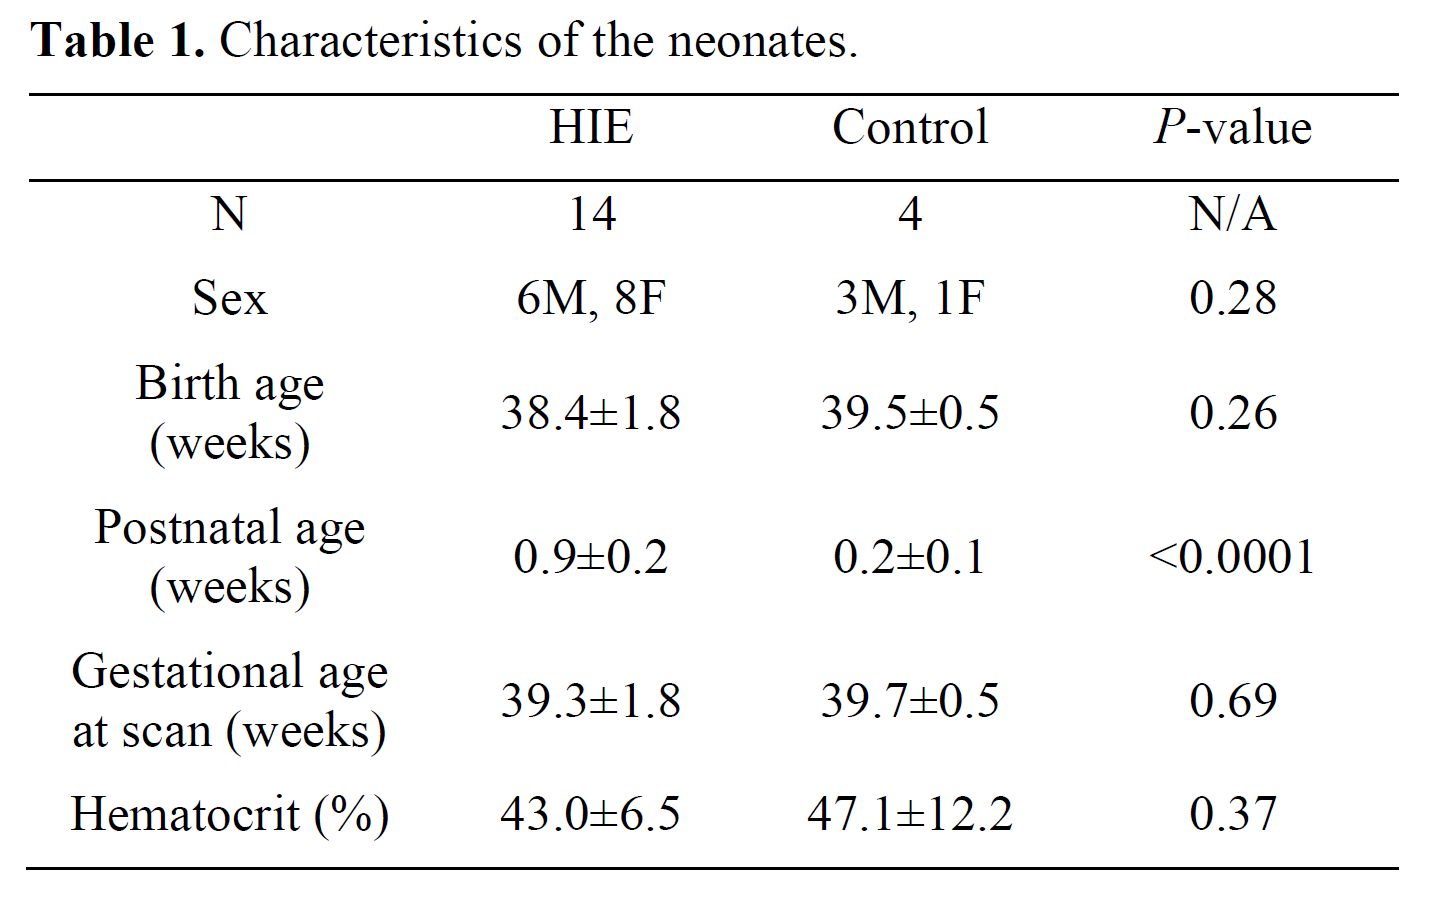
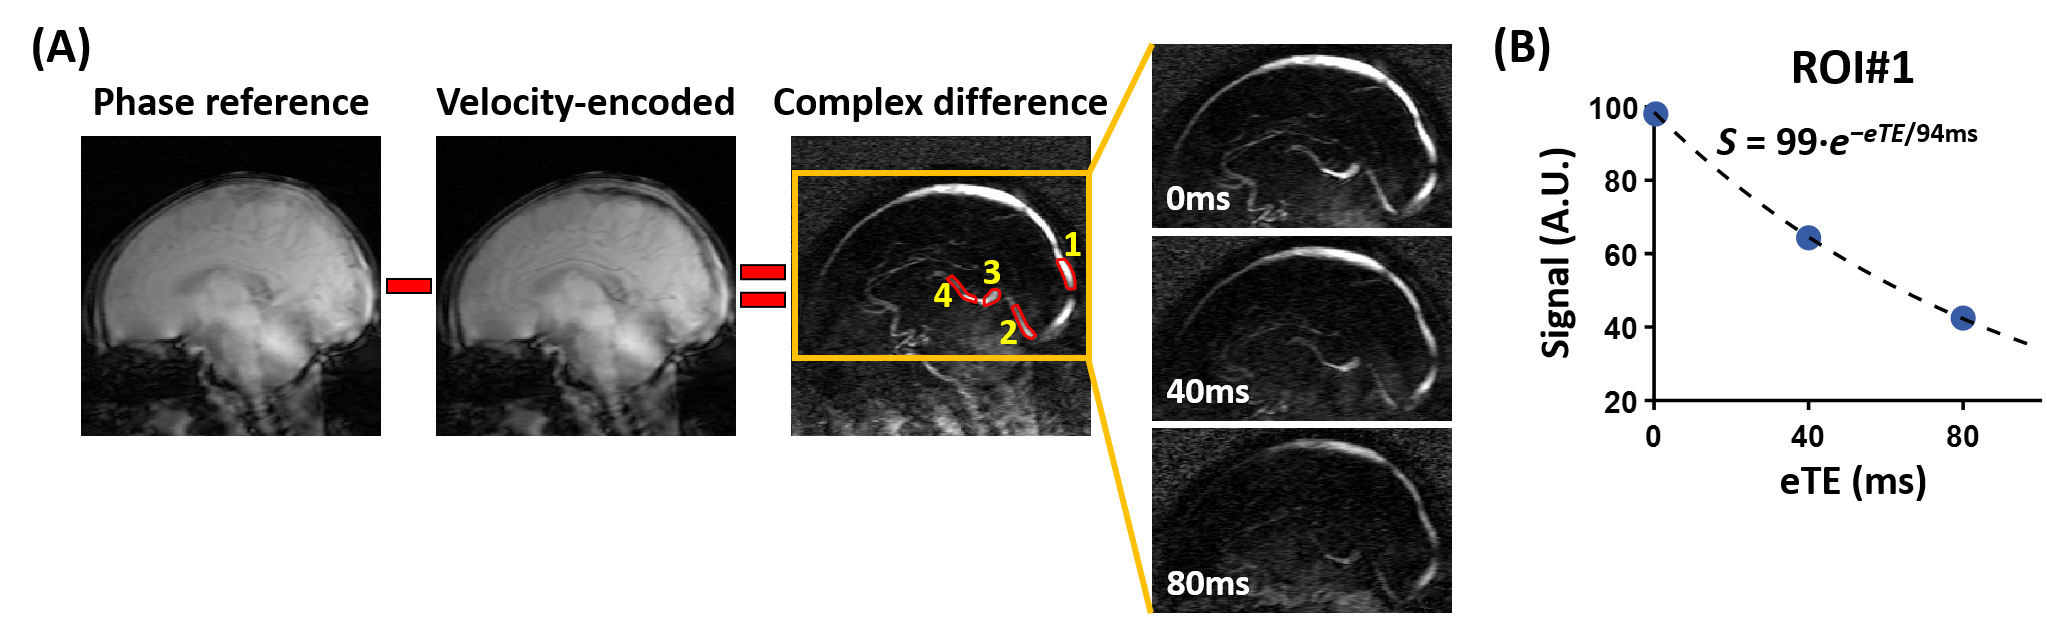
Participants: We studied fourteen neonates with HIE (6M/8F) and four healthy control neonates (3M/1F). All HIE neonates had hypothermia treatment following the NICHD guidelines and were rewarmed before the MRI scans. The characteristics of the neonates are listed in Table 1. There were no differences in gestational age (GA) at birth, hematocrit or sex between the control and HIE neonates (P>0.2). The postnatal age was older for HIE neonates (P<0.0001), but the GA at the scan date was similar between HIE and control (P=0.69).MRI Experiments: All neonates were scanned during natural sleep without anesthesia on a 3T Siemens Prisma scanner. Regional OEF was measured by aTRUPC using a previously optimized protocol2: 2D single-slice in the mid-sagittal plane, field-of-view=130×130mm2, slice thickness=10mm, reconstructed resolution=0.5×0.5mm2, 3 effective-TEs (eTEs): 0, 40 and 80ms, velocity-encoding (VENC)=5cm/s, and scan time=3.7min. In addition, global cortical OEF was obtained using a well-established technique, T2-relaxation-under-spin-tagging (TRUST) MRI4,5. For HIE neonates, anatomical scans including T1-weighted and T2-weighted imaging were acquired to evaluate the brain injury. During the MRI scan, arterial oxygenation (Ya) was measured by an MRI-compatible pulse oximeter.
Data Processing: The aTRUPC data were processed to obtain venous oxygenation (Yv) maps in the major cerebral veins, following procedures in the literature2. OEF maps can then be computed by OEF=(Ya−Yv)/Ya×100%. For quantitative analyses, OEF values were extracted from four region-of-interests (ROIs), as illustrated in Figure 1A. ROI#1 was placed on the posterior segment of SSS to indicate cortical OEF. ROI#2-4 were placed on the deep veins (straight-sinus, GV and ICVs), and their averaged OEF represented the deep-brain OEF. In addition, global cortical OEF was quantified from the TRUST data4,5.
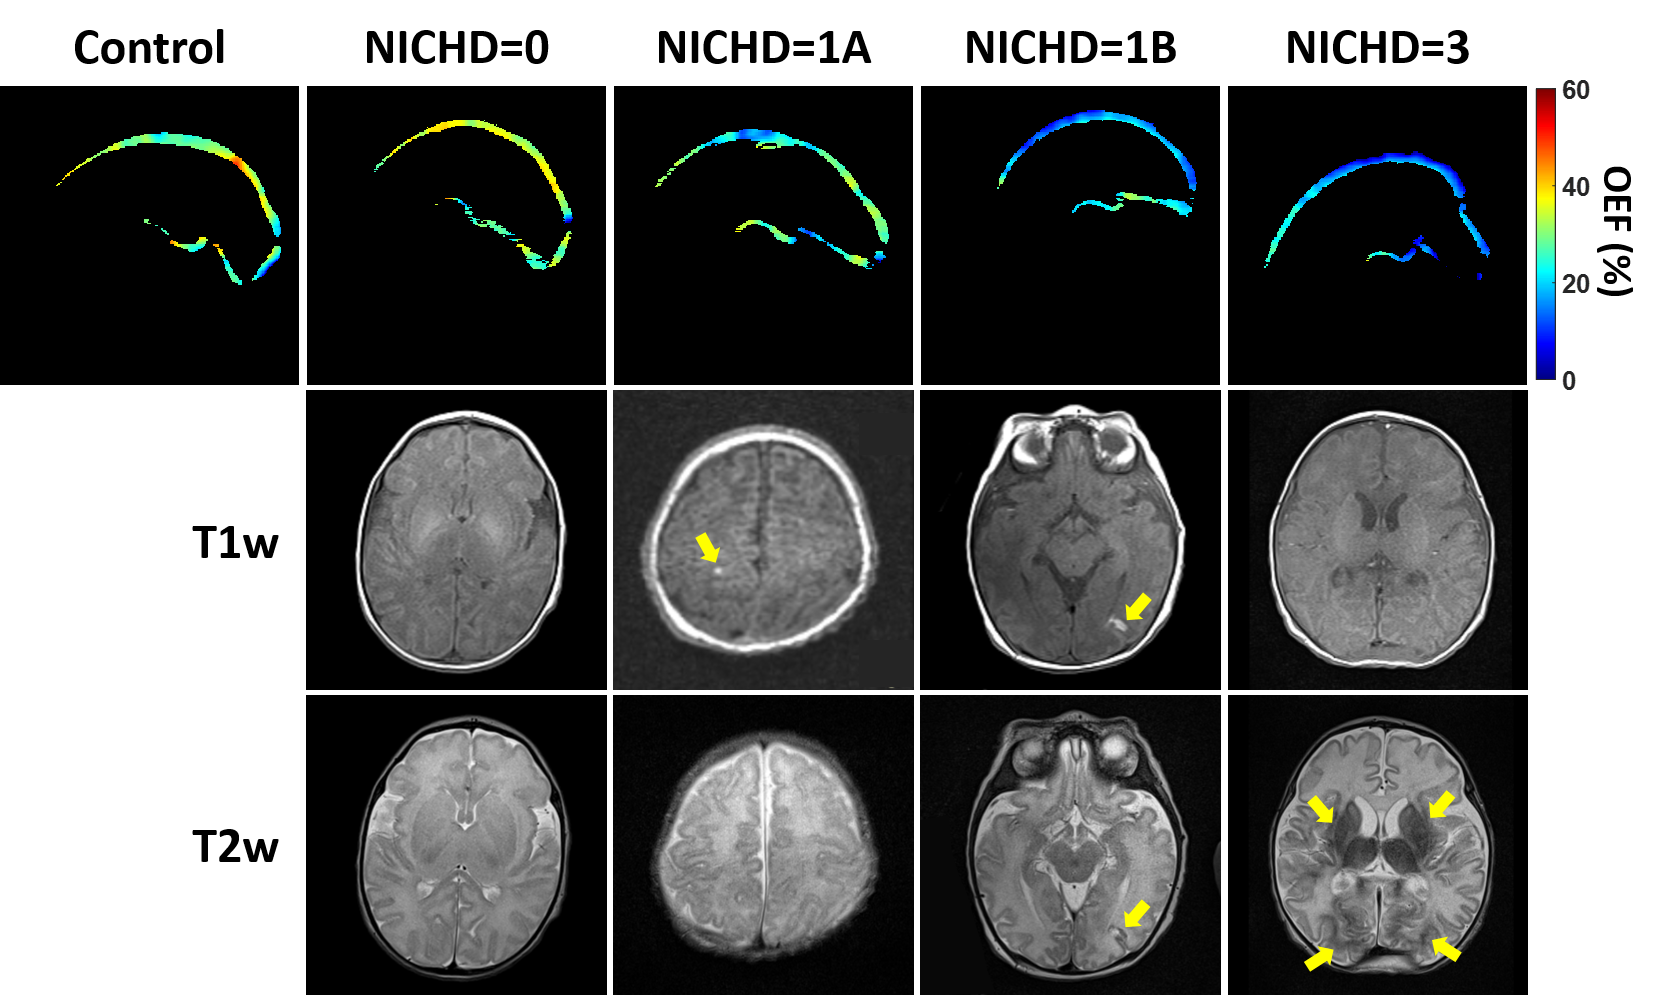
For the HIE neonates, a pediatric neuroradiologist (>10 years of experience) graded the T1-weighted and T2-weighted images using the NICHD score3: 0=no structural injury; 1A=minimal cerebral lesions without injury in basal-ganglia and thalamus (BGT) or internal-capsule; 1B=extensive cerebral lesions without injury in BGT or internal-capsule; 2A=any injury in BGT or internal-capsule; 2B=same criteria as 2A with additional cerebral lesions; and 3=cerebral hemispheric devastation.
Statistical Analysis: Two-sample t-test was used to compare the OEF (cortical or deep-brain) between control and HIE neonates. Linear regression was employed to examine the associations between OEF and the severity of brain injury, by stratifying the neonates into four groups: 0=control, 1=no structural injury (NICHD=0), 2=minimal injury (NICHD=1A), and 3=extensive injury (NICHD=1B or worse). GA at scan and sex were used as covariates.
RESULTS AND DISCUSSION
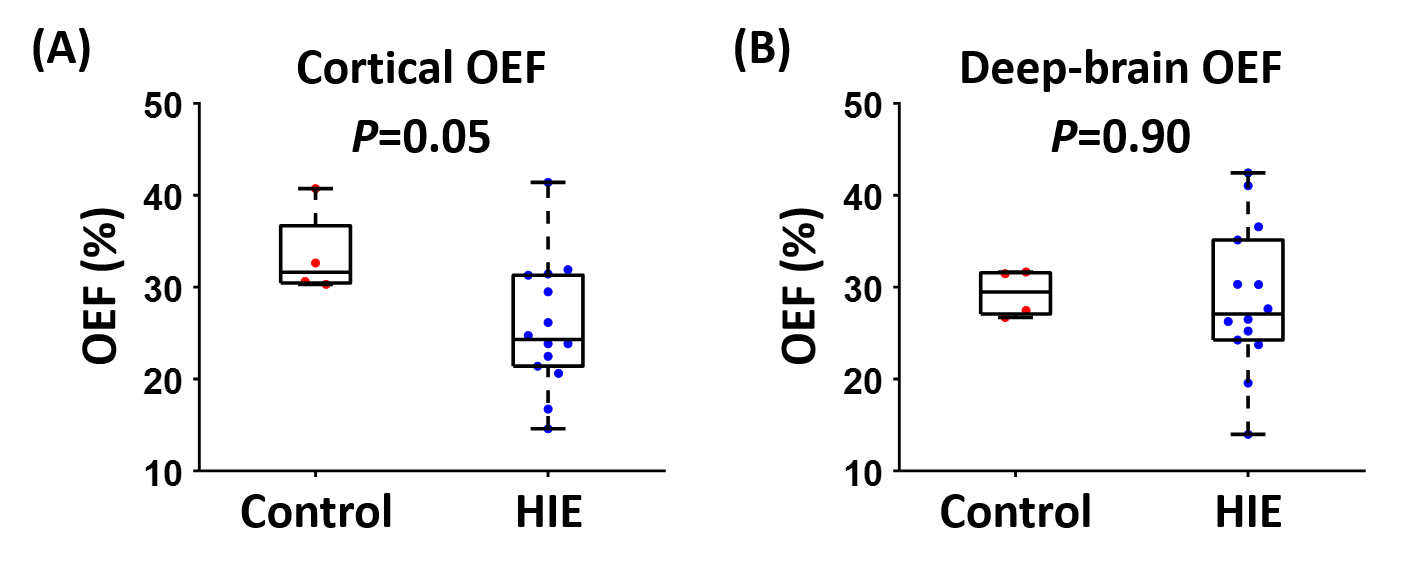
Among the 14 HIE neonates, eight were graded as NICHD=0, four as 1A, one as 1B and one as 3. Figure 1 shows representative aTRUPC data. Figure 2 displays representative OEF maps of neonates within each category of the NICHD scores. Compared to the control neonate, HIE neonates with NICHD=0 (no structural injury) or 1A (minimal lesion) had relatively similar OEF. The neonate with NICHD=1B had a low OEF in the cortical region but a normal-appearing OEF in the deep brain, which was consistent with the extensive cortical lesions but spared deep-brain structures of this neonate. This manifests the advantage of regional OEF measurement when the disease mainly affects specific brain regions. The neonate with NICHD=3 had low OEF in both cortical and deep-brain regions.Figure 3 compares the OEF between control and HIE neonates. There was a trend towards lower cortical OEF in HIE neonates (P=0.05), but the deep-brain OEF values were similar (P=0.90), which may be explained by the scarcity of deep-brain injuries in this cohort.
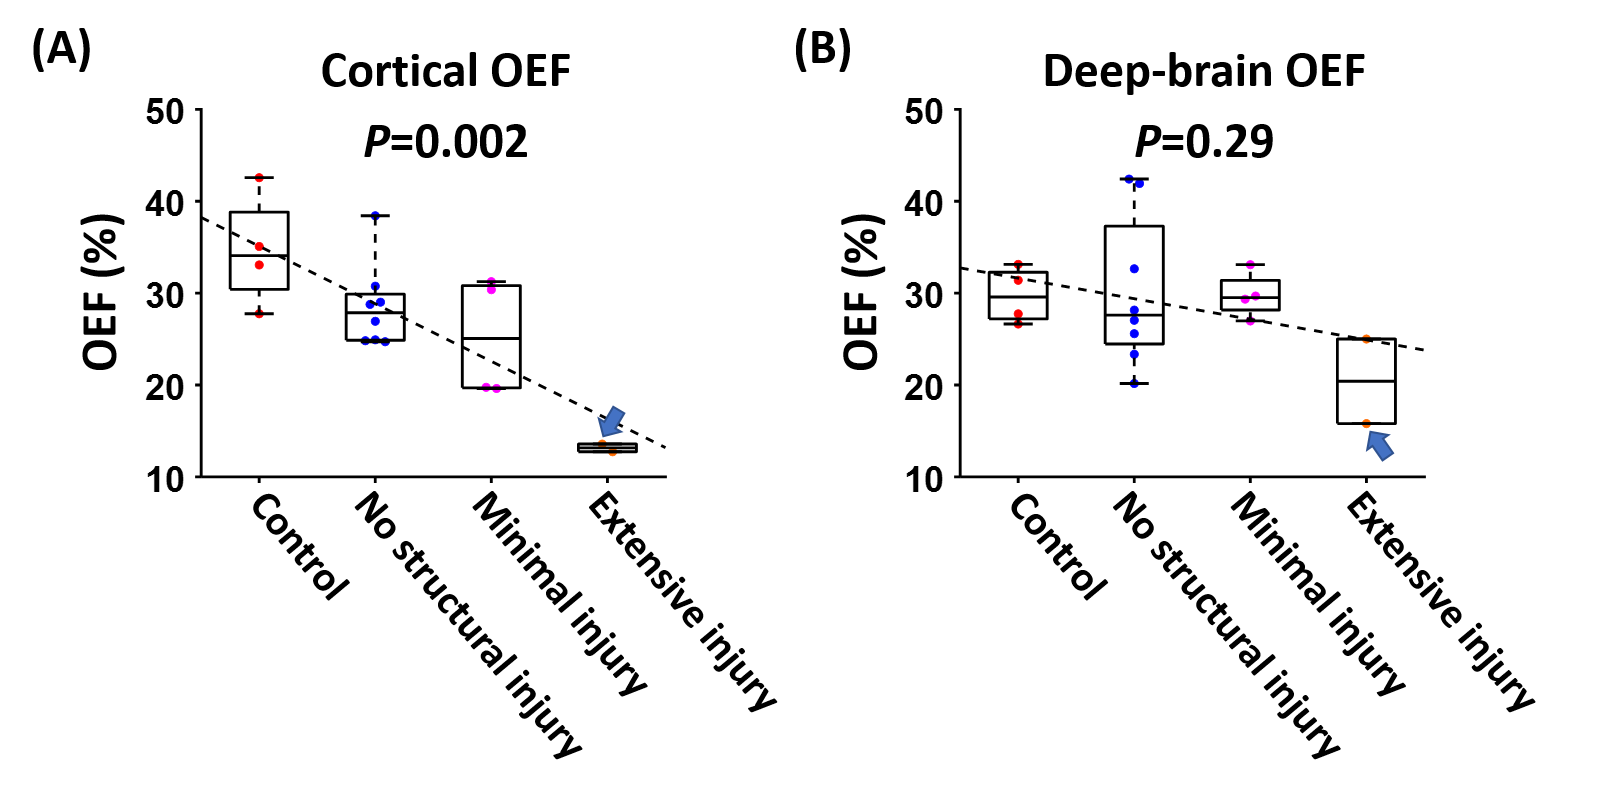
After further stratifying the neonates based on the severity of brain injury, we found that neonates with severer brain injury had lower cortical OEF (P=0.002), as shown in Figure 4A. We performed similar analyses by replacing aTRUPC cortical OEF with TRUST OEF and observed a similar association (P=0.002), corroborating our findings with aTRUPC. We did not observe a significant association between deep-brain OEF and the severity of injury (P=0.29), which may be because only one neonate (NICHD=3) had deep-brain injuries. However, we note that this neonate had the lowest deep-brain OEF among all neonates (arrows in Figure 4).
CONCLUSION
This pilot study demonstrated that aTRUPC can provide regional assessment of cerebral OEF in neonates with HIE. Regional OEF may be useful in evaluating cerebral injuries in different brain regions.Acknowledgements
No acknowledgement found.References
1. Kurinczuk JJ, White-Koning M, Badawi N. Epidemiology of neonatal encephalopathy and hypoxic-ischaemic encephalopathy. Early Hum Dev 2010;86:329-338.
2. Jiang D, Lu H, Parkinson C, Su P, Wei Z, Pan L, Tekes A, Huisman T, Golden WC, Liu P. Vessel-specific quantification of neonatal cerebral venous oxygenation. Magn Reson Med 2019;82:1129-1139.
3. Shankaran S, Barnes PD, Hintz SR et al. Brain injury following trial of hypothermia for neonatal hypoxic-ischaemic encephalopathy. Arch Dis Child Fetal Neonatal Ed 2012;97:F398-404.
4. Liu P, Huang H, Rollins N, Chalak LF, Jeon T, Halovanic C, Lu H. Quantitative assessment of global cerebral metabolic rate of oxygen (CMRO2) in neonates using MRI. NMR Biomed 2014;27:332-340.
5. Liu P, Parkinson C, Jiang D, Ouyang M, De Vis JB, Northington FJ, Tekes A, Huang H, Huisman T, Golden WC. Characterization of MRI techniques to assess neonatal brain oxygenation and blood flow. NMR Biomed 2019;32:e4103.
Figures