0738
Vital Signs, Temperature and COMFORT Scale Scores in Infants During Ultra-High-Field MR Imaging.1Department of Neonatology, University Medical Center Utrecht, Utrecht, Netherlands, 2Department of Radiology, University Medical Center Utrecht, Utrecht, Netherlands, 3Department of Biomedical Engineering, Eindhoven University of Technology, Eindhoven, Netherlands
Synopsis
7T MRI in infants could improve cerebral diagnostic quality, but safety should be evaluated before standard use. In this study, twenty infants without respiratory support between term-equivalent age and 3 months corrected age, were scanned on 7T directly after 3T MRI. Vital signs (heart rate, oxygen saturation and respiratory rate), temperature (rectal, body and brain), COMFORT scale scores and adverse events were monitored throughout the process. None of these parameters changed around 7T MRI. Also, heart rate and temperature were not significantly different during 7T, when compared to 3T MRI. Therefore scanning infants at 7T appears to be safe.
Introduction
Cerebral MRI in infants is usually performed on 3T. 7T MRI potentially increases the spatial resolution and improves the use of advanced imaging, such as MR spectroscopic imaging1,2 and vascular imaging3. Previously, we showed that global and peak specific absorption rate (SAR) levels at 7T in an infant model do not exceed the levels in an adult model4,5, and that hearing protection can be guaranteed6. Here we focus on related and additional effects: thermal heating of the infant and the potential effects of the main static magnetic field. We provide an overview of vital signs, temperature, COMFORT scale (CS) scores and adverse events (AE’s) before, during and after 7T MRI.Methods
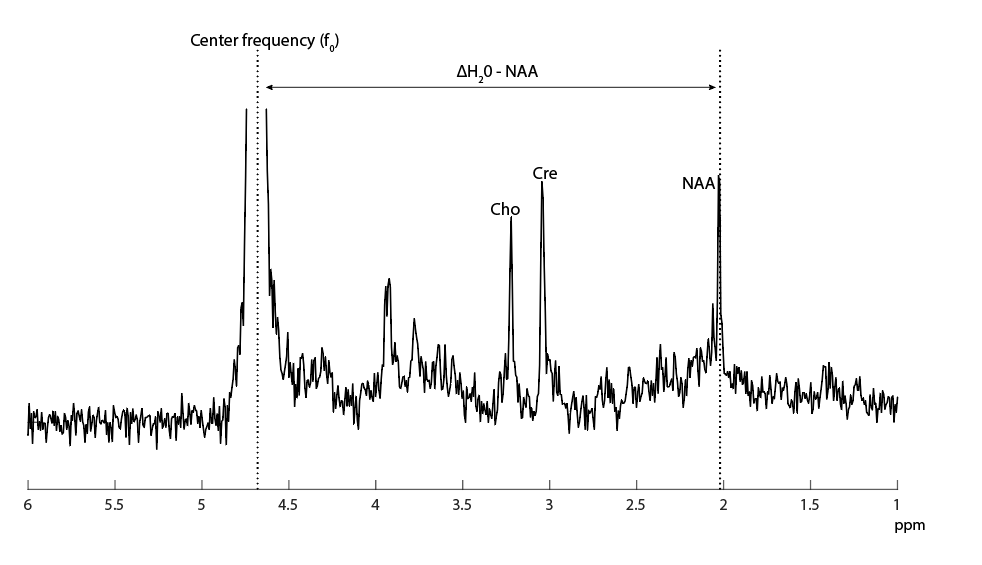
Twenty clinically stable infants without respiratory support between term-equivalent age and 3 months corrected age, were scanned at 7T right after their clinical 3T MRI scan (both Philips Healthcare Best, The Netherlands). At 7T, a 2-channel transmit 32-channel receive head coil (Nova Medical, Wilmington, MA) was used. All infants were sedated before 3T MRI.Vital signs (heart rate (HR), oxygen saturation (SpO2) and respiratory rate (RR)) were closely monitored during both MRI scans. HR and SpO2 were continuously measured from 1-2 hours before, until 18 hours after both MRI scans. Temperature was measured rectally before, and every 6 hours after the MRI scans until 18 hours after MRI scans. Body temperature was measured continuously during both MRI scans via a sensor attached to the abdomen. 1H MRS data was acquired (3T: PRESS, TE/TR=38/2000ms; 7T: STEAM, TE/TR=10/2000ms) from a single voxel in the left deep gray matter. From this data, brain temperature was determined by assessing the chemical shift difference between water (H20) and N-acetyl-aspartate (NAA) (figure 1), as described before7,8,9.
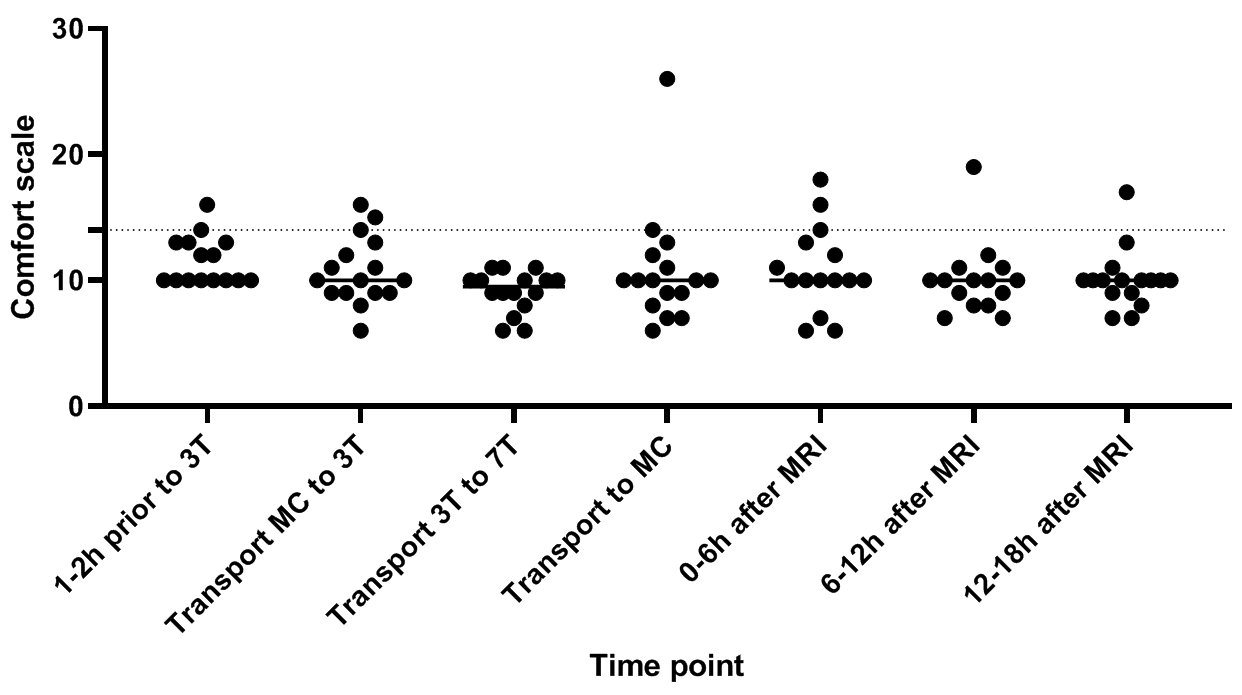
The CS10 is a scoring system containing 6 items (alertness, agitation, crying, body movements, facial muscle tension and overall muscle tension) with a 5-point scale (1=comfortable and 5=discomfort). In general, a score >14 indicates discomfort. The CS was scored 1-2 hours before MRI scans, during transport after both MRI scans, and every 6 hours after the MRI scans until 18 hours after MRI scans. AE’s (desaturation (SpO2 <85%), apnea (>20 seconds episode of cessation of breathing), hypothermia (<35.5ºC), hyperthermia (>38.5ºC), bradycardia (<100 bpm), tachycardia (>200 bpm), need for interruption of scanning, stopping scans prematurely and events like regurgitation mentioned by parents after discharge) were monitored. We used the paired-samples t-test or Wilcoxon signed rank test (for not-normal distributed data) to assess differences between 3T and 7T MRI.
Results
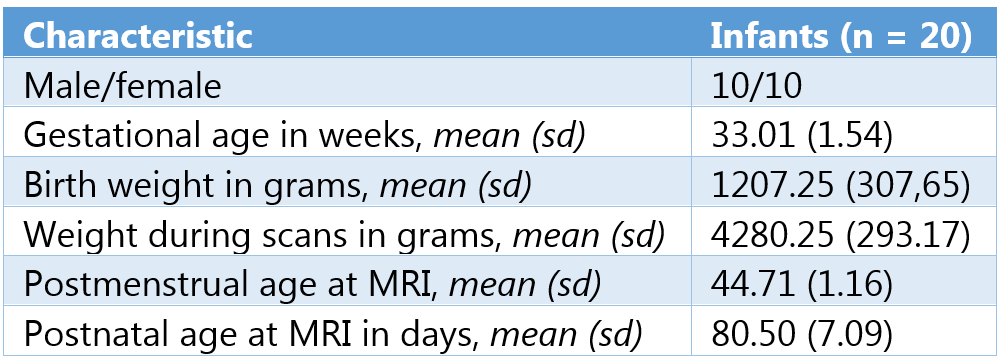
Table 1 shows the baseline characteristics. There was no significant difference between the HR at the end of 3T compared to the end of 7T (mean bpm: 144 and 140, respectively; Z=-0.806; p=0.420). SpO2 was significantly lower at the end of 3T compared to the end of 7T (mean SpO2: 94% and 96%, respectively; p=0.002). Temperature was stable during the whole observation period (figure 2A). Also, brain temperature did not change at 7T, compared to 3T (mean temperature: 36,1ºC and 36,0ºC, respectively; p=0.998), (figure 2B).CS scores showed no difference during transport after 3T compared to transport after 7T (mean CS: 8.9 and 10.7, respectively; Z=-1.670; p=0.095), (figure 3). One infant showed a highly increased CS during transport after 7T MRI, most likely due to being hungry, since the infant quickly recovered after feeding. At last, no changes in AE’s were reported after 7T MRI (table 2). Apnea, hypothermia, hyperthermia, bradycardia, need for circulatory or respiratory support and AE’s after discharge never occurred. Desaturations were related to a premature breathing pattern, almost always already occurring before 7T MRI. Tachycardia in one infant during 7T was induced by crying and directly recovered after comforting the infant. One infant showed regurgitation of milk after 7T MRI, already occurring before MRI scans. 7T scans were paused a few times due to technical problems, movement artifacts or inadequate monitoring. Three infants cried during 3T MRI and during 7T MRI, all were comforted quickly.
Discussion and Conclusion
No changes in vital signs, temperature, CS scores and AE’s were found in infants around 7T MRI. Also, HR and temperature were not significantly different during 7T, compared to 3T MRI. Brain temperature was lower compared to rectal or surface temperature, this is in line with previous studies7,8. We have used localized F0 determination of water as determined automatically by the scanner prior to the metabolite scan. Even more accurate assessments may be obtained by using the non-suppressed water scan and to evaluate potential frequency drifts of NAA during the metabolite scan, or to use metabolite cycling with non-suppressed water12. Lower SpO2 during 3T could be caused by sedation administered before 3T MRI, with effects of sedation possibly wearing off during the 7T scan. This could possibly also lead to slightly higher comfort scores after 7T.Ultra-high field strengths pose potential areas of risk for the infant. The SAR and sound pressure levels were previously modeled4. Here we show that 7T MRI in infants induces no significant changes in vital signs, temperature, CS scores and AE’s. Therefore, 7T MRI appears to be safe in infants without respiratory support. Future research should elucidate the advantages of 7T compared to 3T MRI, possibly improving diagnostic quality.
Acknowledgements
I.M. van Ooijen and K.V. Annink shared first authorship; J.P. Wijnen and N.E. van der Aa shared last authorship.References
1. Van der Kolk AG, Hendrikse J, Zwanenburg JJ, Visser F, & Luijten PR. Clinical applications of 7 T MRI in the brain. Eur J Radiol. 2013;82(5):708-718.
2. Dagia C & Ditchfield M. 3 T MRI in paediatrics: challenges and clinical applications. Eur J Radiol. 2008;68(2):309-319.
3. Springer E, Dymerska B, Cardoso PL, et al. Comparison of routine brain imaging at 3 T and 7 T. Invest Radiol. 2016;51(8):469.
4. Annink KV, van der Aa NE, Dudink J, et al. Introduction of ultra-high-field MR imaging in infants: preparations and feasibility. Am J Neuroradiol. 2020;41(8):1532-1537.
5. Malik SJ, Hand JW, Satnarine R, Price AN & Hajnal JV. Specific absorption rate and temperature in neonate models resulting from exposure to a 7T head coil. Magn Reson Med. 2021.
6. Huijing ER, Wiegers, E, Klomp DWJ, et al. Damping of acoustic noise for neonatal MRI at 7 Tesla; ISMRM 2021.
7. Wu TW, McLean C, Friedlich P, et al. Brain temperature in neonates with hypoxic-ischemic encephalopathy during therapeutic hypothermia. J Pediatr. 2014;165(6):1129-1134.
8. Annink KV, Groenendaal F, Cohen D, et al. Brain temperature of infants with neonatal encephalopathy following perinatal asphyxia calculated using magnetic resonance spectroscopy. Pediatr Res. 2020;88(2):279-284.
9. Alderliesten T, de Vries LS, Staats L, et al. MRI and spectroscopy in (near) term neonates with perinatal asphyxia and therapeutic hypothermia. Arch Dis Child Fetal Neonatal Ed. 2017;102(2):F147-F152.
10. Ambuel B, Hamlett KW, Marx CM & Blumer JL. Assessing distress in pediatric intensive care environments: the COMFORT scale. J Pediatr Psychol. 1992;17(1): 95-109.
11. Pijnappel WWF, Van den Boogaart A, De Beer R & Van Ormondt D. SVD-based quantification of magnetic resonance signals. J Magn Reson. 1992; 97(1):122-134.
12. Henning A, Schär M, Kollias SS, Boesiger P & Dydak U. Quantitative magnetic resonance spectroscopy in the entire human cervical spinal cord and beyond at 3T. J Magn Reson. 2008;59(6):1250-1258.
Figures

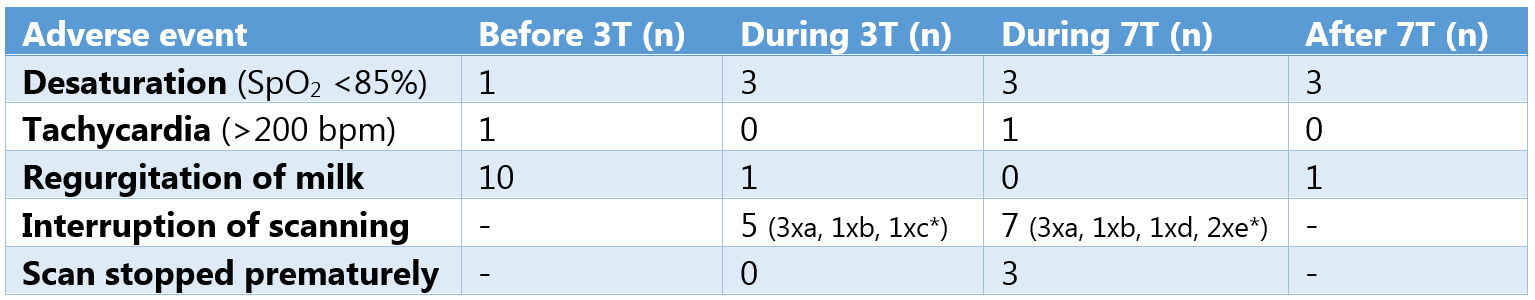
*a: crying but able to comfort; b: technical problems; c: movement artifacts; d: inadequate monitoring and e: other.