0736
Multinuclear lung MRI assessment of COVID-19 patients at 6 and 12 weeks after hospital admission1Infection, Immunity and Cardiovascular Disease, University of Sheffield, Sheffield, United Kingdom, 2Sheffield Teaching Hospitals, Sheffield, United Kingdom, 3GlaxoSmithKline, Stevenage, United Kingdom, 4Oxford NHS Foundation Trust, Oxford, United Kingdom, 5University of Oxford, Oxford, United Kingdom, 6University of Sheffield, Sheffield, United Kingdom
Synopsis
This work uses a multinuclear 1H and 129Xe protocol to assess pathophysiological changes in patients with COVID-19 pneumonia, without signs of interstitial lung disease, at 6 and 12 weeks after hospital admission. 1H and 129Xe protocol: ultra-short echo time, dynamic contrast enhanced lung perfusion, 129Xe lung ventilation, 129Xe diffusion weighted MRI, 129Xe 3D spectroscopic imaging. Though significant improvements in lung ventilation homogeneity (decreased low ventilation percentage and ventilation coefficient of variation), gas transfer (increased RBC:TP, decreased TP T2*) and perfusion (increased pulmonary blood volume and flow) were seen between 6 and 12 weeks, low RBC:TP ratio persisted for some patients.
Introduction
Patients hospitalised with pneumonia due to SARS-CoV-2 infection display considerable overlap in clinical presentation with typical pneumonia and acute respiratory distress syndrome (ARDS), with patients exhibiting hyper-inflammation and progressive hypoxaemia. However, patients with severe COVID-19 also show evidence of an inflammatory and thrombotic vasculopathy with endothelial dysfunction and excessive blood flow to collapsed lung tissue[1].The consequences of these microvascular abnormalities alongside pulmonary scarring and abnormalities in gas transfer are unknown.Multinuclear MRI allows direct, regionally sensitive, measurement of pulmonary gas exchange (red blood cell to tissue plasma ratio – RBC:TP), perfusion (pulmonary blood volume, pulmonary blood flow and mean transit time – PBV, PBF, MTT), ventilation and microstructure (apparent diffusion coefficient and mean diffusive length scale - ACD and LmD). The aim of this ongoing work is to use a comprehensive multinuclear 1H and 129Xe protocol to assess pathophysiological changes in patients who had been hospitalised with COVID-19 pneumonia, during the post-acute period.
Methods:
9 patients with no previously diagnosed respiratory disease who were hospitalised with pneumonia due to COVID-19 infection were recruited. MRI examinations (1.5T, GE scanner) were acquired as close to the acute phase of COVID-19 pneumonia as possible and at ~12 weeks. Patients were excluded retrospectively if they showed signs of interstitial lung disease (ILD) on structural imaging, as judged by a clinical radiologist, at 12 weeks follow-up.1H MRI: ultra-short echo time (UTE) images were acquired with a 3D radial sequence during free-breathing with prospective respiratory bellows gating on expiration[2].
Dynamic contrast enhanced (DCE) lung perfusion MRI was acquired using time-resolved SPGR imaging with view sharing and parallel imaging. A half dose of Gadovist (0.05mL/kg) was administered at 4ml/s followed by a 10ml saline flush at 4ml/s. Parametric maps of pulmonary blood volume, pulmonary blood flow and mean transit time were calculated using indicator dilution theory[3].
129Xe MRI: 129Xe ventilation imaging using a 3D SSFP sequence[4] was acquired using a flexible quadrature transmit/receive vest coil after inhalation of 500ml 129Xe + 500ml N2. Lung ventilation distribution was categorised using a generalised linear binning method, to define ventilation defect (VDP), low ventilation percentage (VP), normal VP, and hyper VP for each patient. The global coefficient of variation of the segmented lung ventilation images (CV global) was also calculated.
129Xe DW-MRI was acquired after inhalation of 550ml 129Xe + 450ml N2 using a 3D SPGR multiple b-value sequence with compressed sensing[5]. Maps of 129Xe ADC and LmD from a stretched exponential model were calculated.
3D spectroscopic imaging of the gas and dissolved phase xenon resonance peaks (dissolved xenon in lung tissue and blood plasma TP and in blood red blood cells RBC)[6] was acquired using 1L of hyperpolarised 129Xe. Maps of gas transfer ratios (RBC:TP, RBC:Gas, TP:Gas) were calculated, as well as the T2* for each spectroscopic peak.
Global MRI metrics from visit 1 and visit 2 were compared using Wilcoxon signed-rank tests. Data are presented as median (range).
Results:
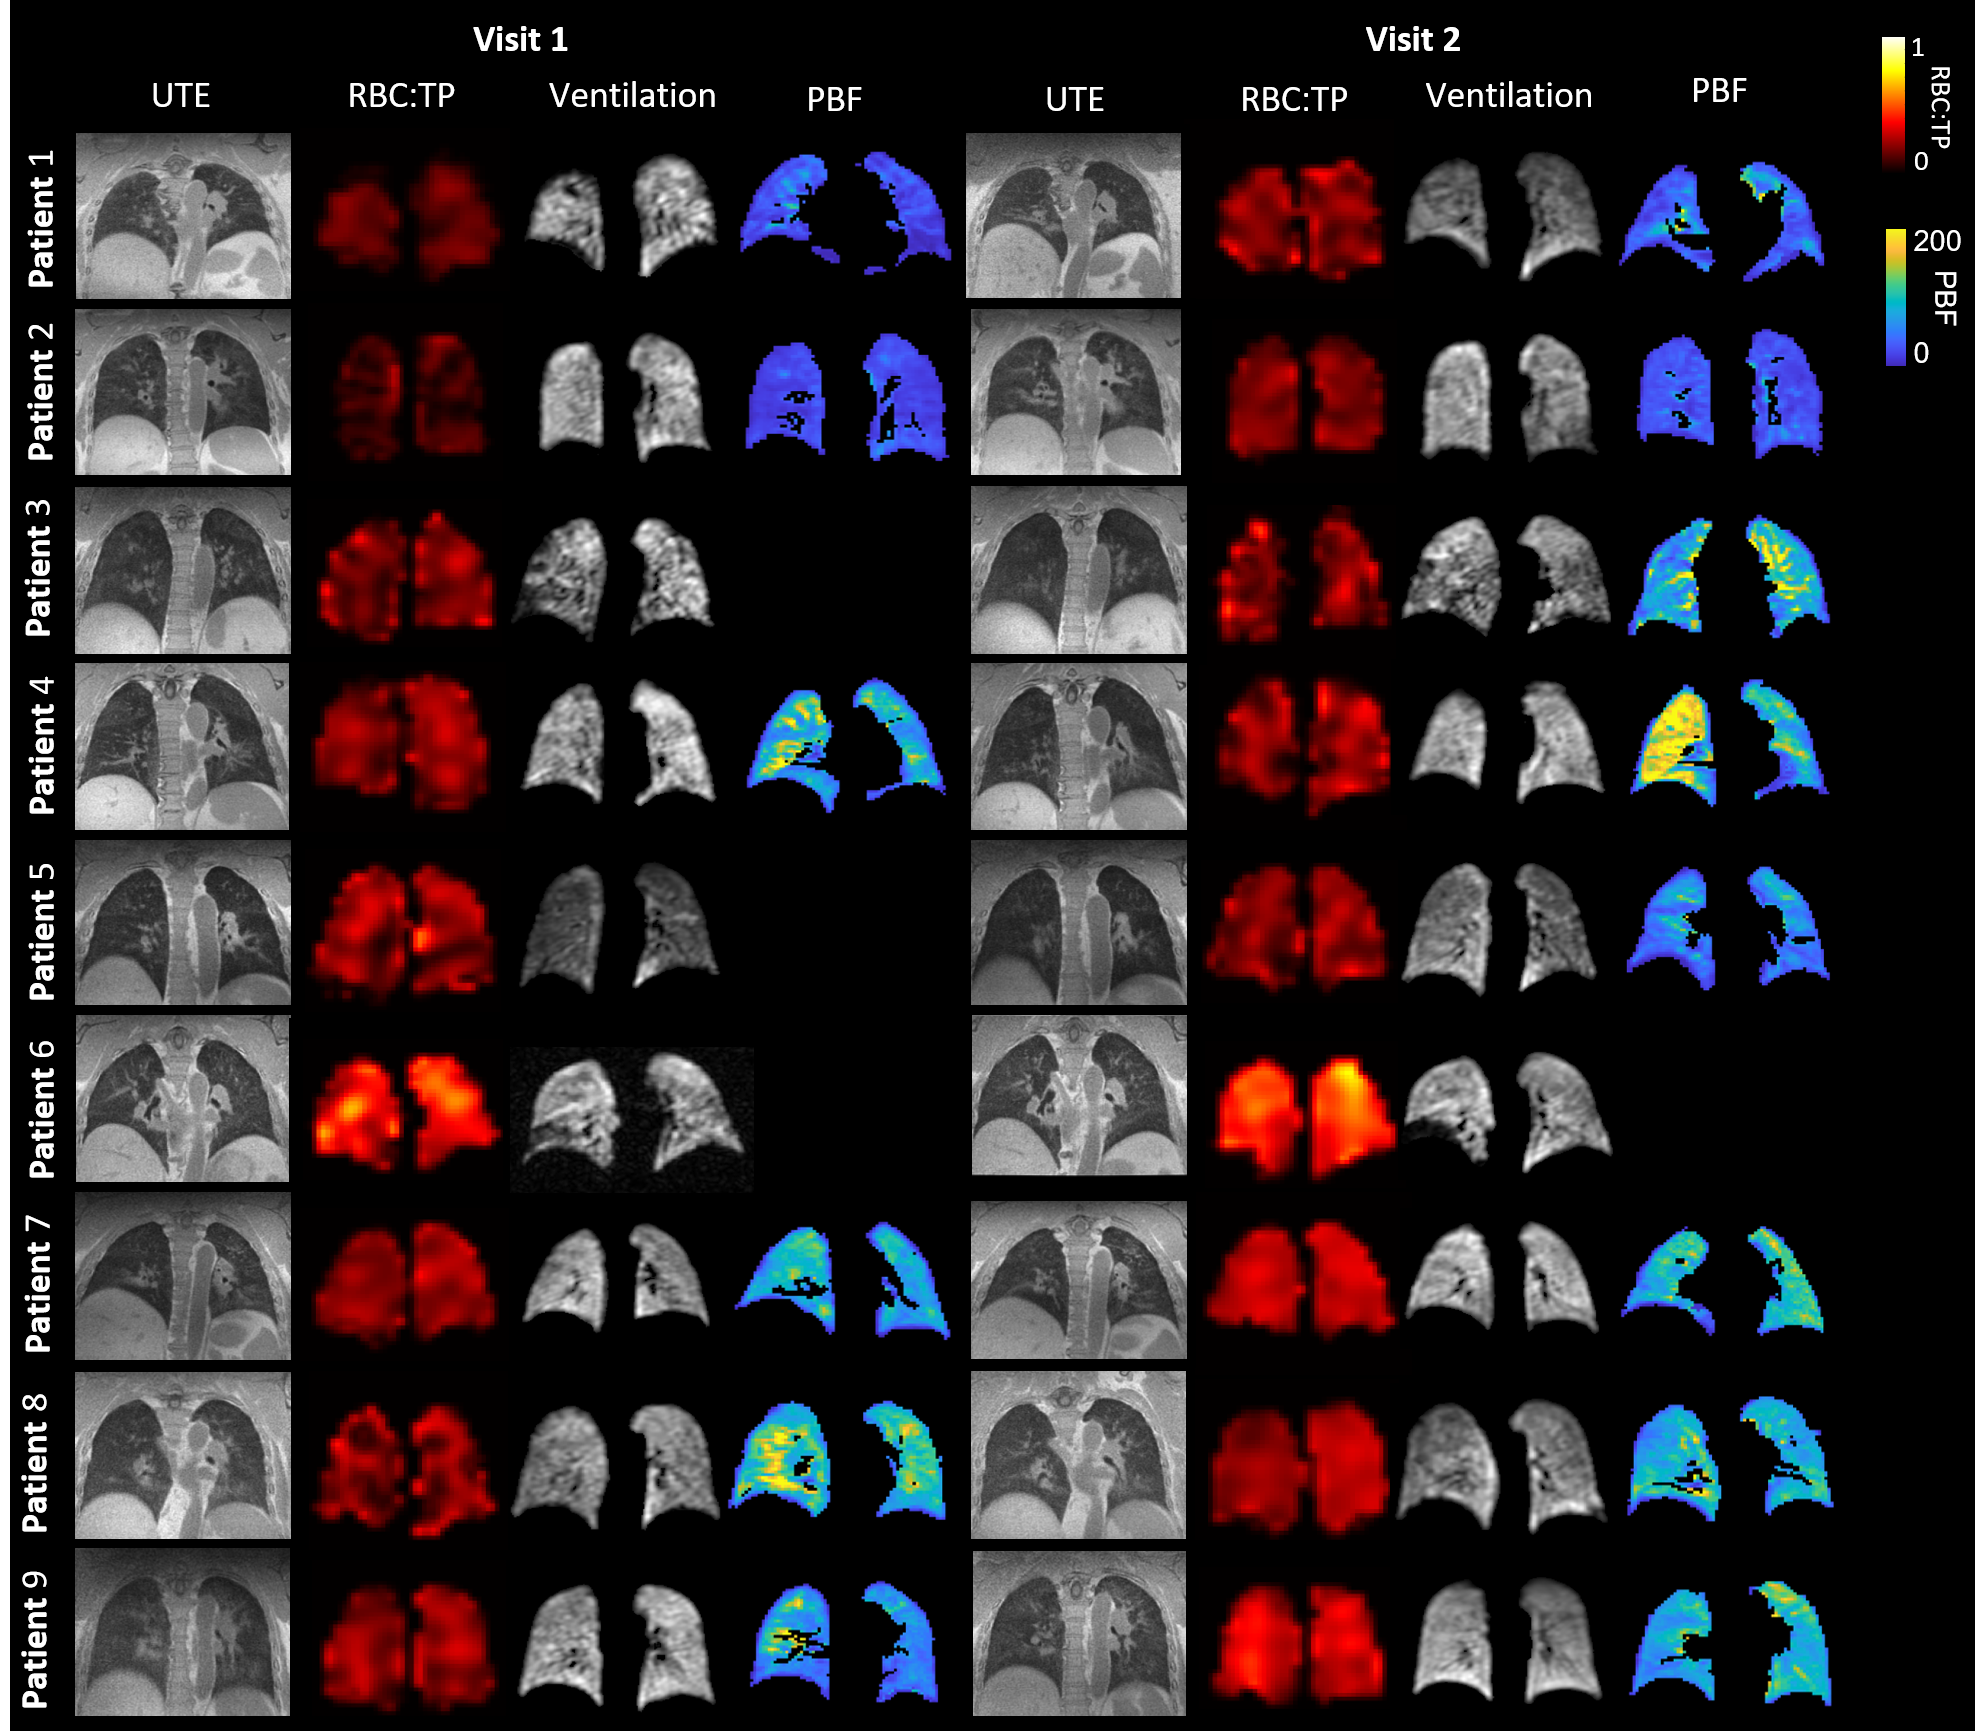
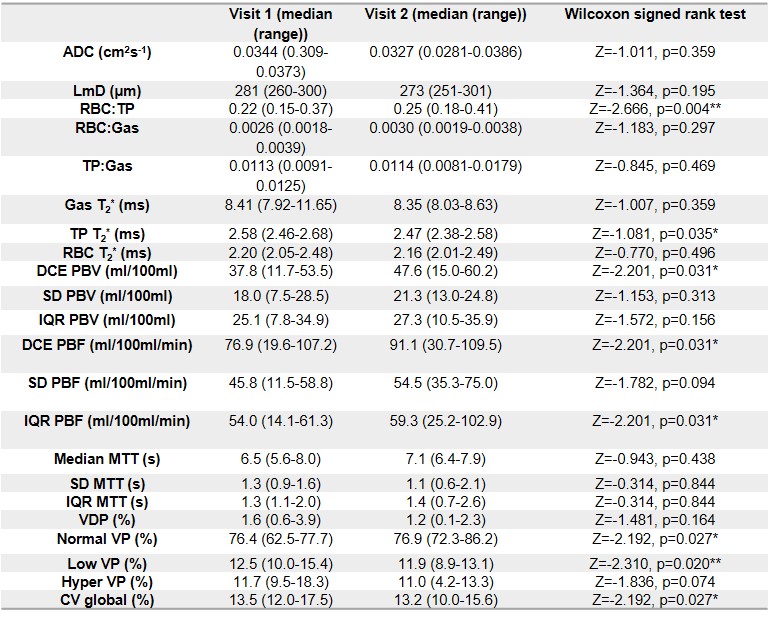
Visit 1 and visit 2 occurred at 6 (4-12) and 12 (12-22) weeks after hospital admission. 2/9 patients were female. Median patient age, height and weight were 57 years (25-77), 173cm (170-191) and 101kg (84-112).Example images for each patient are shown in Figure 1. Median values of all global metrics and associated p-values are shown in Table 1, and Figure 2. Median patient ADC and LmD were within a normal range at visits 1 and 2 [7], with no significant change at visit 2.
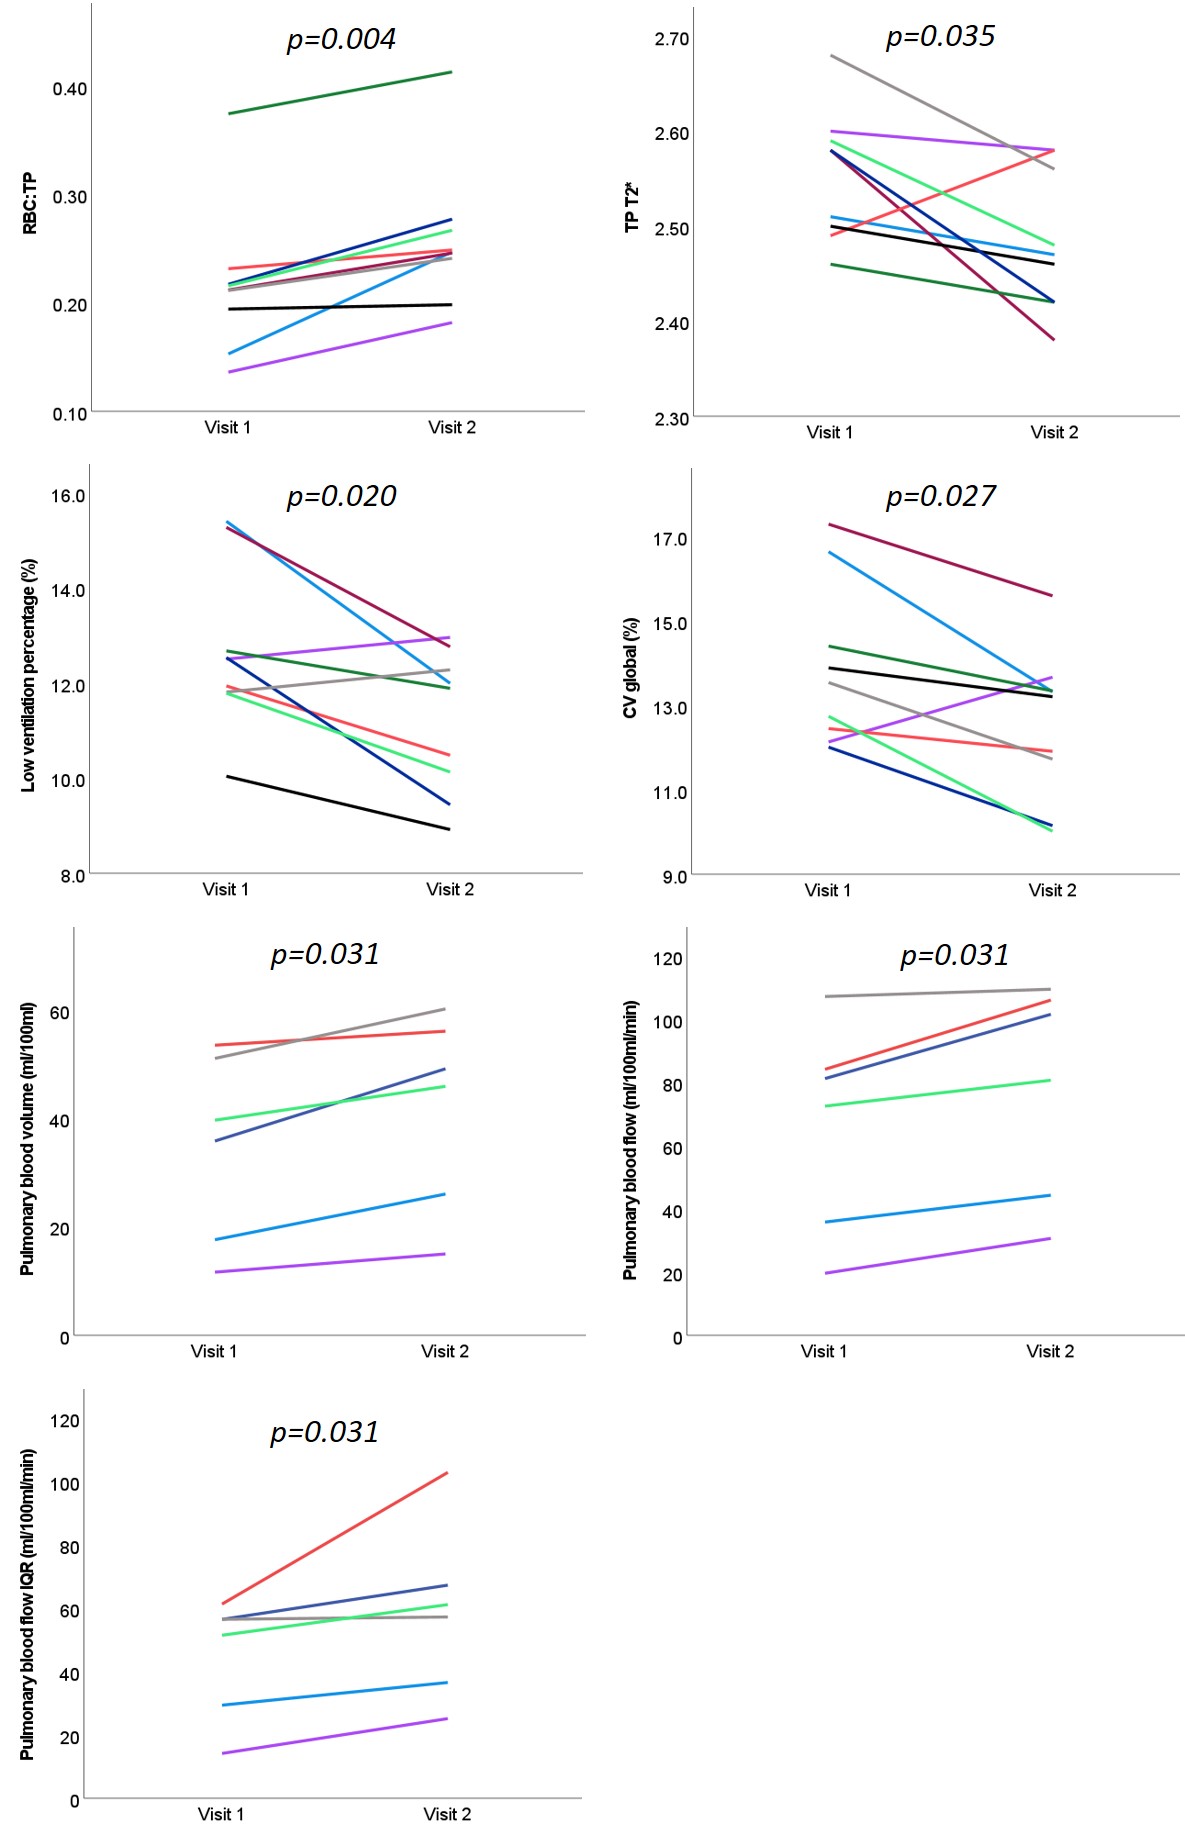
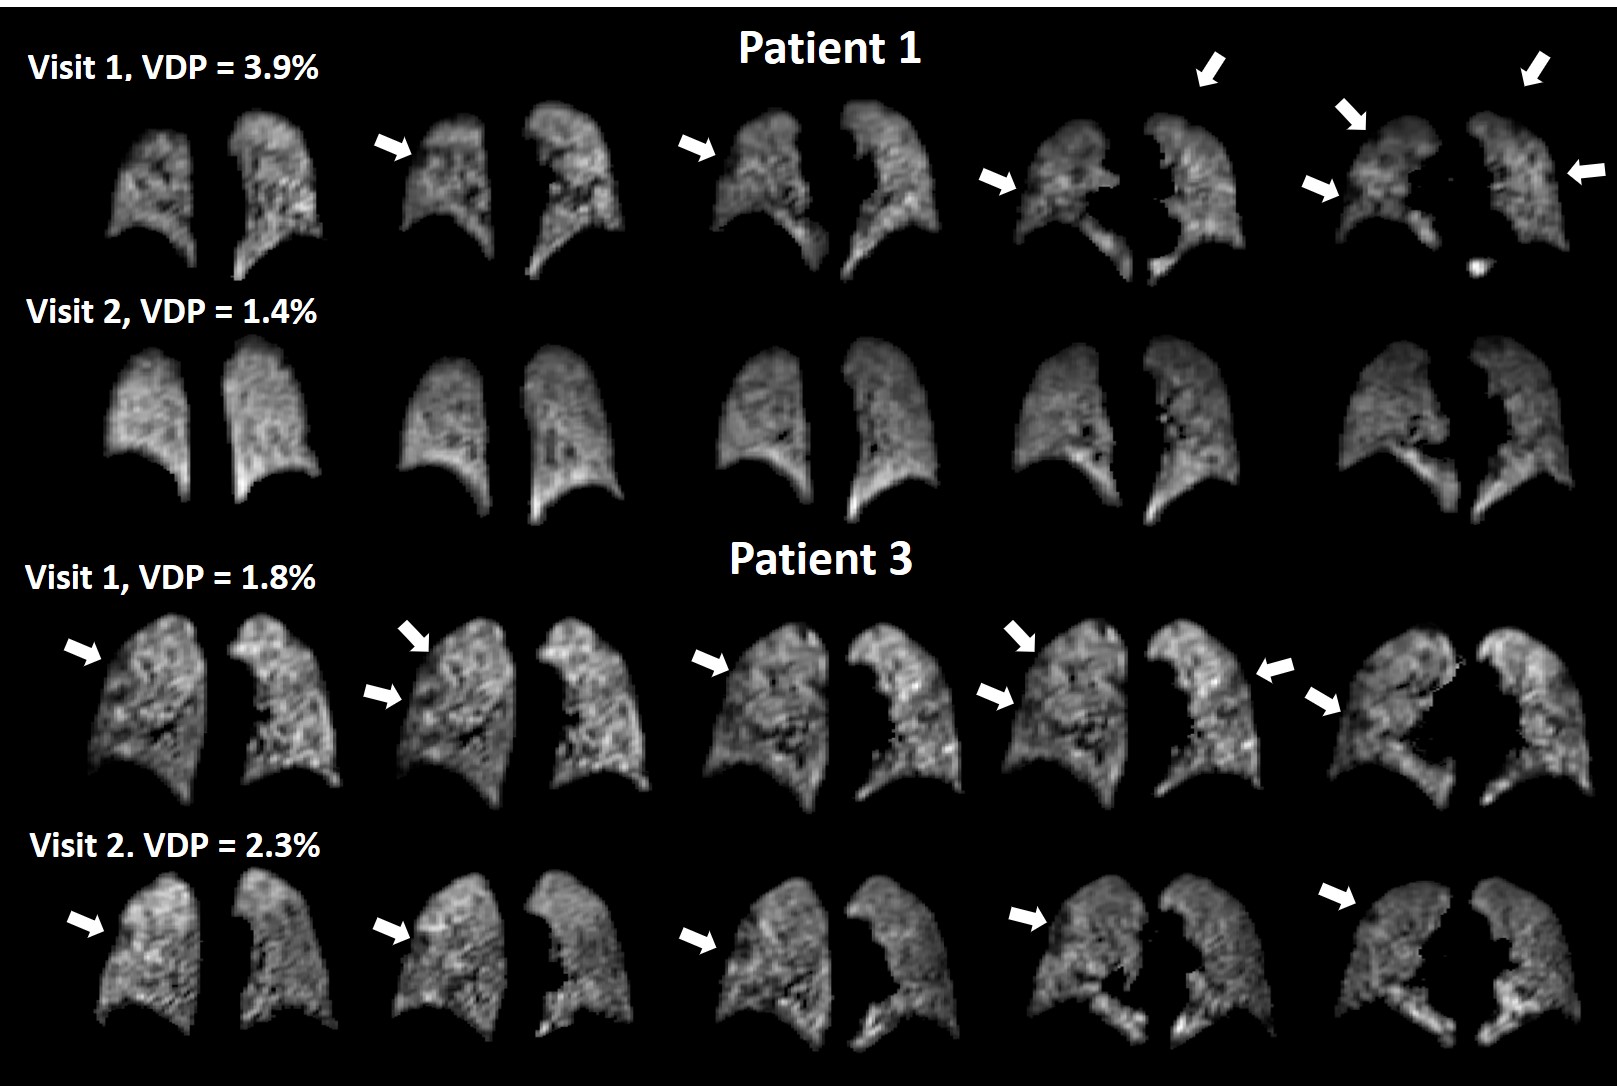
Small ventilation defects were visible in the peripheral lung in three patients (patient 1, patient 3 and patient 6), see Figure 3. Change in VDP between visit 1 and visit 2 was not significant. The percentage of the lung classified as low-ventilation showed a significant decrease at visit 2 from 12.5 (10.0-15.4)% to 11.9 (8.9-13.0)%. The coefficient of variation for lung ventilation significantly decreased at visit 2, from 13.5 (12.0-17.3)% to 13.2 (10.0-15.6)%.
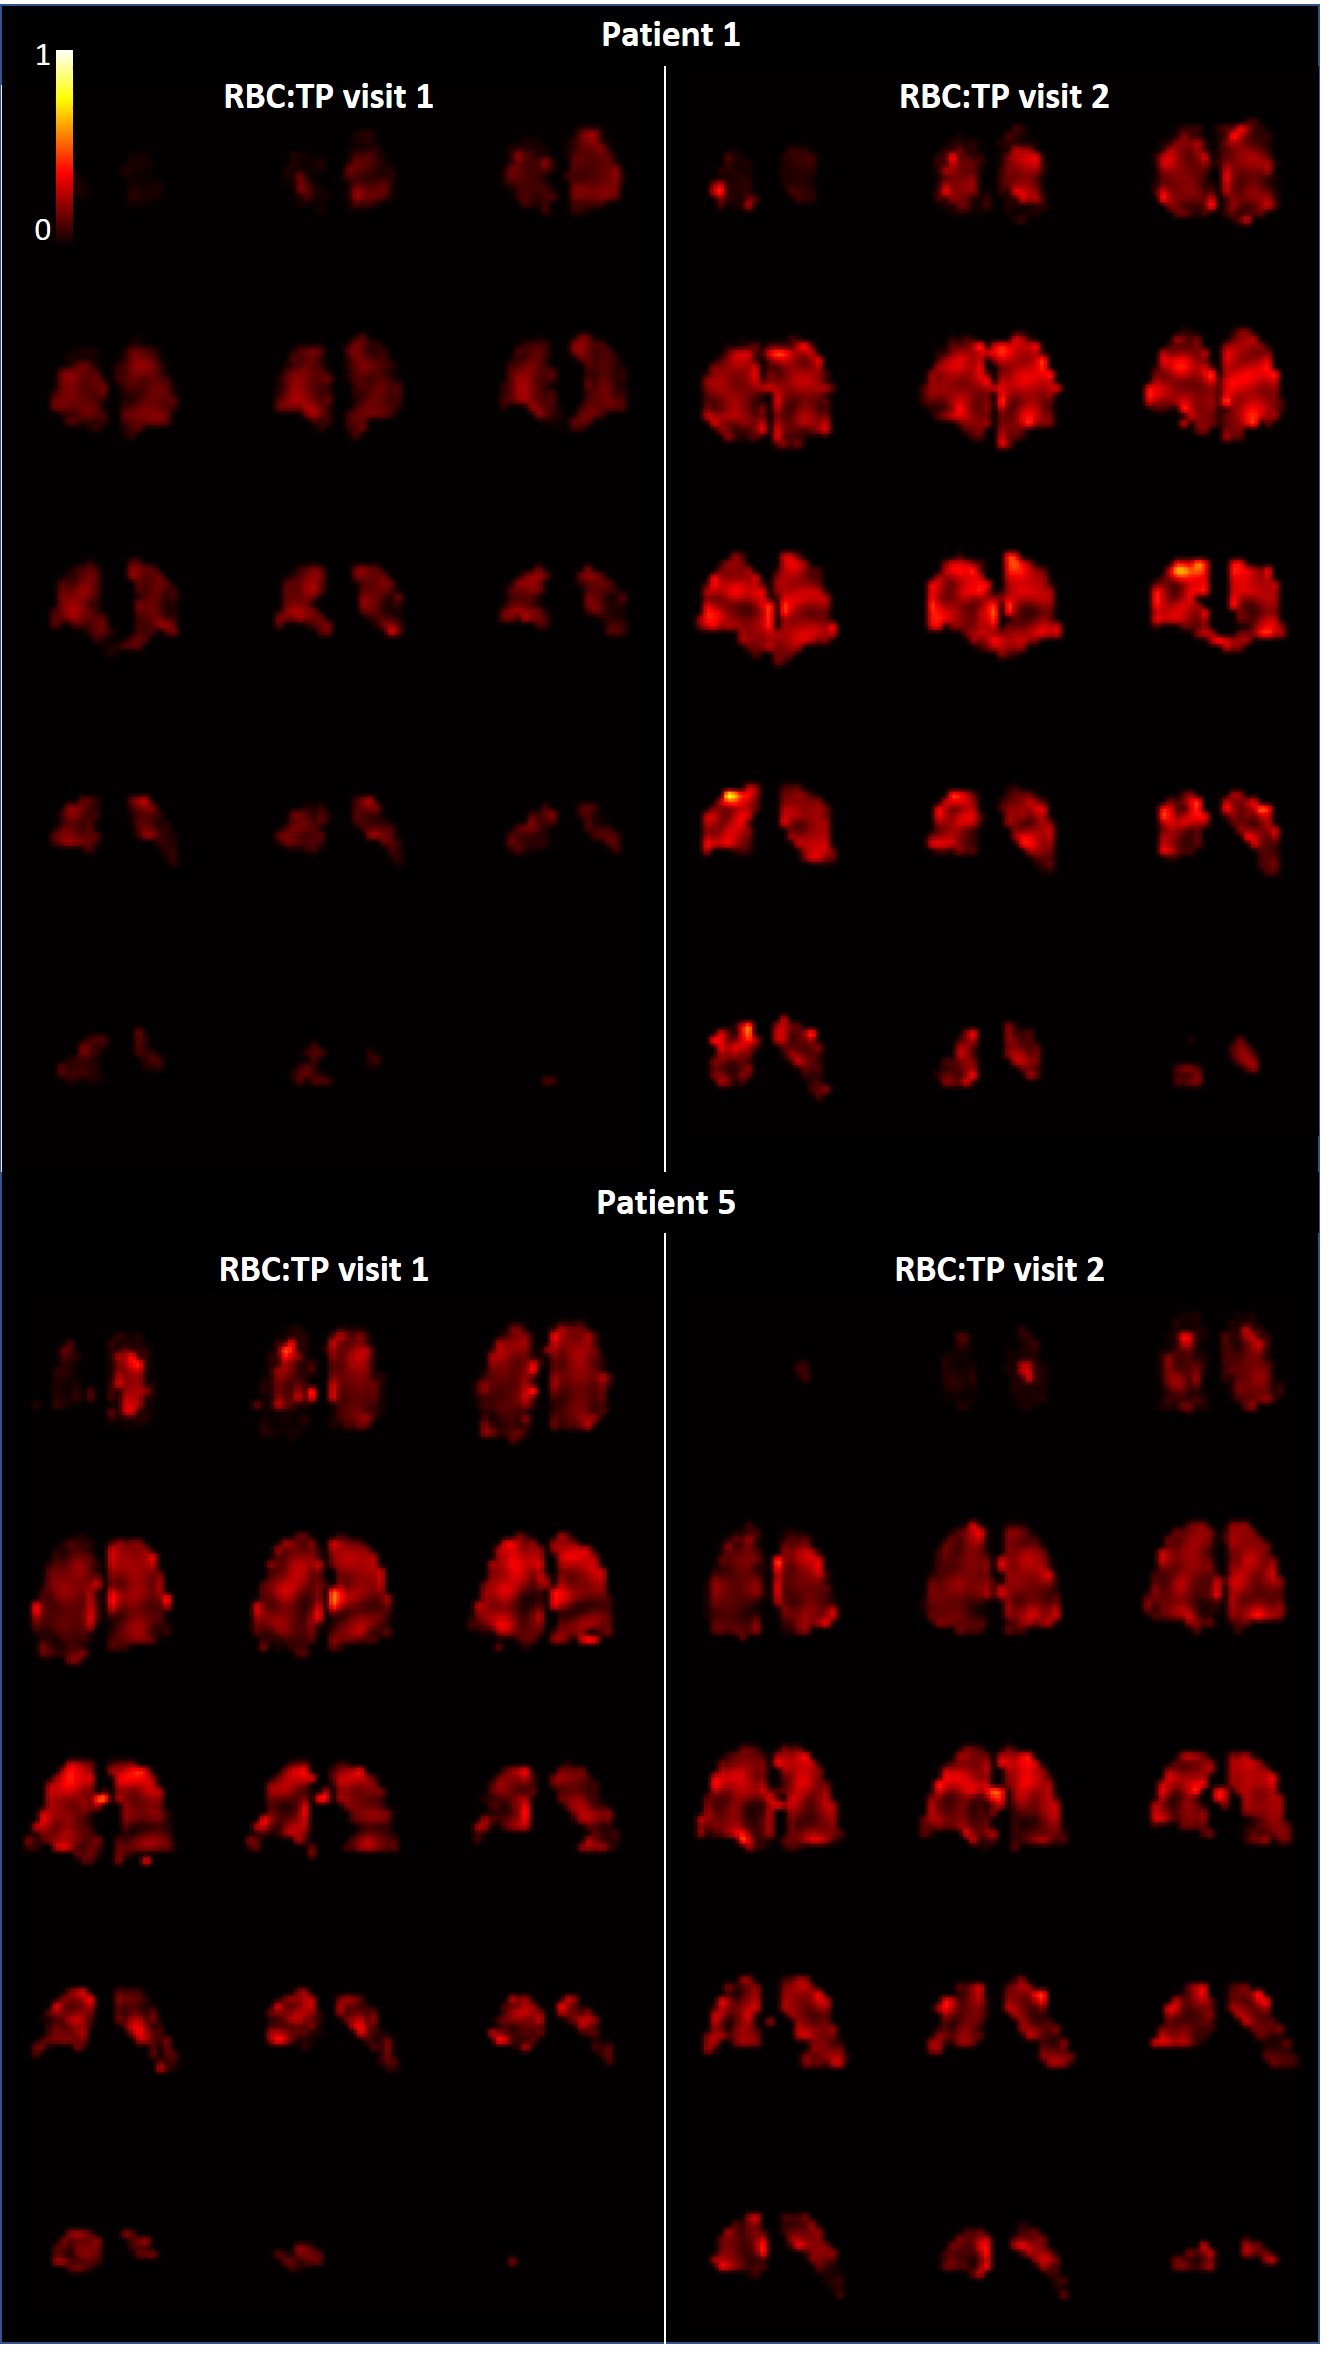
RBC:TP ratio was >2 standards deviation from mean normal values for 7/9 patients at visit 1 and 2/9 patients at visit 2 (healthy range RBC:TP ratio=0.419±0.098, based on in-house data age range 26-68 years). RBC:TP ratio significantly increased at visit 2 from 0.22 (0.15-0.37) to 0.25 (0.18-0.41), with no patients showing a decrease in RBC:TP at visit 2 compared to visit 1. Figure 4 shows whole lung RBC:TP maps in two patients.
5 patients had two visits with successful DCE imaging. At visit 2, there was a significant increase in median pulmonary blood volume from 37.8 (11.7-53.5)ml/100ml to 47.5 (15.0-60.2)ml/100ml. Median and interquartile range of pulmonary blood flow also increased at visit 2 from 76.9 (19.6-107.2)ml/100ml/min to 91.1 (30.7-109.5)ml/100ml/min and from 54.0 (14.1-61.3)ml/100ml/min to 59.3 (25.2-102.9)ml/100ml/min respectively.
Conclusions:
In patients who have had COVID-19 pneumonia without signs of ILD, at 12 weeks after admission, significant improvements are seen in lung ventilation, RBC:TP ratio and lung perfusion when compared to 6 weeks. Low RBC:TP ratio persists in 2/9 patients at 12 weeks. The improvements seen at visit 2 in both RBC:TP and lung perfusion in this cohort suggests that microvascular recovery may be driving the improvements seen in gas transfer.Acknowledgements
This work was supported by grants from GSK and GE.References
1. Attaway, A. H., et al., Severe covid-19 pneumonia: pathogenesis and clinical management.BMJ, 2021. 372(436). long term physical and mental impairments, and an interdisciplinary approach is essential for critical illness recovery.
2. Johnson, K.M., et al., Optimized 3D ultrashort echo time pulmonary MRI. Magn Reson Med, 2013. 70(5): p. 1241-50.
3. Sourbron, S.P. and D.L. Buckley, Classic models for dynamic contrast-enhanced MRI. NMR Biomed, 2013. 26(8): p. 1004-27.
4. Stewart, N. J., Norquay, G., Griffiths, P. D. & Wild, J. M. Feasibility of human lung ventilation imaging using highly polarized naturally abundant xenon and optimized three-dimensional steady-state free precession. Magn Reson Med 74, 346-352, doi:10.1002/mrm.25732 (2015)
5. Chan, H.F., et al., 3D diffusion-weighted (129) Xe MRI for whole lung morphometry. Magn Reson Med, 2018. 79(6): p. 2986-2995.
6. Collier, G. J., Acunzo, L. & Smith, L. in International Society for Magnetic Resonance in Medicine 2018. 4482
7. Petersson-Sjogren, M., et al., Airspace Dimension Assessment (AiDA) by inhaled nanoparticles: benchmarking with hyperpolarised (129)Xe diffusion-weighted lung MRI. Sci Rep, 2021. 11(1): 4721.
Figures