0735
Lung perfusion disturbances detected with MRI in non-hospitalized post-COVID individuals with dyspnea, with sex difference.
Jimmy Zhou Yu1,2, Tobias Granberg2,3, Roya Shams2, Sven Petersson2, Adrian Szum2, Magnus Sköld4, Sven Nyrén1,2, and Johan Lundberg2,3
1Department of Molecular Medicine and Surgery, Karolinska Institutet, Stockholm Solna, Sweden, 2Radiology department, Karolinska University Hospital, Stockholm, Sweden, 3Department of Neuroscience, Karolinska Institutet, Stockholm Solna, Sweden, 4Department of Medicine, Karolinska Institutet, Stockholm Solna, Sweden
1Department of Molecular Medicine and Surgery, Karolinska Institutet, Stockholm Solna, Sweden, 2Radiology department, Karolinska University Hospital, Stockholm, Sweden, 3Department of Neuroscience, Karolinska Institutet, Stockholm Solna, Sweden, 4Department of Medicine, Karolinska Institutet, Stockholm Solna, Sweden
Synopsis
Mechanisms underlying dyspnea in non-hospitalized patients with persistent post-COVID is unknown. Lung perfusion abnormalities have been reported in acute COVID-19, and may also be important in post-COVID. Dynamic contrast enhanced (DCE)-MRI [MS1] was applied to study lung perfusion in 28 non-hospitalized patients with persistent dyspnea 4-13 months post-COVID. Time-to-peak (TTP)[MS2] maps were numerically summarized as normalized as 2 numeric values: mean TTP and TTP ratio. Comparison was made against 22 age and sex matched controls. Perfusion abnormalities were found, with a striking sex difference with men showing more pronounced perfusion abnormalities. Perfusion abnormalities correlated with self-rated dyspnea in men.
Introduction
Dyspnea is a common in non-hospitalized patients suffering from post-COVID-19 condition (1). This group of patients is not yet well studied compared to the hospitalized patients. They often lack significant findings on computer tomography (CT) and spirometry, hindering understanding of disease mechanisms, and as a consequence, treatment of the condition.We hypothesize that lung perfusion abnormalities, reported in acute COVID-19 using different imaging methods (2–9), may contribute to dyspnea also in post-COVID condition (10,11). Lung perfusion abnormalities can be studied using dynamic contrast-enhanced magnetic resonance imaging (DCE-MRI) which, in a research context, has been able to detect and quantify lung perfusion abnormalities in a range of conditions (9,12–16).
Methods
In this prospective study, we recruited non-hospitalized patients with post-COVID condition through advertisement. Inclusion criterias were persistent dyspnea following a history of past COVID-19 infection, verified by real-time polymerase chain reaction. Participants were kindly asked to recruit a healthy control, with no COVID-suspect symptoms since the COVID-outbreak, and a negative antibody test within three weeks from the imaging point. Exclusion criteria were (i) a history of smoking for more than five years, (ii) any cardiovascular or (iii) pulmonary conditions requiring medical follow-up or treatment.DCE-MRI was performed between October 2020 and May 2021, using a Siemens MAGNETOM Skyra 3 Tesla scanner.Morphological sequences included a coronal T2-weighted half-Fourier single-shot spin-echo (“HASTE”, field-of-view 400×400 mm, voxel size 2.1 × 2.1 × 5 mm, echo/repetition times at 23/400 ms, 36 slices); and a transverse T1-weighted spoiled gradient echo (“VIBE”, field-of-view 262×400 mm, voxel size 1.0 × 1.0 × 4 mm, flip angle 5 °, echo/repetition times at 1.9/4 ms, 72 slices). The perfusion sequence, a keyhole T1-weighted gradient-recalled-echo (“TWIST”, field-of-view 450 × 450 mm, voxel size 1.5 × 1.5 × 4 mm, echo/repetition times at 0.64/1.9 ms, 26 slices, 90 phases in 40 seconds), was done following contrast injection (gadoterate meglumine, Clariscan, 0.5 mmol/ml, 2 ml, followed by 20 ml 0.9% saline solution with five ml/s), in inspired breathold.
Time-to-peak (TTP) lung maps were produced following manual lung-segmention of the perfusion volume. The TTP values were normalized to the TTP of PA (as 0) and of the aorta (as 1). Using a straightforward method previously applied by the research group (9), mean TTP of the lung voxels, and the ratio of voxels peaking after the aortic peak (TTP ratio) were calculated from the TTP map. This imaging-postprocessing pipeline is summarized in Figure 1.
A six-minute walk test (6MWT) was performed immediately following imaging. Self-rated scales on dyspnea (Chronic obstructive pulmonary disease Assessment Test, CAT) [MS1] and physical activity (Frändin-Grimby) were collected (17–19).
Comparison between groups were done using Student’s t-test for parametric data, and Mann-Whitney for non-parametric data. Comparison of sex differences were done using ANOVA, with Dunn-Sidak correction. Correlations between perfusion parameters and clinical variables were investigated using Spearman’s correlation. All data processing was done in Matlab.
Results
Altogether 28 non-hospitalized participants (75% females; mean age 46.5 ± 8.0 years) with post-COVID condition and a disease onset 4-13 months before imaging, and 22 healthy controls (73% females; mean age 44.1 ± 10.8 years) were included (Figure 2). The post-COVID group scored significantly more dyspnea (P<0.001), lower physical activity (P<0.001), and had a shorter walking distance on 6MWT (P=0.001).No significant morphological lung abnormalities were detected in any of the participants. Post-COVID participants had a higher mean TTP (0.43±0.04 vs. 0.41±0.03, P=0.011) and higher TTP ratio (0.096±0.052 vs. 0.068±0.027, P=0.032), compared to the healthy controls. Notably, post-COVID males had the highest values (mean TTP 0.47±0.02, TTP ratio 0.160±0.039), which is significantly higher compared to both male controls and post-COVID females, (P<0.01 for both values). The values for each group is summarized in Figure 3. The post-COVID males also demonstrated significant correlations between dyspnea and perfusion (r=0.83, P<0.001 for mean TTP; r=0.76, P=0.003 for TTP ratio), but not the females.
Discussion
We demonstrate perfusion abnormalities in a convenience sample of non-hospitalized post-COVID patients by applying DCE-MRI with TTP quantification. A higher mean TTP reflects an overall impaired blood-flow into the lung. A higher TTP ratio means that a larger portion of the lung had a non-physiological bolus contrast arrival later than aorta. Interestingly, there was a distinct sex difference, with post-COVID males having significant more perfusion abdormalities, correlating with dyspnea. This difference, relative to females, could imply sex-related differences in the underlying mechanisms of dyspnea. In the acute phase, men tend to have more severe respiratory impairments, while women have stronger immune reaction (20). Our findings also indicate physiological abnormalities beyond morphological changes, similar to other studies using DECT or hyperpolarized 129Xe MRI (8,21). Perfusion abnormalities up to 1 year after symptom onset could suggest a long-lasting or even perpetual lung injury in some patients.Conclusion
We believe this MRI-lung perfusion study adds to the evidence that perfusion abnormalities remains a crucial feature in COVID pathophysiology, even after the acute infection. The distinct sex difference has implications for understanding the post-COVID dyspnea and warrants consideration in future studies. Method refinement could provide clinically feasible biomarkers for studying lung perfusion and the efficacy of interventions, as well as help further uncover the exact nature of dyspnea.Acknowledgements
No acknowledgement found.References
1. Fernández-de-las-Peñas C, Palacios-Ceña D, Gómez-Mayordomo V, Florencio LL, Cuadrado ML, Plaza-Manzano G, et al. Prevalence of post-COVID-19 symptoms in hospitalized and non-hospitalized COVID-19 survivors: A systematic review and meta-analysis. Eur J Intern Med [Internet]. 2021 Jun 16 [cited 2021 Sep 22]; Available from: https://www.ncbi.nlm.nih.gov/pmc/articles/PMC8206636/2. Ackermann M, Verleden SE, Kuehnel M, Haverich A, Welte T, Laenger F, et al. Pulmonary Vascular Endothelialitis, Thrombosis, and Angiogenesis in Covid-19. N Engl J Med. 2020 Jul 9;383(2):120–8.
3. Bösmüller H, Traxler S, Bitzer M, Häberle H, Raiser W, Nann D, et al. The evolution of pulmonary pathology in fatal COVID-19 disease: an autopsy study with clinical correlation. Virchows Arch. 2020 Jun 30;1–9.
4. Polak SB, Van Gool IC, Cohen D, von der Thüsen JH, van Paassen J. A systematic review of pathological findings in COVID-19: a pathophysiological timeline and possible mechanisms of disease progression. Modern Pathology. 2020 Jun 22;1–11.
5. Lucatelli P, Monte MD, Rubeis GD, Cundari G, Francone M, Panebianco V, et al. Did we turn a blind eye? The answer is simply there. Peripheral pulmonary vascular thrombosis in COVID-19 patients explains sudden worsening of clinical conditions. Imaging. 2020 Aug 6;12(1):4–7.
6. Si-Mohamed S, Chebib N, Sigovan M, Zumbihl L, Turquier S, Boccalini S, et al. In vivo demonstration of pulmonary microvascular involvement in COVID-19 using dual-energy computed tomography. Eur Respir J [Internet]. 2020 Oct 29 [cited 2021 Jan 18];56(4). Available from: https://www.ncbi.nlm.nih.gov/pmc/articles/PMC7676875/
7. Ridge CA, Desai SR, Jeyin N, Mahon C, Lother DL, Mirsadraee S, et al. Dual-Energy CT Pulmonary Angiography (DECTPA) Quantifies Vasculopathy in Severe COVID-19 Pneumonia. Radiology: Cardiothoracic Imaging [Internet]. 2020 Oct 29 [cited 2021 Jan 18]; Available from: http://pubs.rsna.org/doi/abs/10.1148/ryct.2020200428
8. Santamarina MG, Boisier Riscal D, Beddings I, Contreras R, Baque M, Volpacchio M, et al. COVID-19: What Iodine Maps From Perfusion CT can reveal—A Prospective Cohort Study. Critical Care. 2020 Oct 21;24(1):619.
9. Rysz S, Al-Saadi J, Sjöström A, Farm M, Campoccia Jalde F, Plattén M, et al. COVID-19 pathophysiology may be driven by an imbalance in the renin-angiotensin-aldosterone system. Nature Communications. 2021 Apr 23;12(1):2417.
10. Dhawan RT, Gopalan D, Howard L, Vicente A, Park M, Manalan K, et al. Beyond the clot: perfusion imaging of the pulmonary vasculature after COVID-19. The Lancet Respiratory Medicine. 2021 Jan 1;9(1):107–16.
11. Evbuomwan O, Engelbrecht G, Bergman MV, Mokwena S, Ayeni OA. Lung perfusion findings on perfusion SPECT/CT imaging in non-hospitalized de-isolated patients diagnosed with mild COVID-19 infection. The Egyptian Journal of Radiology and Nuclear Medicine. 2021;52(1):144.
12. Groß V, Zahn K, Maurer K, Wessel L, Schaible T, Schoenberg SO, et al. MR lung perfusion measurements in adolescents after congenital diaphragmatic hernia: correlation with spirometric lung function tests. Eur Radiol [Internet]. 2021 Nov 6 [cited 2021 Nov 10]; Available from: https://link.springer.com/10.1007/s00330-021-08315-9
13. Risse F, Eichinger M, Kauczor H-U, Semmler W, Puderbach M. Improved visualization of delayed perfusion in lung MRI. European Journal of Radiology. 2011 Jan;77(1):105–10.
14. Amundsen T, Torheim G, Kvistad KA, Waage A, Bjermer L, Nordlid KK, et al. Perfusion abnormalities in pulmonary embolism studied with perfusion MRI and ventilation-perfusion scintigraphy: An intra-modality and inter-modality agreement study. Journal of Magnetic Resonance Imaging. 2002;15(4):386–94.
15. Sergiacomi G, Taglieri A, Chiaravalloti A, Calabria E, Arduini S, Tosti D, et al. Acute COPD exacerbation: 3 T MRI evaluation of pulmonary regional perfusion – Preliminary experience. Respiratory Medicine. 2014 Jun 1;108(6):875–82.
16. Dehnert C, Risse F, Ley S, Kuder TA, Buhmann R, Puderbach M, et al. Magnetic Resonance Imaging of Uneven Pulmonary Perfusion in Hypoxia in Humans. Am J Respir Crit Care Med. 2006 Nov 15;174(10):1132–8.
17. ATS Statement. Guidelines for the Six-Minute Walk Test. Am J Respir Crit Care Med. 2002 Jul 1;166(1):111–7.
18. Daynes E, Gerlis C, Briggs-Price S, Jones P, Singh SJ. COPD assessment test for the evaluation of COVID-19 symptoms. Thorax. 2021 Feb 1;76(2):185–7.
19. Grimby G, Frändin K. On the use of a six-level scale for physical activity. Scandinavian Journal of Medicine & Science in Sports. 2018;28(3):819–25.
20. Haitao T, Vermunt JV, Abeykoon J, Ghamrawi R, Gunaratne M, Jayachandran M, et al. COVID-19 and Sex Differences: Mechanisms and Biomarkers. Mayo Clinic Proceedings. 2020 Oct 1;95(10):2189–203.
21. Grist JT, Chen M, Collier GJ, Raman B, AbuEid G, McIntyre A, et al. Hyperpolarized 129Xe MRI Abnormalities in Dyspneic Participants 3 Months after COVID-19 Pneumonia: Preliminary Results. Radiology. 2021 May 25;210033.
Figures
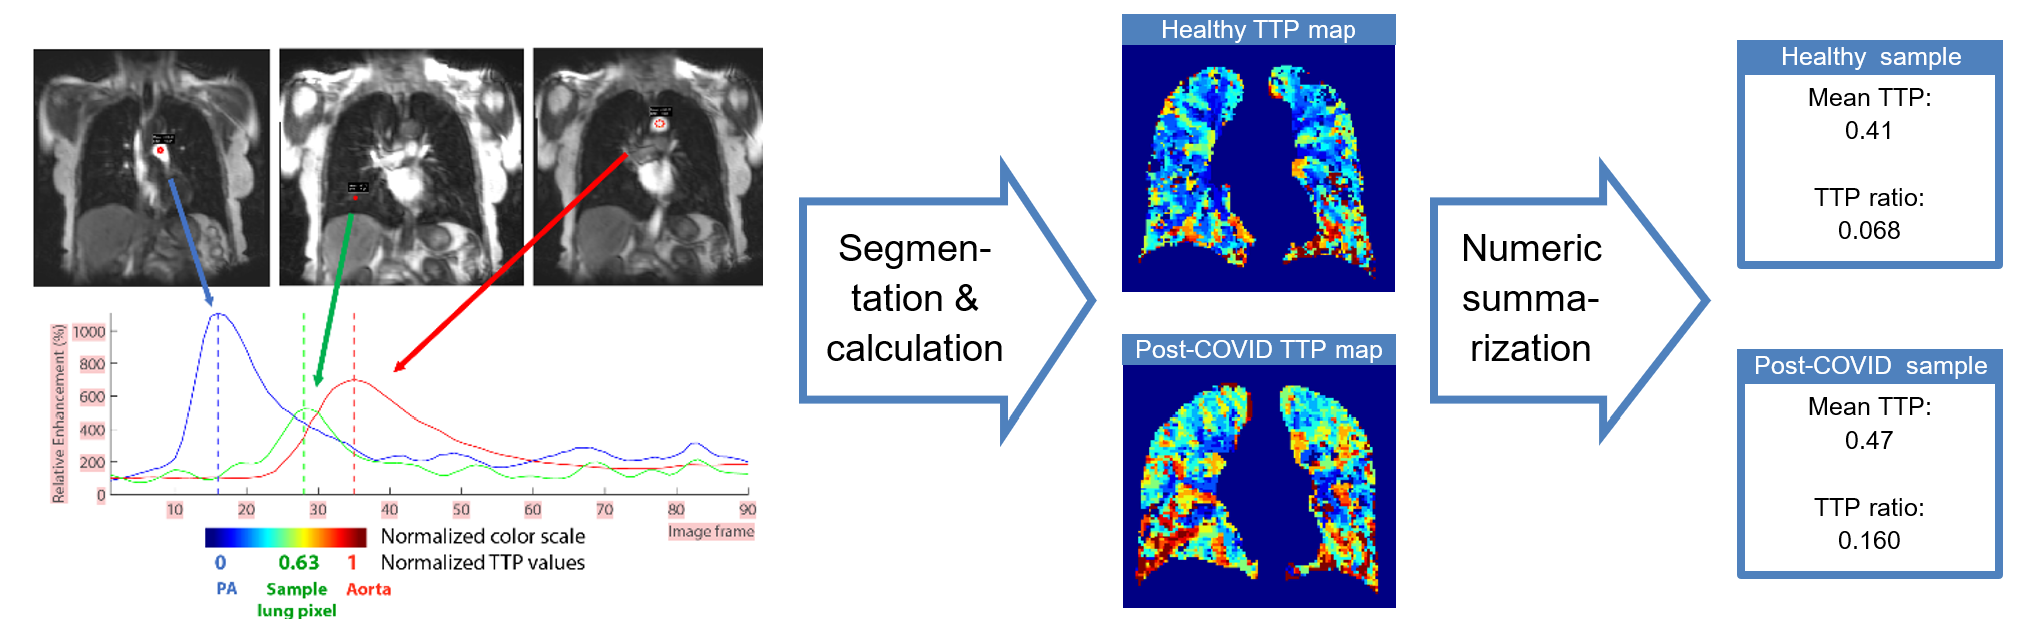
Figure 1. Summary of the
imaging-postprocessing pipeline. The color scale of time-to-peak (TTP)-maps are
shown in the left subpart.
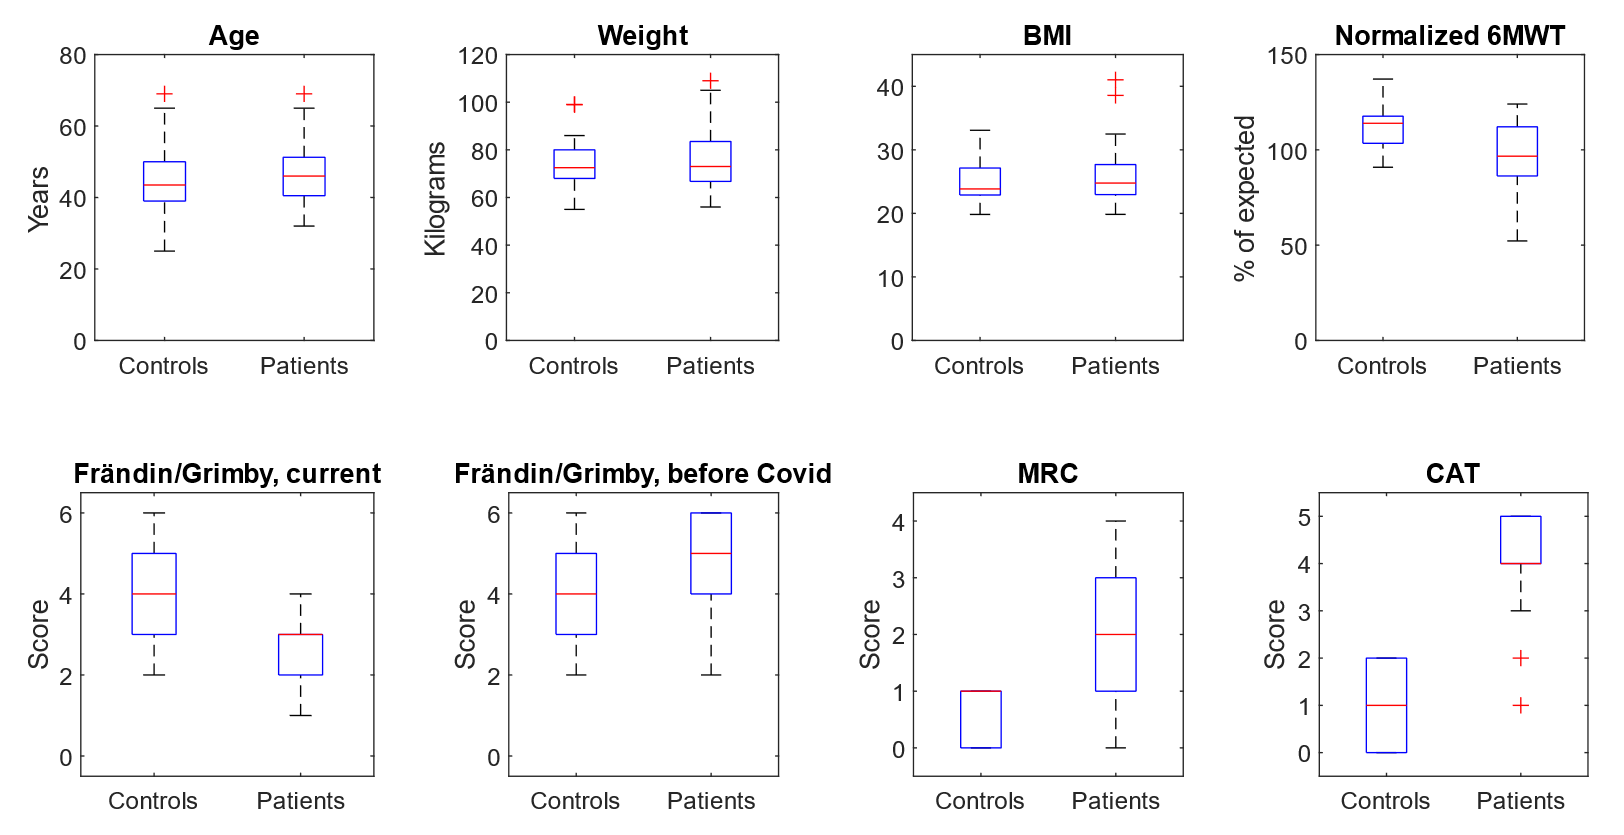
Figure 2. Clinical
characteristics. The box boundaries represents the 25 and 75 percentiles of
each group. The red line is median. Abbreviations and explanation: BMI = Boxy
Mass Index; 6MWT = 6 minute walk test; Frändin/Grimby: physical activity scale
where 6 is very high activity, 1 is near none; MRI = modified Medial Research
Council dyspnea scale; CAT = the dyspnea dimension of Chronic obstructive
pulmonary disease assessment test. In both dyspnea scales, higher values
denotes more dyspnea.

Figure 3. Perfusion parameters.
The box boundaries represents the 25 and 75 percentiles of each group. A higher
TTP ratio means a larger portion of the lung having bolus contrast arrival
later than aorta. A higher mean TTP reflects an overall slower inflow of
blood into the lung. Abbreviations: hM = healthy males, hF = healthy females,
pM = post-COVID males, pF = post-COVID females.
DOI: https://doi.org/10.58530/2022/0735